Written by Lance Roberts, Clarity Financial
— this post by Michael Liebowitz
Halloween is around the corner, and in celebration of the season, we thought we would provide you with tricks and treats that the markets might be handing out in the coming months. We also have an idea for someone looking for a one-of-a-kind costume.

Trick: Taper
The Federal Reserve has been treating the market with record amounts of liquidity for the last ten years. As Lance Roberts mentioned in his recent report, The Fed Balance Sheet Unwind Myth, the Fed has begun to reduce the size of its balance sheet (aka taper) and slowly take those treats back from the market. Whether the market initially ignores the Fed’s actions is anyone’s guess, however, over time the drawdown of liquidity will become a bigger impediment to future gains and likely a tail-wind for the inevitable reversion back to normal valuations.
In Lance’s report, he also stated “the Bond Bull ain’t dead… It’s just resting“. To further his thoughts, the following chart plots excess reserves (black), a direct byproduct of QE and Ten-year Treasury yields (green). Based on the Fed’s taper plans we also plotted expected changes in excess reserves (black dotted line) and how those changes might affect Treasury yields (green dotted line).
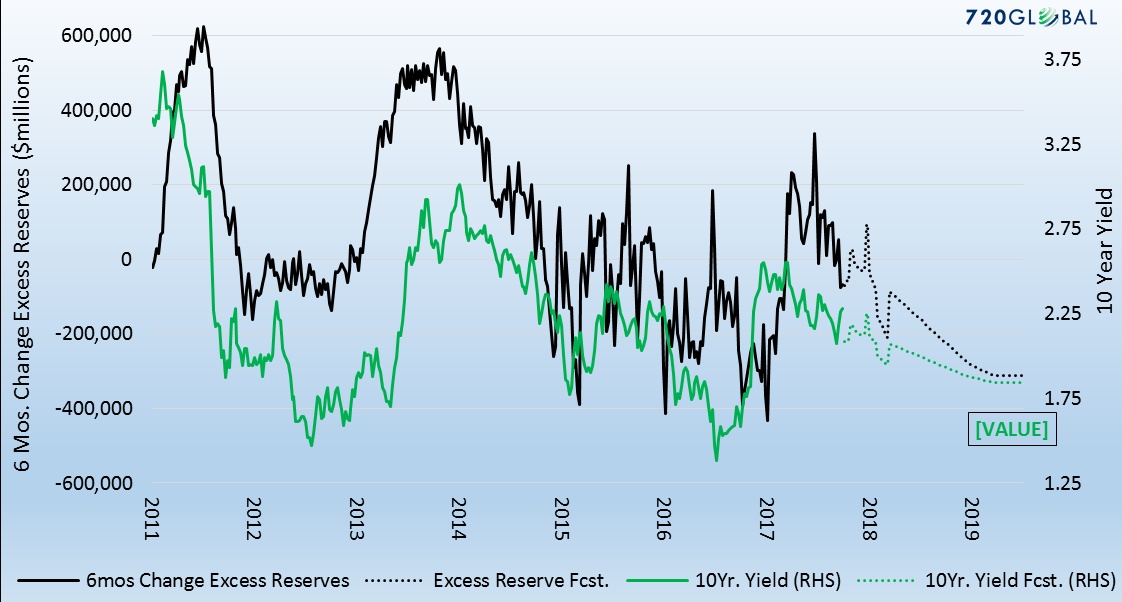
From my latest subscription only article “Draining the Punchbowl”:
“While one might assume that a reduction in the Fed’s balance sheet and the resulting increased supply of bonds might be bearish for bonds, there are bullish considerations. They are as follows:
- If the Fed reduces the money supply, the dollar might appreciate, import prices would fall and inflation prospects would weaken.
- An appreciating dollar tightens global financial conditions, stresses economic activity and lowers economic growth prospects.
- As banks reduce reserves, they will need to increase capital and purchase U.S. Treasury securities.
- If weakness of stock prices ensues, one should expect investors to seek the safety of the bond market in order to reduce risk.”
Treat: Employment
Next Friday the Bureau of Labor Statistics (BLS) will release the vaunted employment report for October. Last month was a ghoulish report, posting a 33,000 decline in payrolls. Little attention was paid to the data as distortion from Hurricane Harvey was largely to blame. Since that report, there are encouraging signs that employment data has normalized and possibly further strengthened. The most recent weekly jobless claims data has declined to levels last seen in the 1970’s. Current consensus expectations are for a sharp rebound of 310,000 new jobs in Friday’s report.
Trick: Earnings
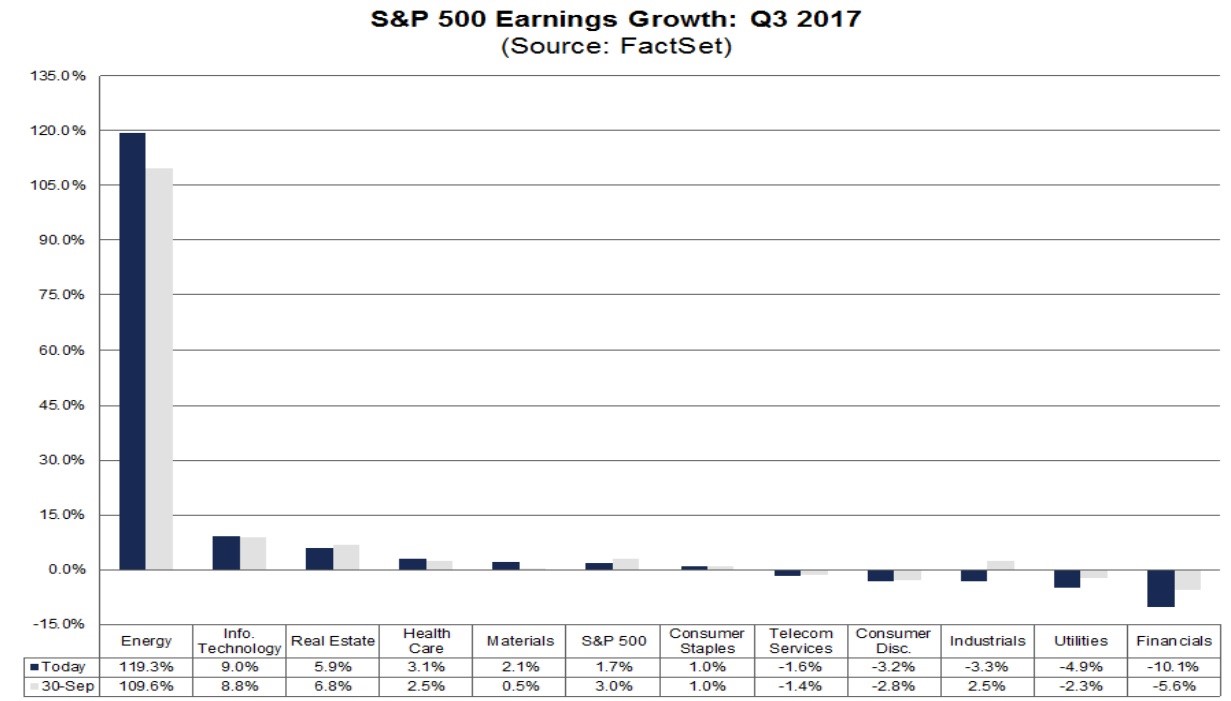
As shown in the graph below, third quarter S&P 500 earnings are expected to increase at a 1.7% rate, down from the 3.0% rate expected only three weeks ago (circled below). More concerning, however, is that the energy sector, despite its small weighting in the S&P 500 contributed significant earnings growth to the entire S&P 500. Without the 119.3% growth from the energy industry, S&P earnings would be down 0.2%. It is important to realize that energy earnings are not a boom per se but a one-off rebound from horrific earnings of 2016. Such earnings growth will not be repeated.
Trick or Treat: Taylor or Powell?
On Thursday the media reported that Donald Trump’s choice for Chairman of the Federal Reserve has been narrowed down to Stanford economist John Taylor and current Fed governor Jerome Powell. Interestingly, the finalists represent both sides of the policy spectrum. Taylor has been vocal that interest rates should be raised. In fact, based on his famous Taylor Rule, the Fed Funds rate should be 3.75%, roughly 2.50% higher than current levels. Powell on the hand takes a dovish posture, similar to that of Janet Yellen. Based on his remarks we might see further rate increases but at a very modest pace and likely pauses or even rate decreases if economic data suffers. A Powell selection is likely more bullish for stocks and bonds as the abundant liquidity provided by the Fed will be around longer than what might occur under a Taylor led Fed.
Unique Costume this Halloween: Bear Outfits
Our friend Willie Delwiche, (Investment Strategist at Baird @williedelwiche) shared a graph on Twitter that helps put the current level of stock market complacency in proper context.
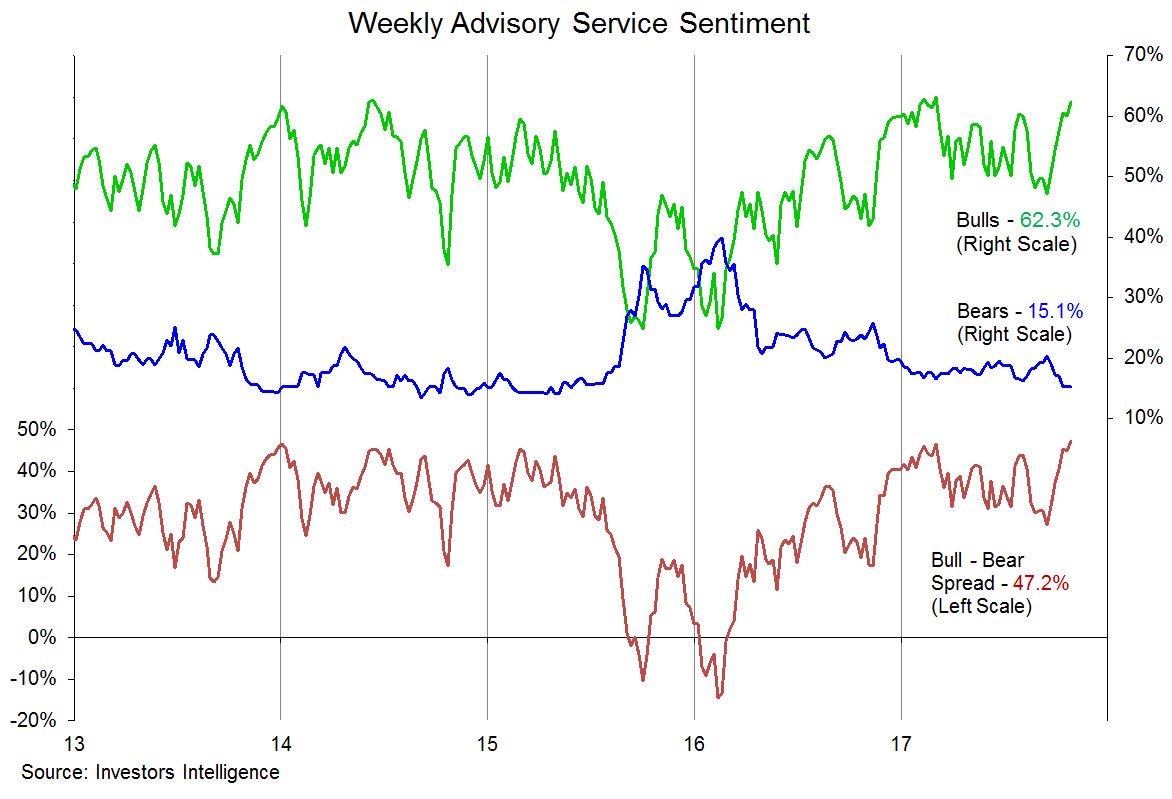
The graph above measures investor sentiment for the last five years. Investors Intelligence surveys equity investors to track the number of people that consider themselves bullish or bearish. Currently, the gap between bulls and the bears stands at not only the highest level since 2013 as shown but the highest level going back to at least 1987. Interestingly, at this juncture of record bullishness, there are even less confessed bears than in 2007 or 1999, the periods just before market drawdowns of over 50%.
The takeaway: Donald Trump, Brexit, Leicester City Football Club, and the New England Patriots have taught us a valuable lesson:
“When no one expects the unexpected, expect it.”


