
Written by Rick Ackerman, Rick’s Picks
The Dow Jones Industrial Average (DJIA) recently sailed past a 21,763 target derived from a nine-month uptrend on the daily chart, so I’ve hauled out the weekly chart for a look at a much bigger picture. It projects a possible bull-market top at 23,317 while leaving room for yet higher targets.

Please share this article – Go to very top of page, right hand side, for social media buttons.
Even so, the ABC rally pattern shown below offers enough clarity to suggest that when the Dow hits 23,317 the Hidden Pivot is not going to give way easily.
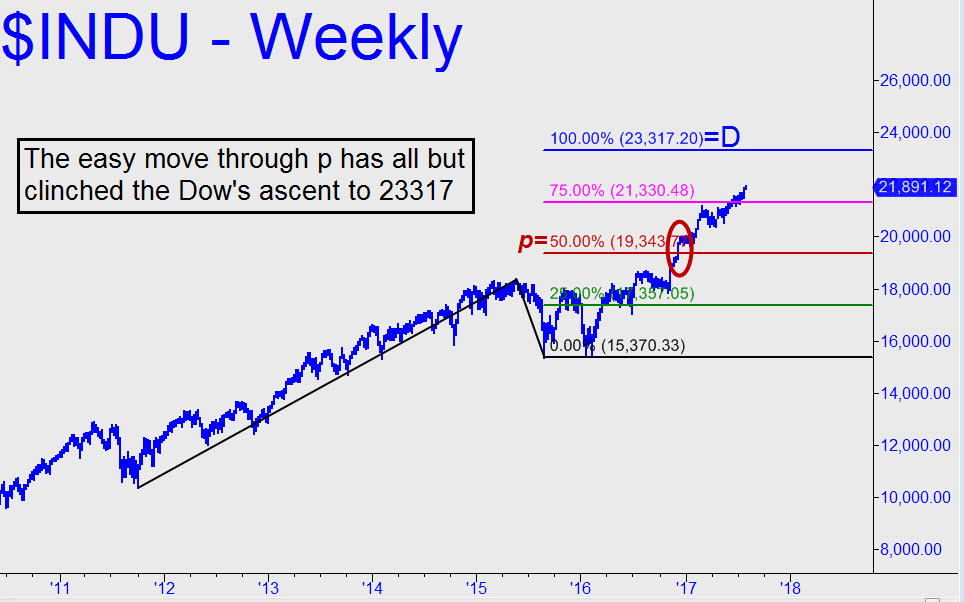
As to the likelihood that this number will indeed be reached, I would say there’s about an 85% chance. Mainly, it is a matter of how buyers smoked the midpoint Hidden Pivot resistance at 19,343 the first time they encountered it. Moreover, the first pullback that followed failed to come down to the red line, demonstrating that Mr Market was, and still is, in no mood to defer to timid bulls who are hesitant to jump aboard. If he runs true to form, the pitch of the rally is likely to steepen in the weeks ahead, perhaps producing the blowoff top that so many of us have patiently awaited for so long.
If you are not a subscriber, click here for a free two-week trial that will allow you to enter the Rick’s Picks chat room, where great traders from around the world gather 24/7.


