Written by Rick Ackerman, Rick’s Picks
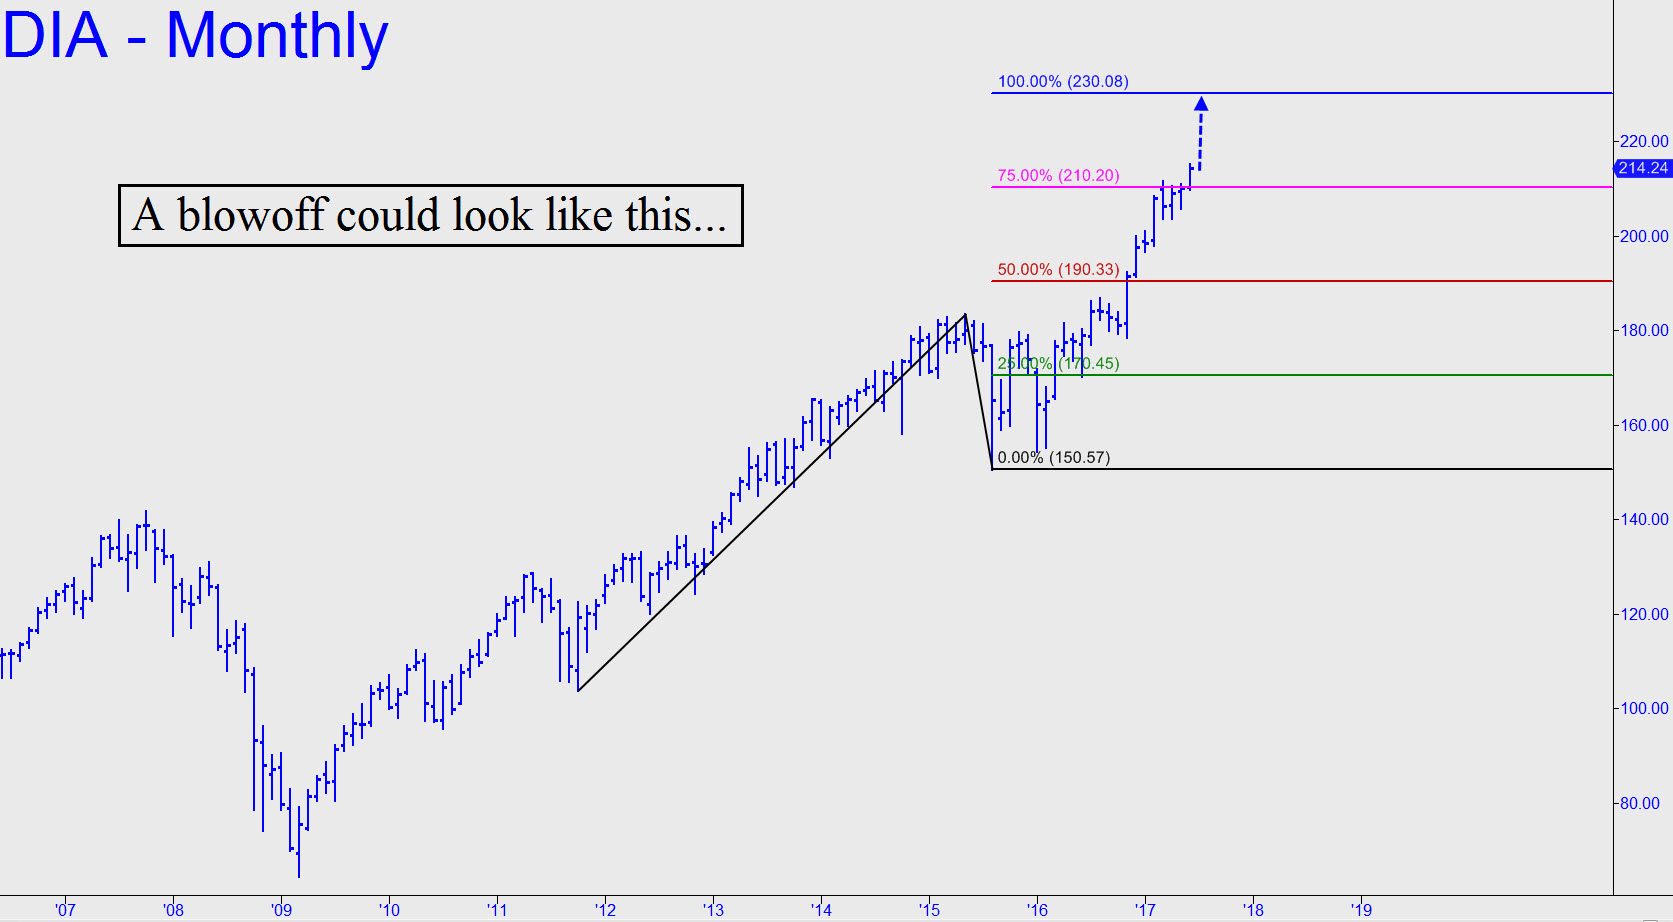
We began the day Wednesday bidding for put options but backed away when DIA opened strong and forged higher. I now expect this vehicle to reach the 230.08 target shown (chart later, below). This is a major Hidden Pivot resistance, and although it’s possible to extrapolate even higher projections up to 269.40 from the monthly chart, the pattern I’ve selected looks more likely to produce the major top we’ve been looking for.

Please share this article – Go to very top of page, right hand side for social media buttons.
At the very least, it should produce a tradeable top, and that’s why we must be prepared to get short there with a stop-loss as tight as 1.00 point. How long might it take? My guess is three to six weeks, judging from the dramatic way the bull market’s trajectory has steepened since this phase of it began in August 2015.
If the target were to be reached in just three weeks, the implied 1600-point rally in the Dow would effect a blowoff worthy of the name. We should be ready for it regardless, but in the meantime any swing trades we initiate should be from the long side. You should stay tuned to the chat room in real time if you’re interested, since getting aboard with risk under tight control, presumably using ‘camouflage’ entry set-ups, will require very close attention to the lesser intraday charts.
Note from the author: If you are not a subscriber, click here for a free two-week trial that will allow you to enter the Rick’s Picks chat room, where great traders from around the world gather 24/7.


