Written by Lance Roberts, Clarity Financial
S&P 500 Tear Sheet
The “Tear Sheet” below is a “reference sheet” provide some historical context to markets, sectors, etc. and looking for deviations from historical extremes.

Please share this article – Go to very top of page, right hand side for social media buttons.
If you have any suggestions or additions you would like to see, send me an email.
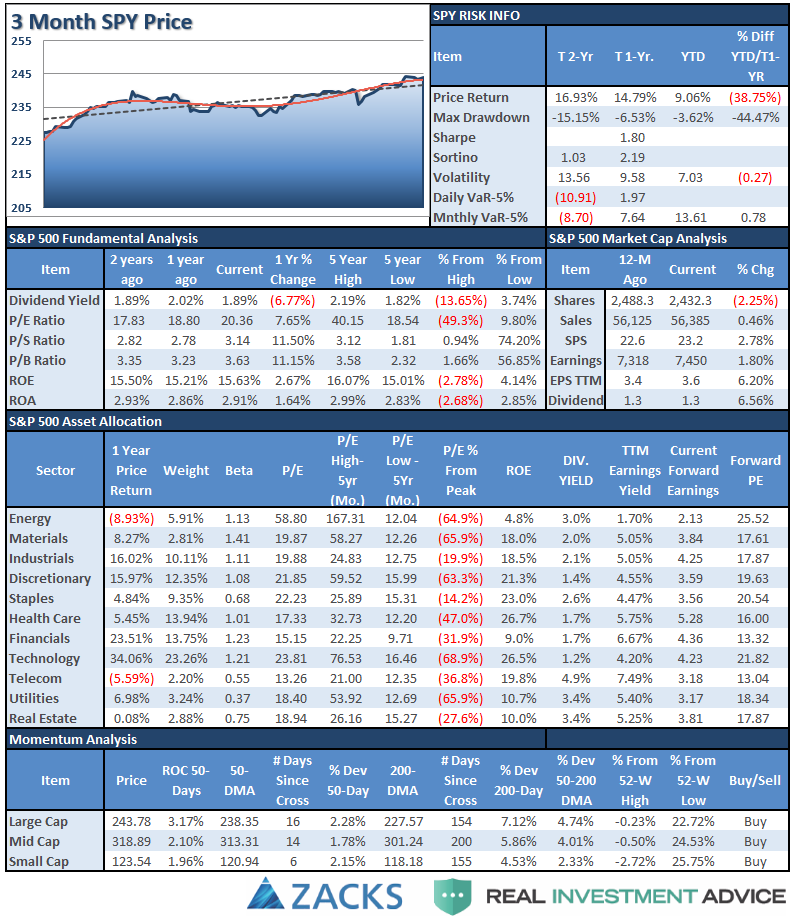
Performance Analysis
New! Thank you for all the comments on the performance analysis below. Due to many of the emails I got, I have swapped out the sector weight graph for a year-to-date performance range analysis. Keep the comments coming. (Email Me)

Do you find this chart useful? If you have any suggestions or additions you would like to see, send me an email.
Sector Analysis
As noted last week, we have added modestly to our broader-based “core” holdings to participate with the breakout. Stops have been moved up and remain very tight. A reversal and failure of the breakout would NOT be surprising.
On a bullish note, participation has finally started to improve. The improvement suggests there could be at least some short-term “legs” to the current advance as the market rotates leadership, however, with the markets extremely overbought currently, sustainability remains a concern.

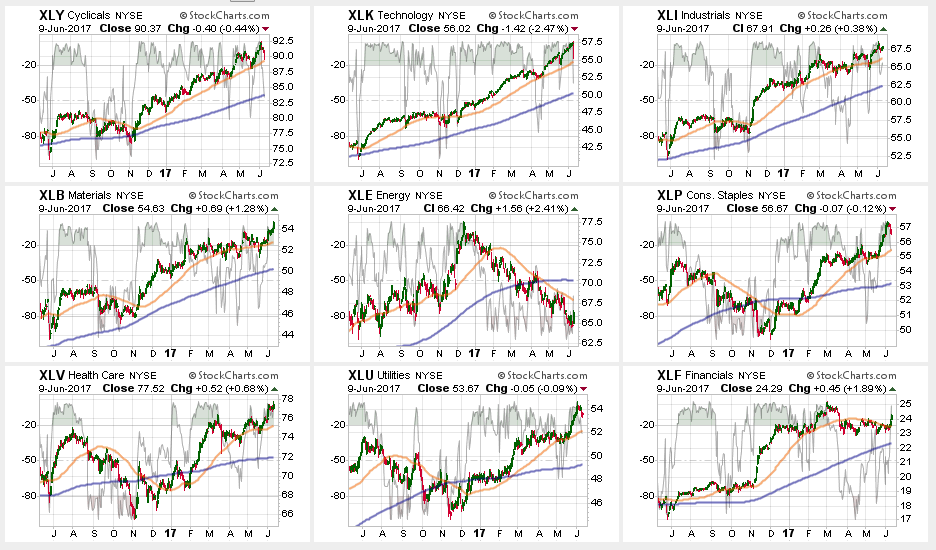
Sector Review
Whoa! Did That Just Happen? PAY CLOSE ATTENTION TO DISCRETIONARY AND TECHNOLOGY.
I have previously discussed what will happen when someone hits the “sell” button. If you weren’t paying attention on Friday, you missed it.
Both Discretionary and Technology plunged on Friday as a headline from Goldman Sachs questioning “tech valuations” sent algo’s running wild. The plunge was extremely sharp but fortunately regained composure and shares rebounded. A “flash crash.”
One day, we will not be so lucky. But the point I want to highlight here is this is an example of the “price vacuum” that can occur when computers lose control. I can not stress this enough. This is THE REASON why the next major crash will be worse than the last.
While Technology, Staples, Discretionary and Utilities gave up some ground last week, In Financials, Health Care, Materials, and Industrials all took the lead.
Financials popped above their 50-dma average on a bill passed in Congress which will repeal Dodd-Frank and unleash the “holy hell” of Wall Street back onto Main Street. However, it’s good for the bank’s profit margins, so financial’s rose. The bill is unlikely to pass in the Senate due to the “Audit The Fed” language contained in the bill. Therefore, I would “fade” the financial rally for now.
Energy – Despite the OPEC meeting extending production cuts and the rally in oil prices, the sector remains in a negative downtrend. With a major sector sell signal, and the cross of the 50-dma below the 200-dma, we remain out of the space for the time being.

Small and Mid-Cap stocks regained their respective 50-dma’s which removes their warning signs. Both sectors also improved on a relative basis by outperforming the broad market. Maintain exposure for now.
Emerging Markets and International Stocks continued their strength since their election lows as money continues to chase performance. There is a good bit of risk built into international stocks currently. We took profits a few weeks ago, but the recent extension suggests another round of rebalancing is likely wise. Take profits and rebalance sector weights but continue to hold these sectors but stop levels should be moved up to the 50-dma.
Gold – The rally in Gold over the last couple of weeks once again failed at critical resistance at 1300/oz keeping us out of our long-term positions. Short-term trading positions will be stopped out on a move below 1220/oz.
S&P Dividend Stocks regained key support levels currently after briefly breaking below their 50-dma. Hold current positions but maintain stops at the recent lows.
Bonds and REIT’s continued their advances this week breaking solidly above resistance. With the 50-dma’s moving upward, these sectors can be added to selectively if underweight. However, this feeds back into the conundrum of the overall market, with both offensive and defensive sectors rallying, someone is going to be wrong. We will be watching these sectors for clues as to what happens next.
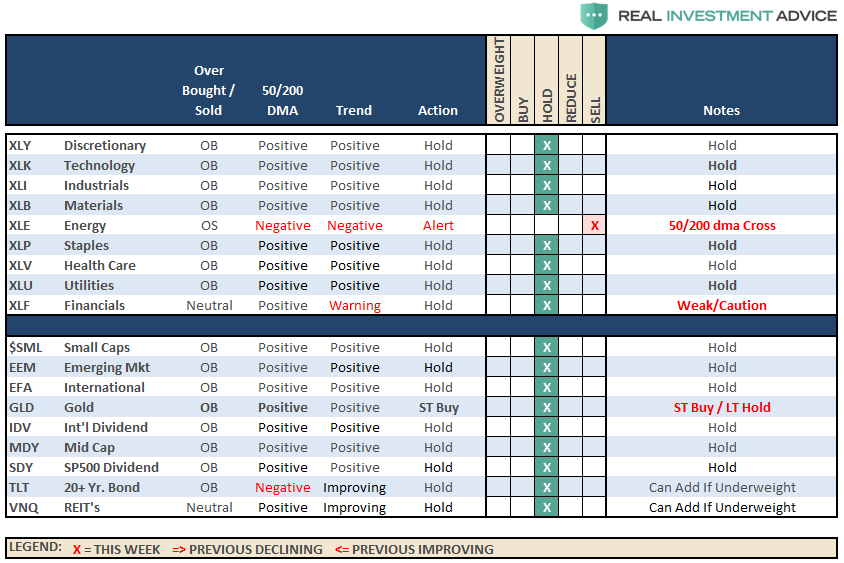
The table below shows thoughts on specific actions related to the current market environment.
(These are not recommendations or solicitations to take any action. This is for informational purposes only related to market extremes and contrarian positioning within portfolios. Use at your own risk and peril.)
Portfolio Update:
The bullish trend remains positive, which keeps us allocated on the long side of the market for now.
As noted in two week’s ago:
“With the breakout, we did increase our exposures a little bit, but I would like to see some continued strength into next week for confirmation before adding additional risk. This is particularly the case as we move into the seasonally weaker months of the year. We are maintaining stops at recent support levels on all sectors and at 2325 on the S&P 500.”
If this market can maintain its bullish underpinnings on Monday, we will review portfolios for potential additions of “risk” exposure where needed. However, be mindful, that we do so with the very strict “sell” discipline in place in the event that something goes wrong.


