Written by Lance Roberts, Clarity Financial
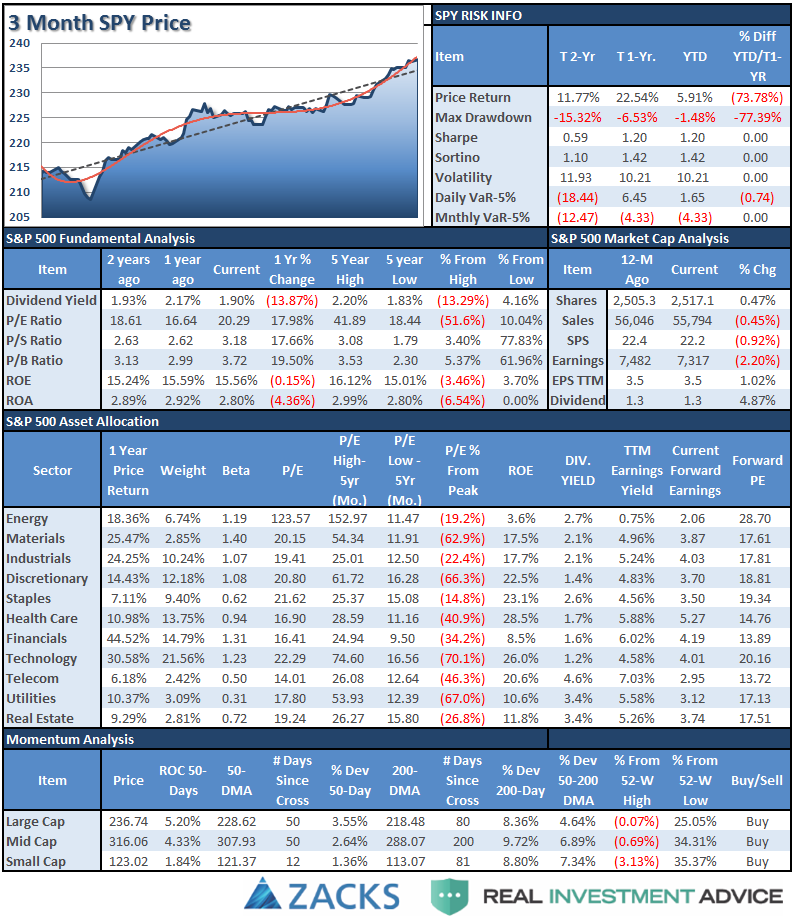
S&P 500 Tear Sheet
The “Tear Sheet” below is a “reference sheet” provide some historical context to markets, sectors, etc. and looking for deviations from historical extremes.

If you have any suggestions or additions you would like to see, send me an email.
Review & Sector Analysis
Positioning Review & Update
Let’s start with a quick update from last week.
“While the ‘bullish backdrop’ clearly remains, there is ample evidence to reduce overweight equity positions and refrain from making new purchases currently.
As shown in the chart below, the deviation in the price of the S&P 500 from its underlying 50 & 200 day moving averages, bottom two indicators, are currently at extreme levels. At these levels, a pull back or correction has been a common occurrence.”
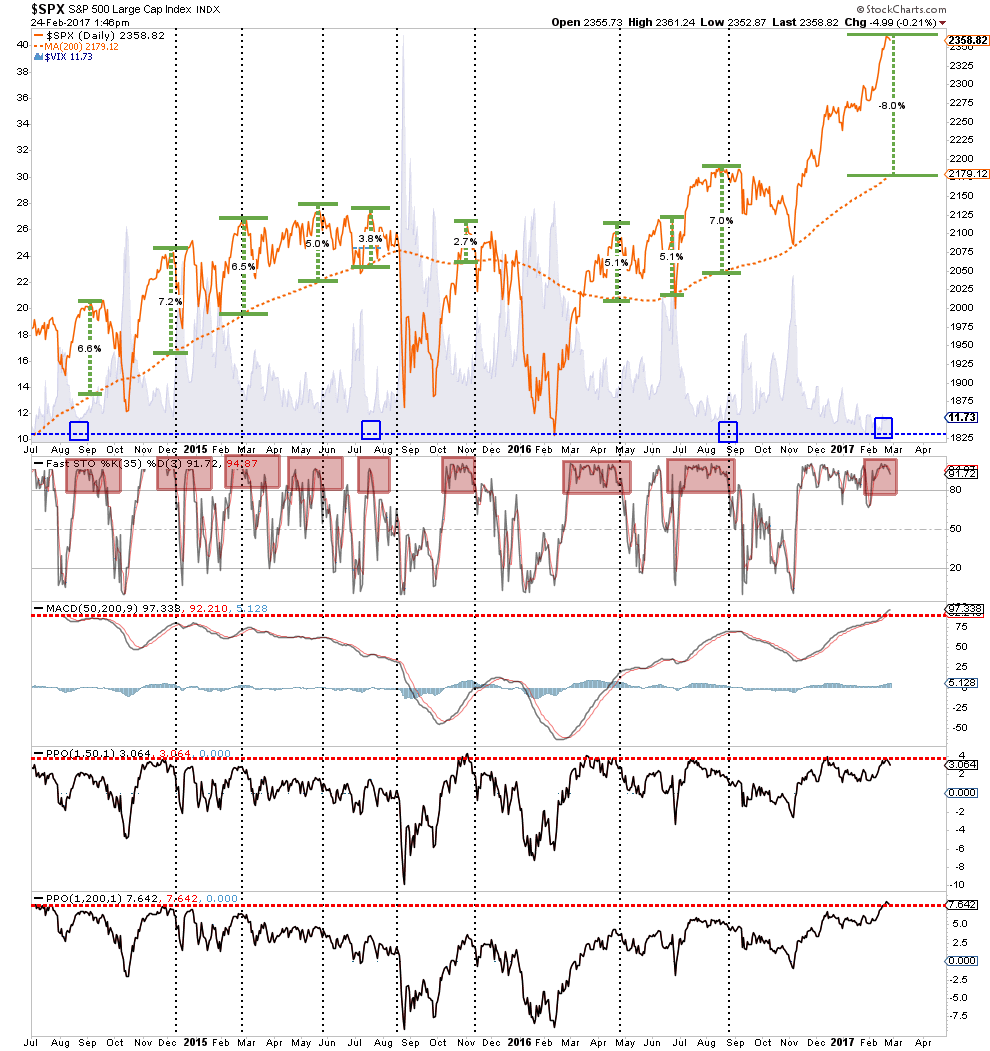
“A correction can happen in one of two forms:
The price of the index begins to trade in a sideways pattern for a couple of weeks which allows the underlying moving average to catch up with the price, OR;
The price corrects to, or beyond, the underlying average.
While a sideways correction is entirely possible, it generally rarely happens. Most likely, a correction would entail a price reversion towards 2175 to 2200. Given the market finds support at these levels, investors should be afforded a better entry point to add exposure. However, a violation of those levels would suggest a deeper correction is in the making.”
IMPORTANTLY, I also stated that I was temporarily holding off adding new equity positions to portfolios currently until the risk/reward opportunity becomes a bit more favorable.With portfolios nearly fully allocated at this juncture, my bigger concern is focused on the numerator of the risk/reward equation.
That remains the case this week as the hedges that were added to portfolios in December continue to operate by adding support to portfolios as the “Trump Trade” fades as hopes of infrastructure spending, tax reform and repatriation get pushed off into the future.
As I noted (with a video) at the beginning of the year, these rotations usually are early indicators of a “risk off” transition and provide opportunities for investors.
Here is the rotation chart from January 5th.
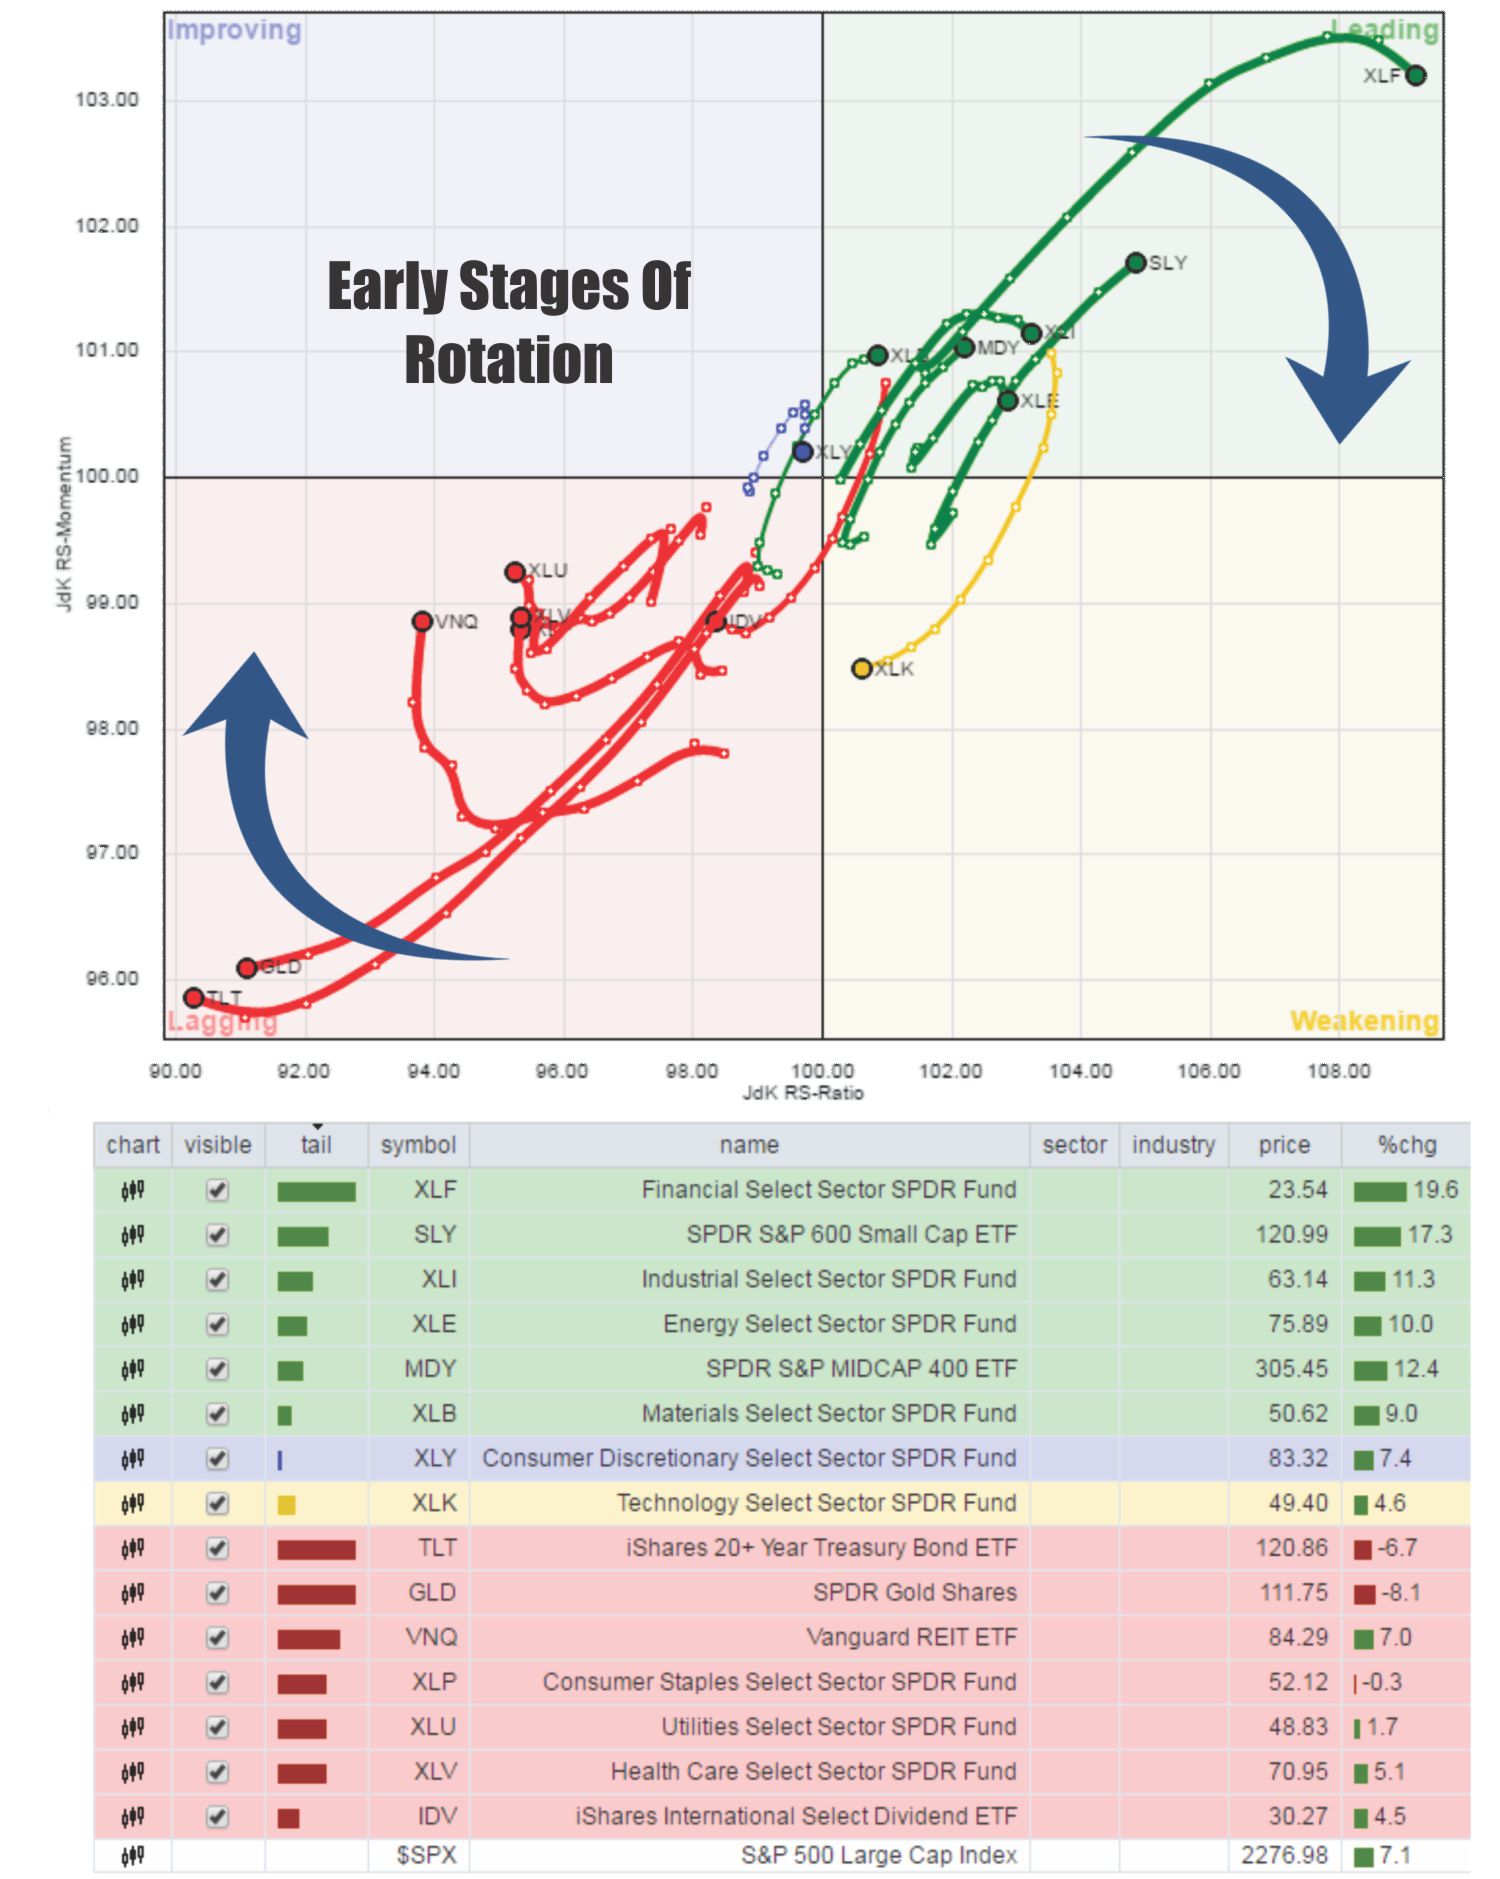
As you can see, that rotation has continued to accelerate since then as expected.
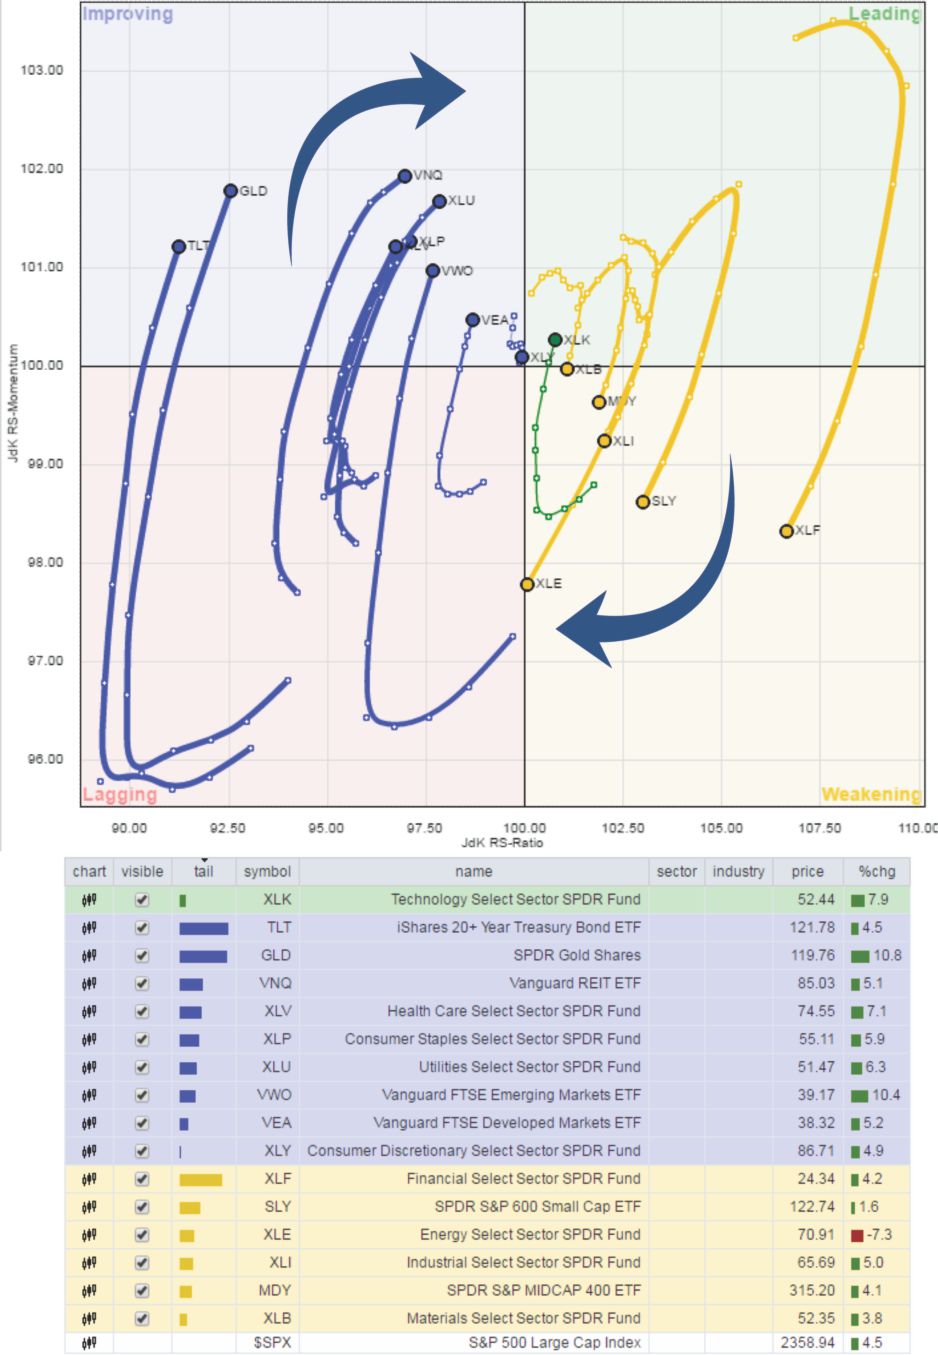
Of course, if you are simply watching the broad market indices, these internal rotations of the market have been masked.
So while the media has hyped the markets making new highs every day of the week, this has not been the case for the stocks that make up the index itself as noted by the number of stocks currently trading above their respective 50 and 200-day moving averages.
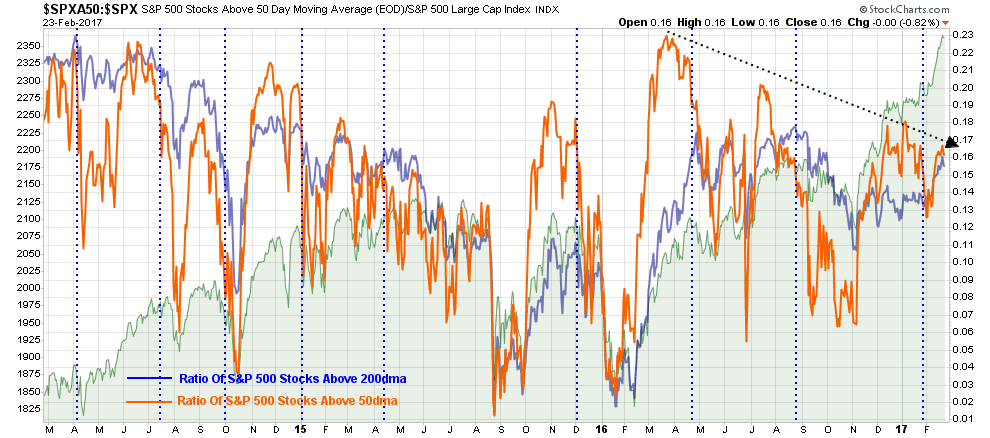
But this is today’s discussion in a nutshell, with markets making daily new highs there is absolutely nothing to worry about, right? After all, who can argue with the advice pushed out by CNBC?

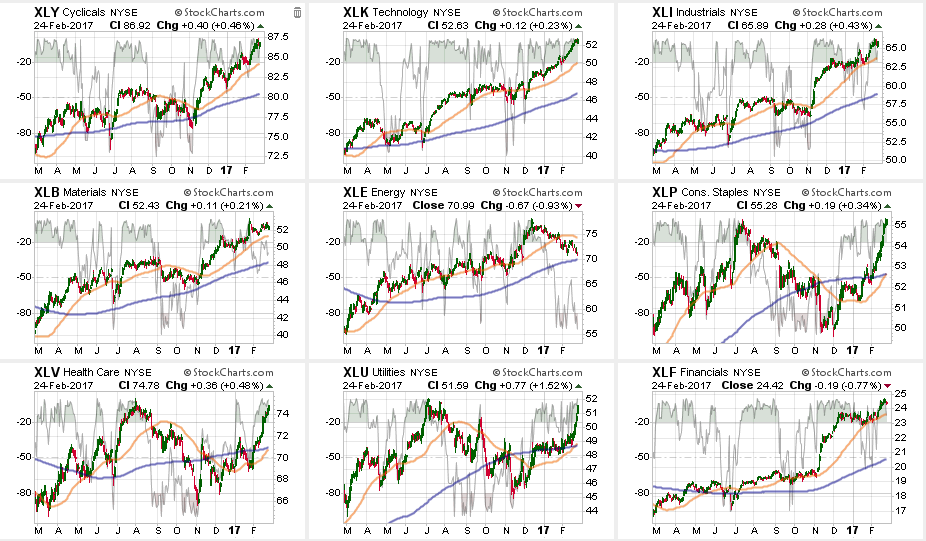
Technology, Discretionary, Industrials, Staples, Utilities, Health Care and Financials continue to push highs. Energy continued to struggle after breaking its 50-dma. Basic Materials continues to lag but is holding its ground.
Notably, watch Staples, Utilities, and Healthcare as the 50-dma is crossing 200-dma.
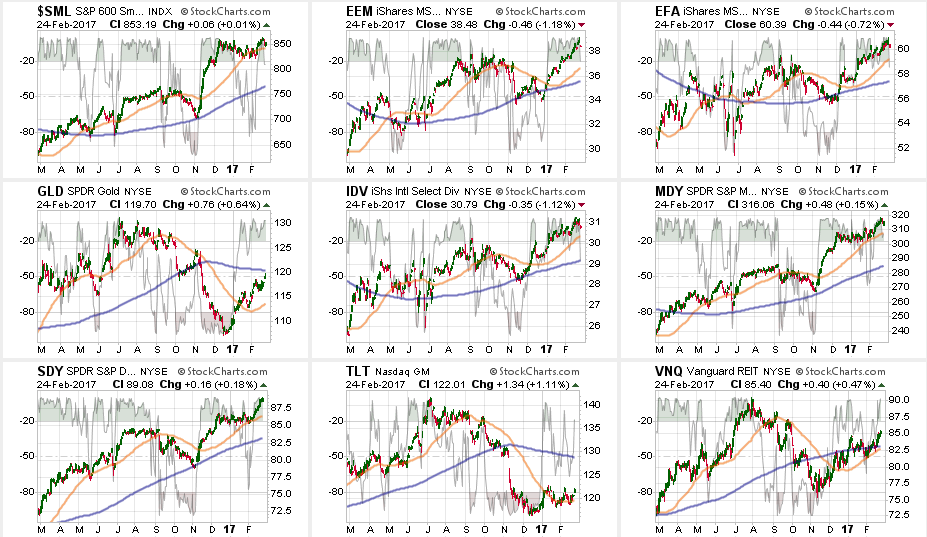
From the broader index positioning:
Like Utilities above, REIT’s are also pushing a 50-200 dma crossover. This all corresponds to the “safety trade” that is currently underway. Small Caps, Mid Caps, and Dividend Stocks bounced off their respective 50-dmas BUT are all extremely extended above their longer-term moving averages suggesting a higher degree of risk.
Emerging and International markets got a lift from the weakening dollar which prompted an increase in International weightings in portfolios three weeks ago from a trading perspective. These areas are also extremely overbought currently as well. Caution is advised.
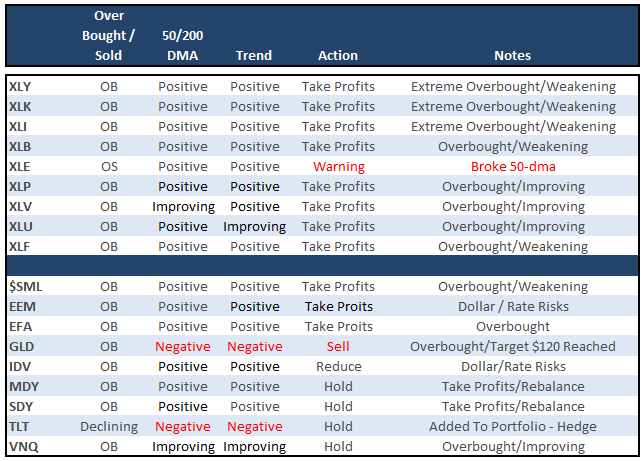
The table below shows thoughts on specific actions related to the current market environment.
(These are not recommendations or solicitations to take any action. This is for informational purposes only related to market extremes and contrarian positioning within portfolios. Use at your own risk and peril.)
Portfolio Update:
Eleven weeks ago, as suggested, we hedged our long-equity positions with deeply out-of-favor sectors of the market (Bonds, REIT’s, Staples, Utilities, Health Care and Staples) which have continued to perform well in reducing overall portfolio volatility risk.
This next week we will take some profits in these areas be rebalancing them to original target levels.
The market is now egregiously overbought but “exuberance” continues to push asset prices higher. Importantly, all positions maintain very tight trailing stops as the mid to longer-term dynamics of the market continue to remain very unfavorable.
No new additions to equity are currently recommended as risk/reward remains unfavorably balanced going into next week. Rebalancing remains strongly advised.


