Written by Lance Roberts, Clarity Financial
Let’s start with a quick update from last week.
“Since the beginning of January, the markets have remained in a very low volatility sideways trading pattern as shown in the chart below. However, this past week all three indices broke out to the upside with the Dow moving above 20,000 and the S&P 500 surging above the 2,300 mark.”


“There are plenty of bullish supports currently that warrant keeping portfolios exposed to equity risk currently:
The bullish trend remains intact as noted by the red dashed line in the first chart above.
The NYSE Advance/Decline remains bullish biased
The number of stocks on bullish buy signals remains bullish
The number of stocks above their 50 and 200 DMA’s is rising.
Bullish confidence is high
Volatility remains low”
This past week, as President Trump reiterated that a “terrific tax cut” package was forthcoming, stocks rocketed higher earlier in the week and attempts to sell off on Thursday and Friday were quite muted.
While the “bullish backdrop” clearly remains, there is ample evidence to reduce overweight equity positions and refrain from making new purchases currently.
As shown in the chart below, the deviation in the price of the S&P 500 from its underlying 50 & 200 day moving averages, bottom two indicators, are currently at extreme levels. At these levels, a pull back or correction has been a common occurrence.
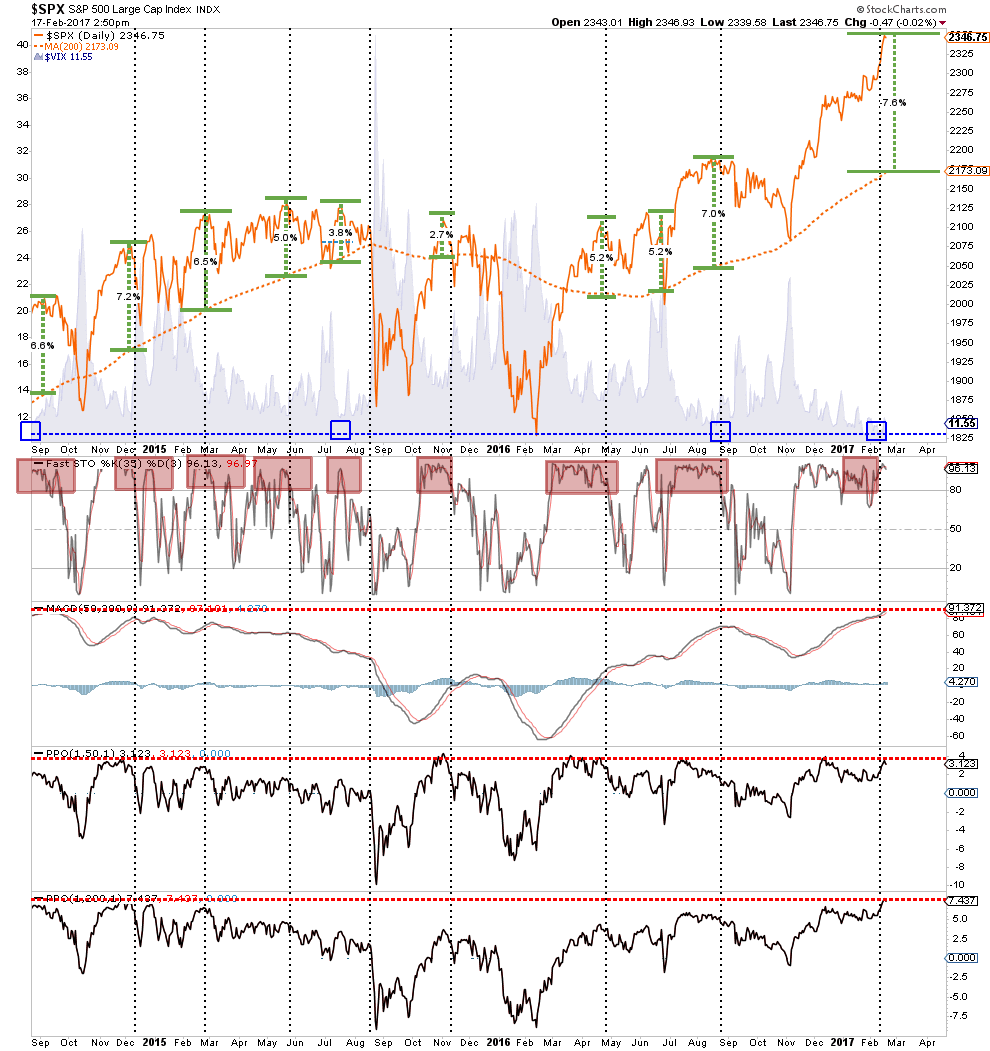
A correction can happen in one of two forms:
The price of the index begins to trade in a sideways pattern for a couple of weeks which allows the underlying moving average to catch up with the price, OR;
The price corrects to, or beyond, the underlying average.
While a sideways correction is entirely possible, it generally rarely happens. Most likely, a correction would entail a price reversion towards 2175 to 2200. Given the market finds support at these levels, investors should be afforded a better entry point to add exposure. However, a violation of those levels would suggest a deeper correction is in the making.
I am temporarily holding off adding new equity positions to portfolios currently until the risk/reward opportunity becomes a bit more favorable. However, with portfolios nearly fully allocated at this juncture my bigger concern is focused on the numerator of the risk/reward equation.
Signs Of Excess
It isn’t just price extensions of the market that is currently concerning but the underlying excesses as well.
On Tuesday, I reviewed the COT (Commitment Of Traders) data which is exceptionally important data as it is the sole source of the actual holdings of the three key commodity-trading groups, namely:
Commercial Traders: this group consists of traders that use futures contracts for hedging purposes and whose positions exceed the reporting levels of the CFTC. These traders are usually involved with the production and/or processing of the underlying commodity.
Non-Commercial Traders: this group consists of traders that don’t use futures contracts for hedging and whose positions exceed the CFTC reporting levels They are typically large traders such as clearinghouses, futures commission merchants, foreign brokers, etc.
Small Traders: the positions of these traders do not exceed the CFTC reporting levels, and as the name implies, these are usually small traders.
The data we are interested in is the second group of Non-Commercial Traders. This is the group that speculates on where they believe the market is headed. While you would expect these individuals to be “smarter” than retail investors, we find they are just as subject to human fallacy and “herd mentality” as everyone else.
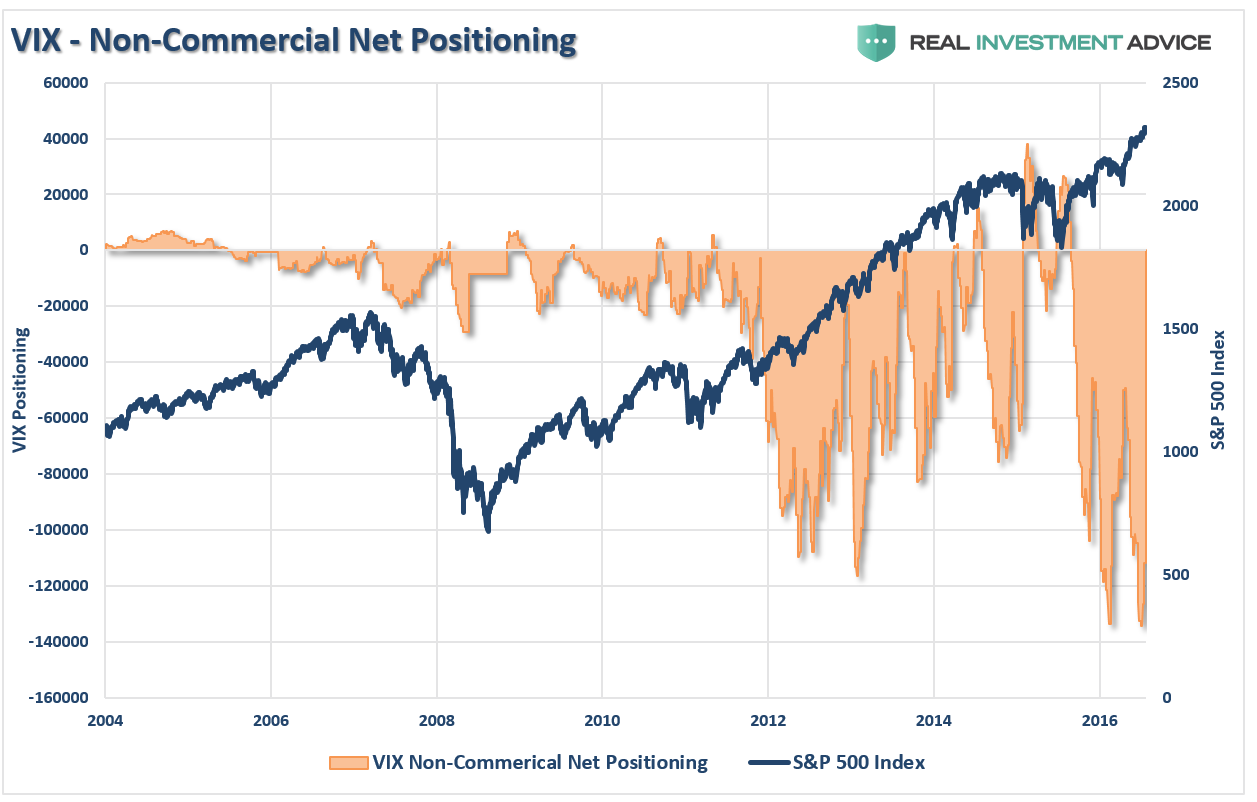
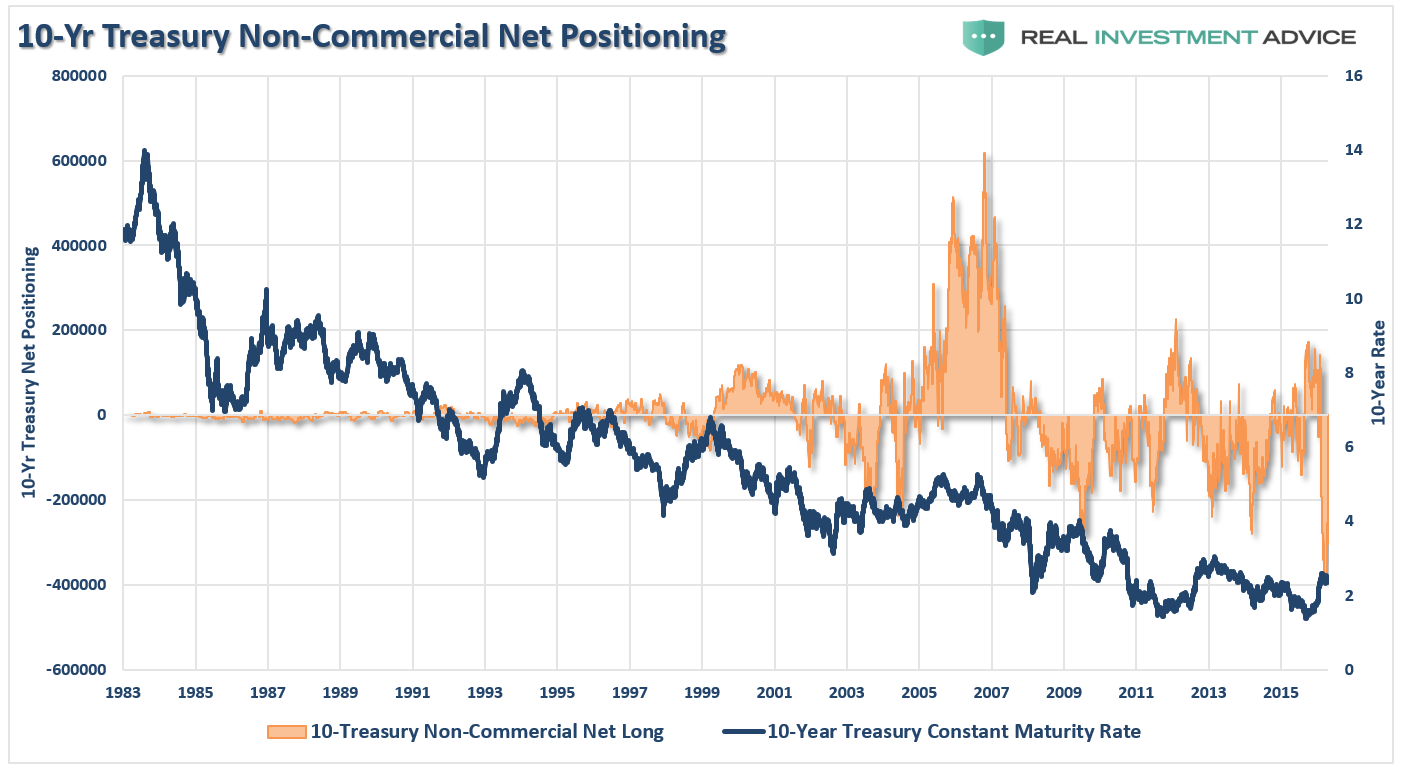
Therefore, as shown in the series of charts below, we can take a look at their current net positioning (long contracts minus short contracts) to gauge excessive bullishness or bearishness. With the exception of the 10-Year Treasury which I have compared to interest rates, the others have been compared to the S&P 500.
The extreme net-short positioning on the volatility index suggests there will be a rapid unwinding of positions given the right catalyst. As you will note, reversals of net-short VIX positioning has previously resulted in short to intermediate term declines.
Crude oil positioning is also highly correlated to overall movements of the S&P 500 index. With crude traders currently more “long” than at any other point in history, a reversal will likely coincide with both a reversal in the S&P 500 and oil prices being pushed back towards $40/bbl.

While oil prices could certainly fall below $40/bbl for a variety of reasons, the recent bottoming of oil prices will likely favor some support around that level. Given the extreme long positioning on oil, a reversion of that trade will likely coincide with a “risk off” move in the broader markets as well. If you are overweighted energy currently, the data suggests a rebalancing of the risk is likely advisable.

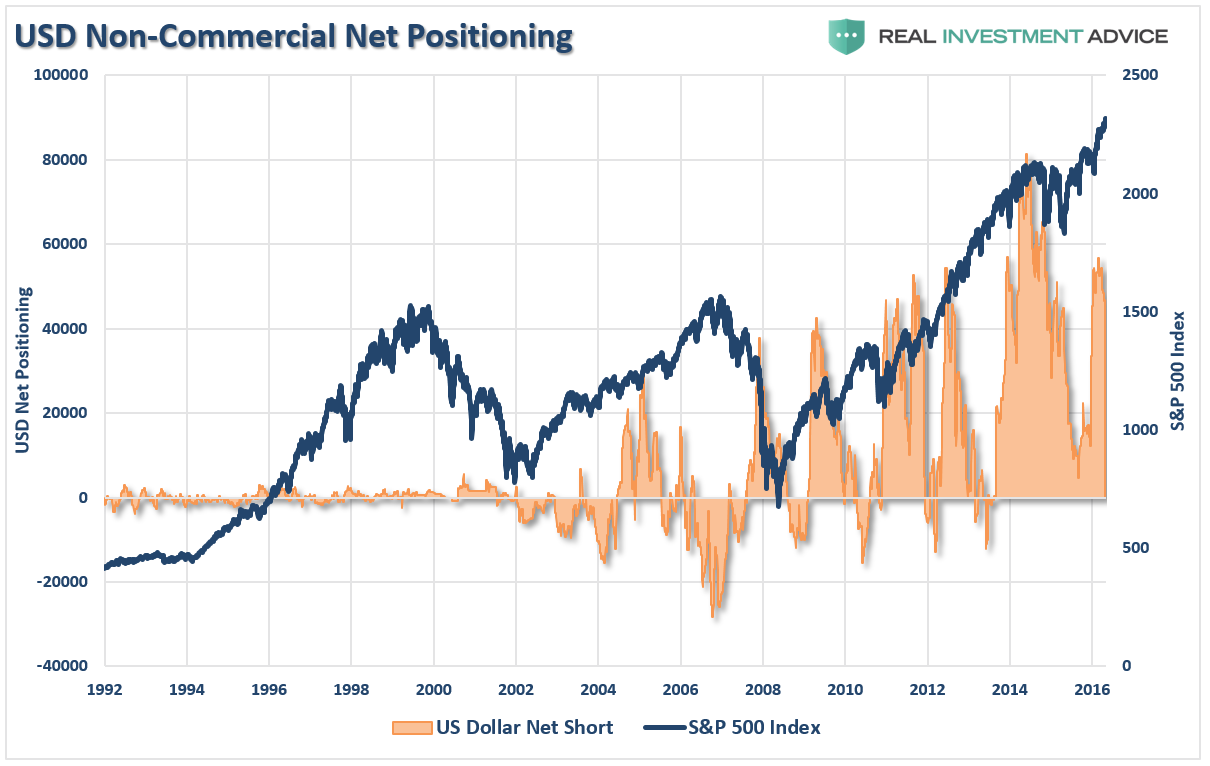
The same goes for the US Dollar. While net positioning is not at historic extremes, it is at levels which would coincide with a short to intermediate-term correction in the S&P 500.
Of course, as I have previously discussed, there are also signs of excess in:
Currently, there is an implicit disregard for fundamentals. Of course, such disregard has historically been a hallmark of poor future returns for investors.
Seen This Before
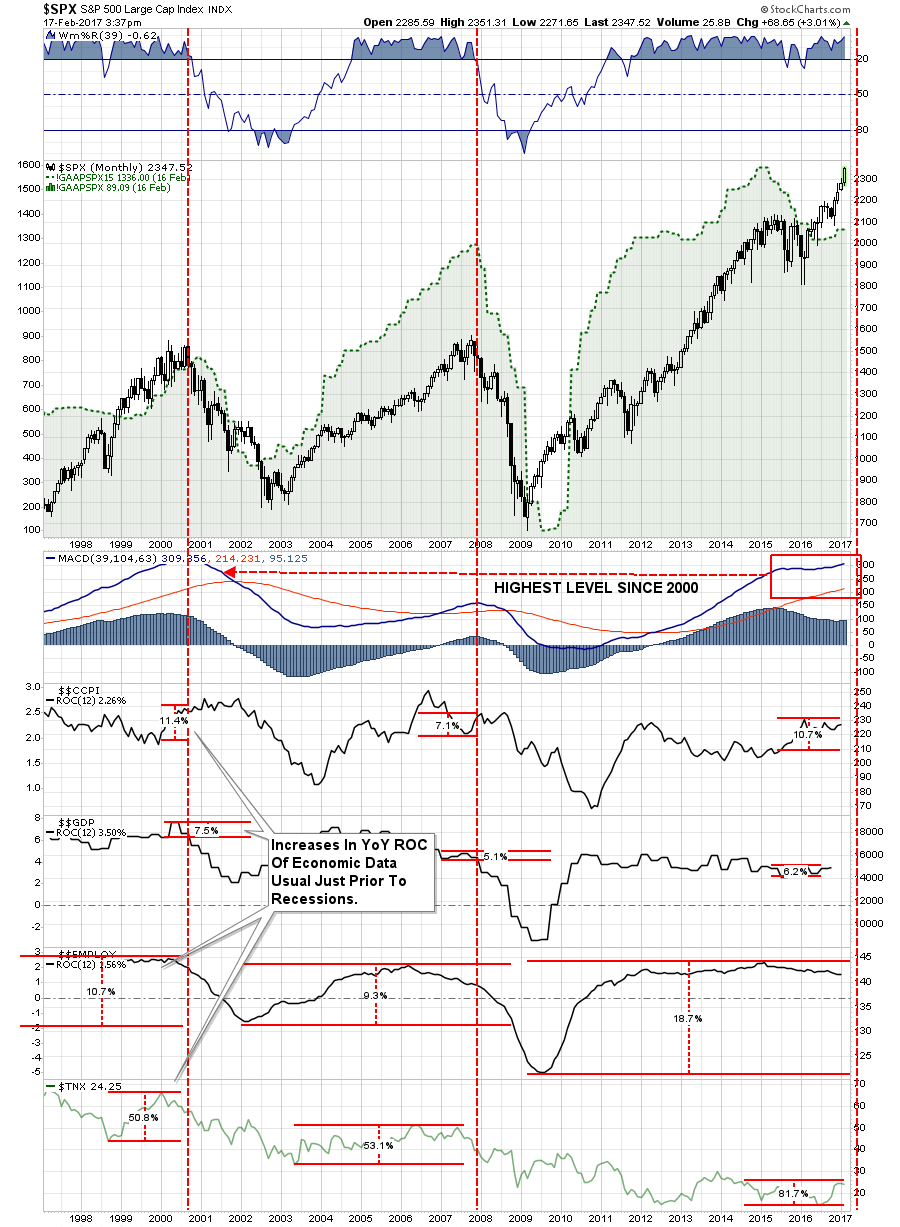
In both previous bull market peaks we find, as measured as a percentage change from the previous bottom to the current level, the following:
CORE INFLATION rose 11.7% and 7.1% just prior to the recession. Currently, Core CPI is up 11.1%
GDP GROWTH picked up by 7.5% and 5.1% just prior to the recession. Currently, GDP is up 6.8%
EMPLOYMENT was up from lows by 9.1% and 8.6%. Currently, Employment is up 19.0%
INTEREST RATES rose 50.8% and 51% from lows. Currently, Rates are up 87.9%
As we saw just prior to the beginning of the previous two recessions, such a bump is not uncommon as the impact of rising inflation and interest rates trip of the economy. Given the extreme speculative positioning in oil longs, short bonds, and short VIX, as discussed yesterday, it won’t take much to send market participants scrambling for the exits.
While I am NOT suggesting that we are about to have the next great market crash tomorrow, the current sensation of “Deja Vu” might just be worth paying attention to.
The most interesting setup currently for investors, is the massive net-short position on US Treasury Bonds. Given the aggressive leveraging in the markets above, a reversal in the S&P 500 will likely send money rushing into bonds for “safety.” That rush will fuel a short-covering spree in bonds forcing yields towards 1.5% or lower.
This is an area that I am looking at adding more of into portfolios to hedge the long-equity bias currently.


