Written by Rick Ackerman, Rick’s Picks
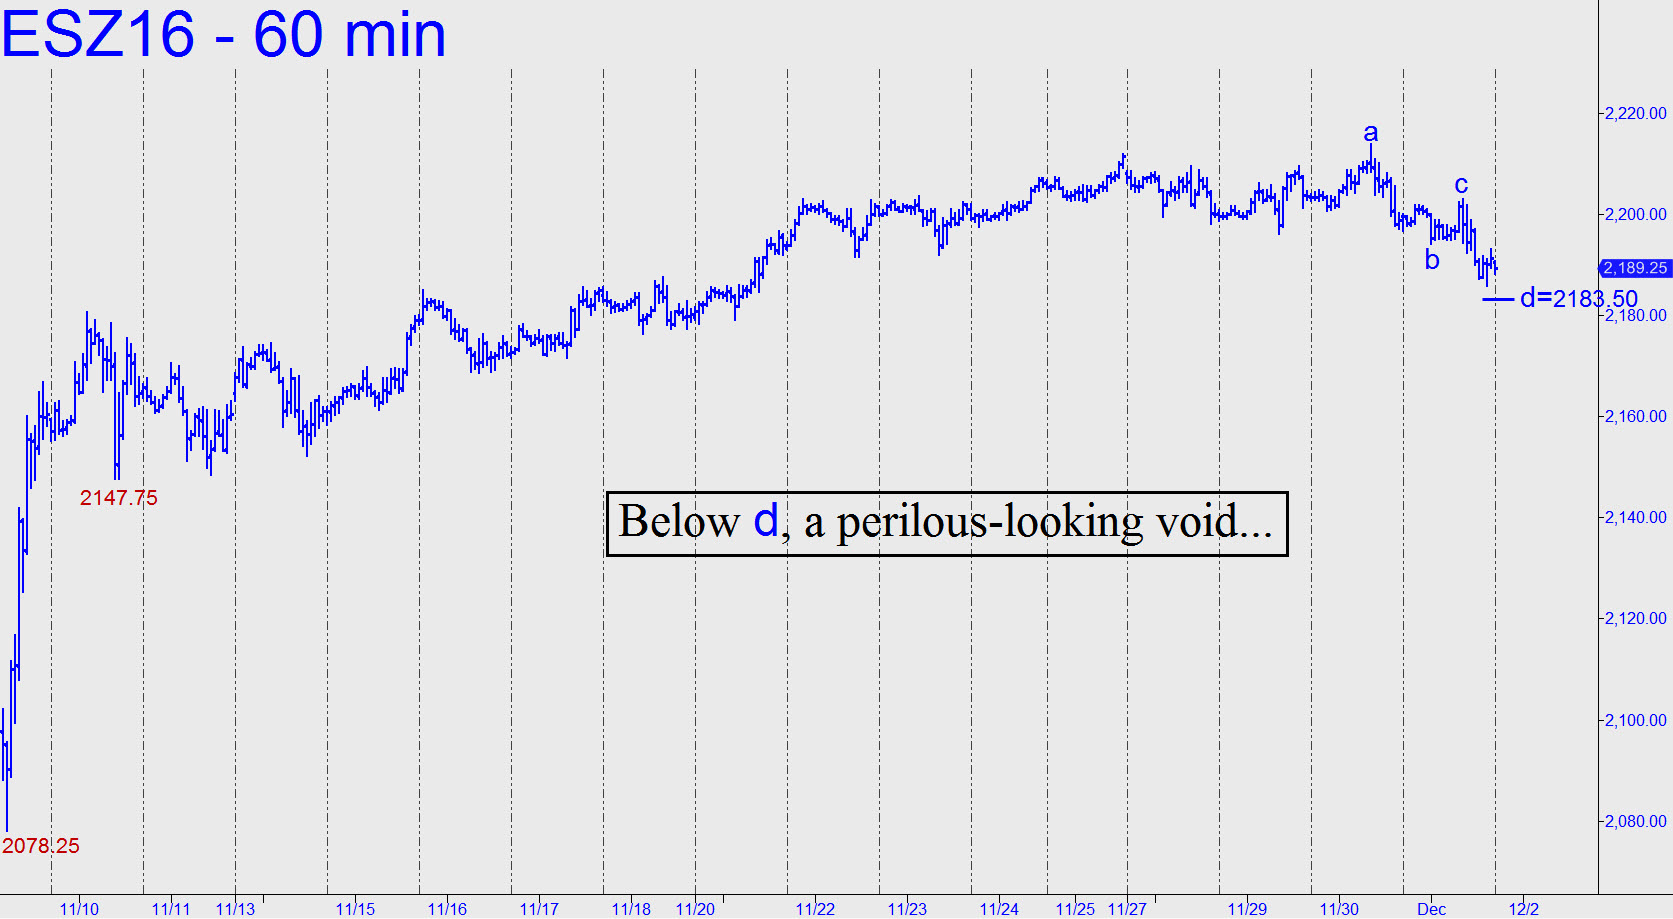
A moderate, two-day decline has disconcerted the bullish picture somewhat, as a glance at the hourly chart makes clear (see below). The extremely tedious, albeit relentless uptrend that has persisted for three weeks has begun to roll down from record highs.
Virtually all bull markets end this way: with an innocuous-looking a-b-c-d downtrend that is discernible only on the lesser charts.

The selling could easily start to snowball, since there are only two prior lows of significance to break the fall of the E-Minis. Most immediately, there is 2147.75, the bottom of a shallow, post-election retracement whence the ratcheting, November dirge began. And then there is the 2078.25 election-night low itself, a 110-point fall from these levels that would be equivalent to a 1000-point drop in the Dow.
There is nothing in particular to suggest that such a plunge is imminent, but we’ll want to keep a close eye on this vehicle nonetheless if it exceeds the 2183.50 target of the so-far minor downtrend shown. Perceptions can change quickly when it is institutional lunatics and their vaunted algorithms doing the trading. Under the circumstances, the huge expanse of white space beneath the frail Hidden Pivot support at 2183.50 could start to look perilous in a relative blink of an eye.
Author’s note:
If you are not a subscriber subscribe, you can access the chat room and all of my trading ‘touts’ instantly by clicking here for a no-risk, two-week trial subscription.


