
Written by Lance Roberts, Clarity Financial
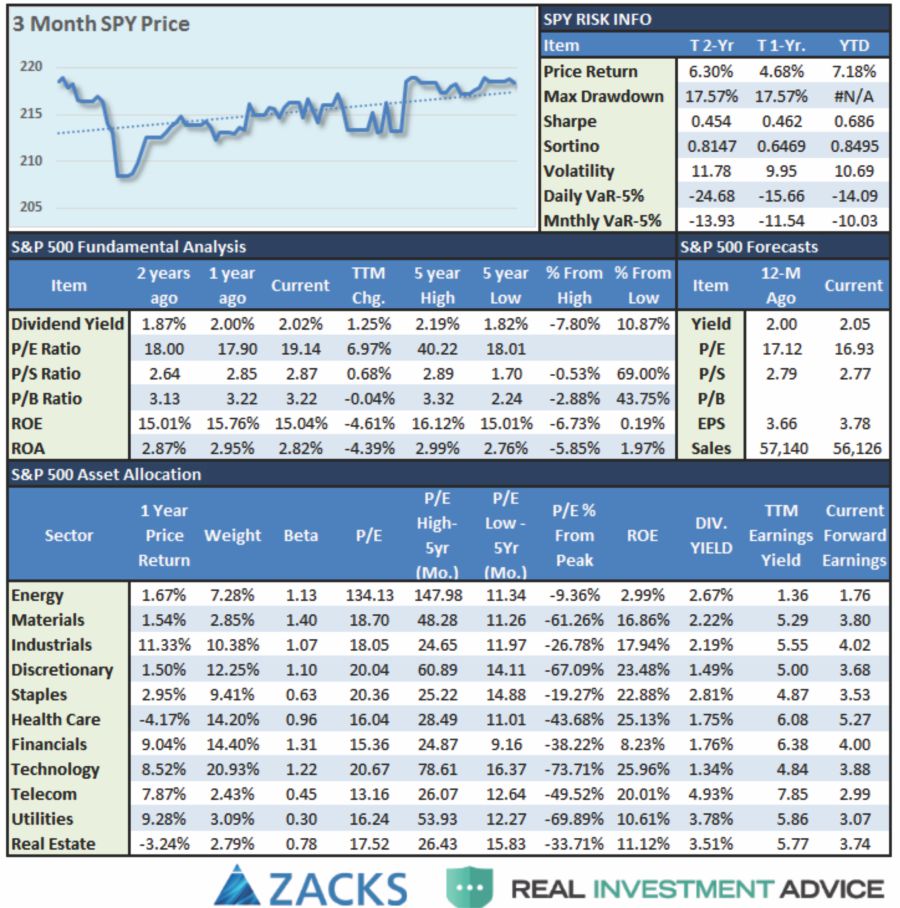
Starting this weekend, I will be adding an S&P 500 Tear Sheet which I have been working on with my friends at Zack’s Research. If you have any suggestions or additions you would like to see, send me an email.

Model Update
S.A.R.M. Sector Analysis & Weighting
While the markets seemed to rally broadly last week, such was really not the case when we look at individual areas.
While Discretionary, Industrials, Materials, and Financials rallied sharply post the election on a bet of a “reflation” trade, only Industrials and Financials substantially broke out to new highs. The problem, as stated above, is that a stronger dollar and higher interest rates will likely hamper this optimism sooner rather than later.
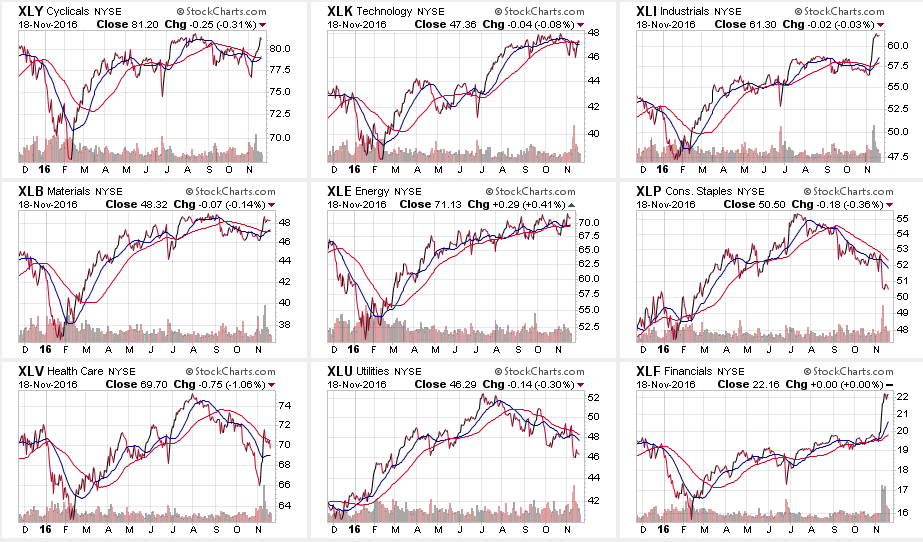
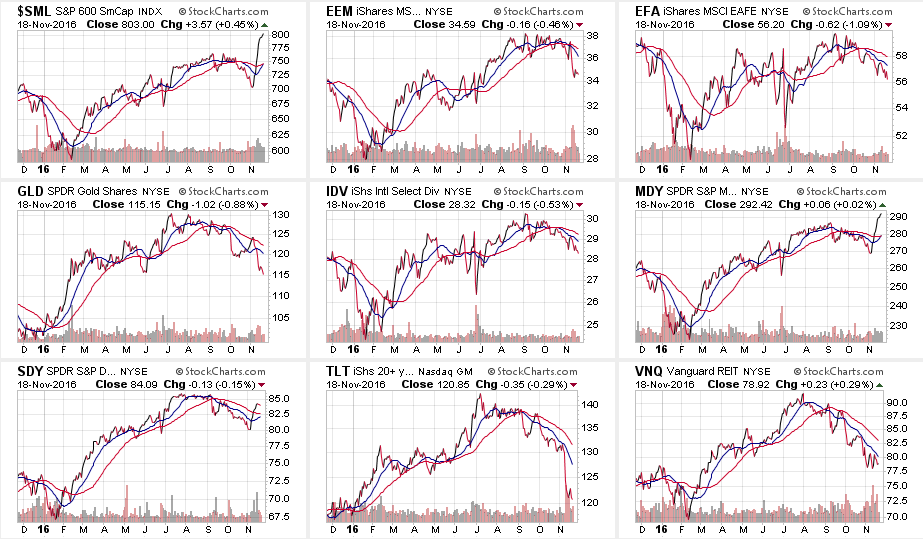
In the broader markets, Small and Mid-Caps surged on this same bet. Unfortunately, as stated above, these two areas are also the MOST susceptible to the negative impacts of exports and carrying costs. Profits should be taken now.
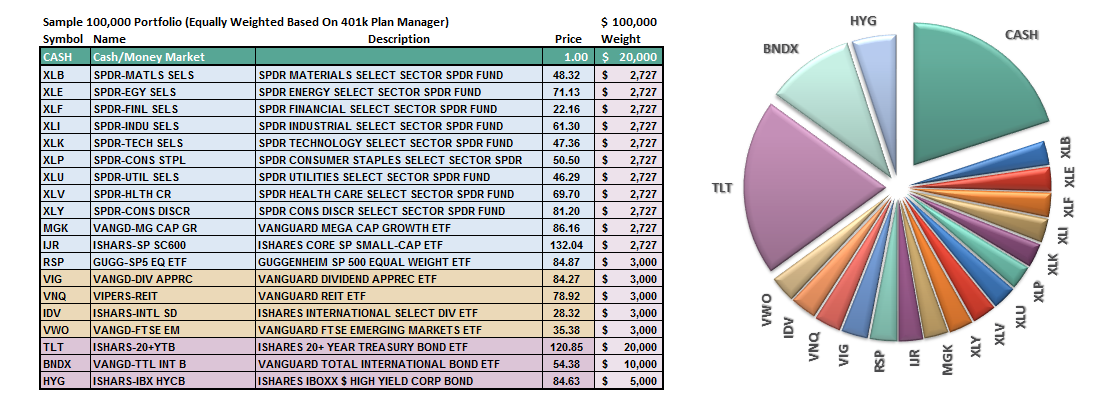
Let’s take a look at the equal weighted portfolio model.
(Note: This is an equally weighted model example and may differ from discussions of overweighting/underweighting specific sectors or holdings.)
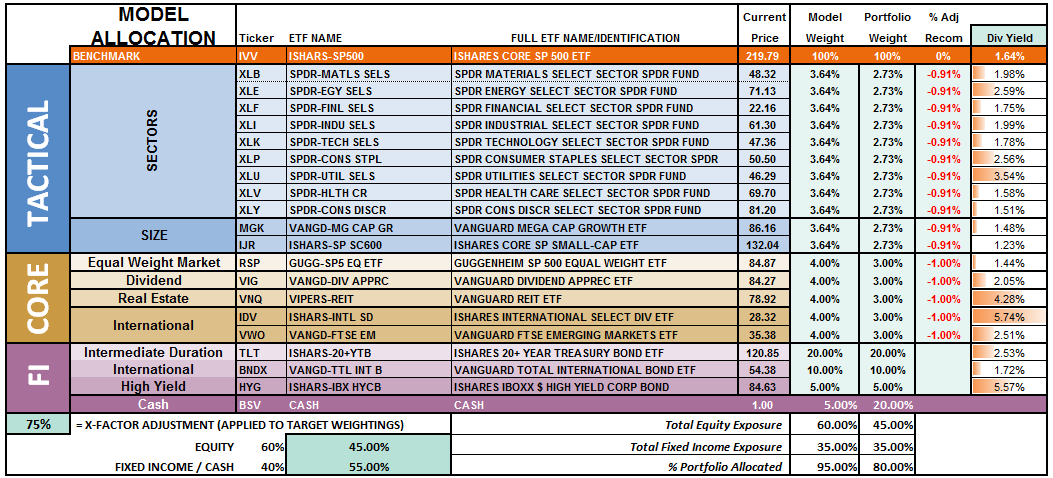
The overall model still remains underweight target allocations. This has been due to the inability of the markets to generate a reasonable risk/reward setup to take on more aggressive equity exposure at this time.
However, the rally last week which pushed the markets back above the 50-dma keeps portfolios allocated at model weights. Provided the markets can reduce the current overbought condition, without triggering further “sell signals,”model allocations will be able to be increased for the seasonally strong period.
Relative performance of each sector of the model as compared to the S&P 500 is shown below. The table compares each position in the model relative to the benchmark over a 1, 4, 12, 24 and 52-week basis.
Historically speaking, sectors that are leading the markets higher continue to do so in the short-term and vice-versa. The relative improvement or weakness of each sector relative to index over time can show where money is flowing into and out of. Normally, these performance changes signal a change that lasts several weeks.
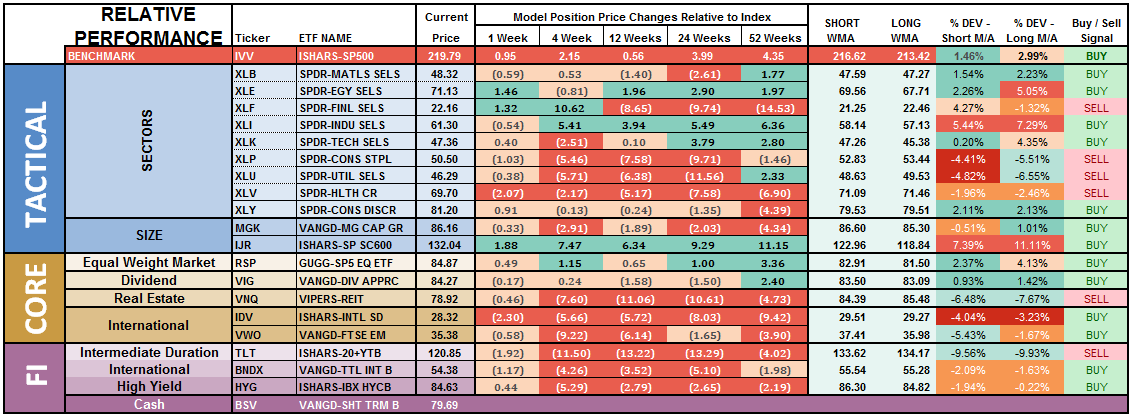
The broad spectrum of underperformance in recent months now beginning to improve somewhat, and the best opportunities are likely to come from a reversal trade as assets flow from “risk” back to “safety.” This will likely occur during the first two weeks of December.
Notice in the next to the last column to the right, the majority of sectors which have previously been pushing extreme levels of deviation from their long-term moving average, have corrected much of those extremes. Furthermore, previously all areas were on long-term buy signals but continued weakness in the markets, combined with a loss of momentum, have eroded much of the previous strength.
There is a broad deterioration across sector performance which suggests overall weakness in the markets will likely continue in the near-term. Some caution is currently advised as the market has now been split distinctively between the “risk on”and “safety” trade as shown below in the “spaghetti” chart, via StockCharts.
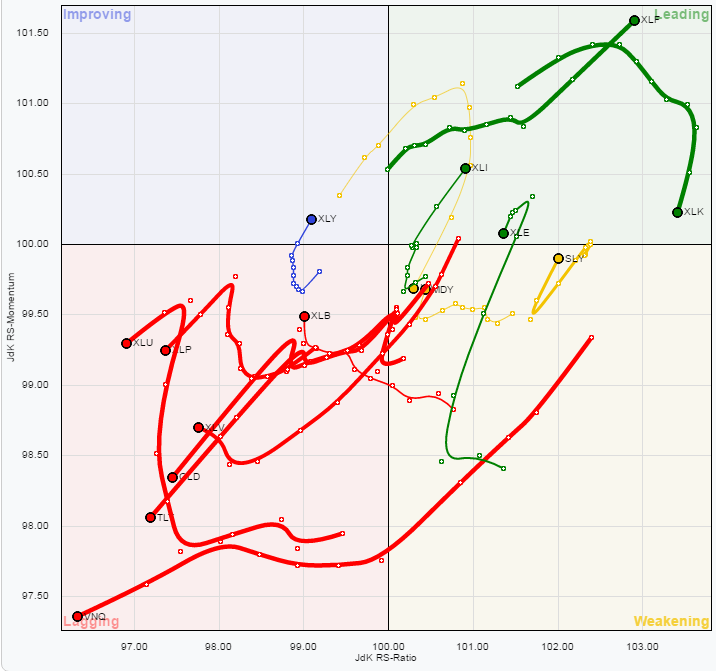
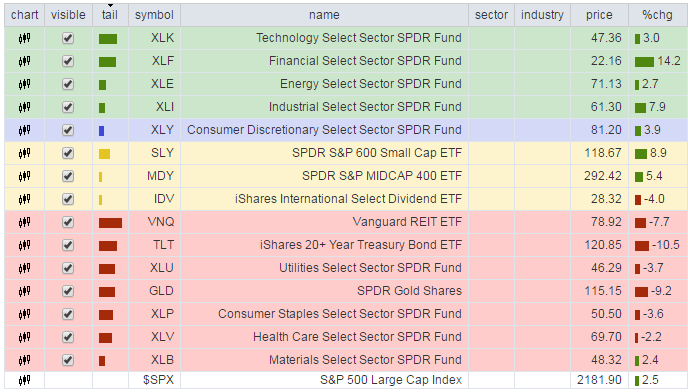
Utilities, REIT’s, Staples, Materials, Bonds, Gold, and Healthcare have remained under pressure this past week.
Importantly, notice the cluster of assets that are grossly underperforming the S&P 500 currently. THIS DOES NOT LAST LONG and tends to historically lead to rather swift reversions in the trade. Everything is currently pointing to this being the case so profit taking and rebalancing is strongly advised.
As I have stated over the last couple of weeks:
“With the rise in rates largely done, sectors with the most benefit from falling rates look reasonable.
The opposite holds true for those sectors that are adversely affected by a stronger dollar higher rates. With dollar headwind still intact, and the rate rise grossly extended, profit taking in Small-Cap, Mid-Cap, Emerging Markets, International and Energy stocks seems logical. “
While the rise in rates this past week due to the unexpected victory by Donald Trump in the Presidential election, it has only served to reinforce positioning in lagging areas of the market for a “reversion” trade over the next few weeks.
Also, as I stated last week:
“I have been recommending taking profits in the Technology sector. This was due to the extreme levels of outperformance of that sector which has begun to fade. The rotation out of technology is likely not complete yet and brings into focus extremely oversold sectors such as Health Care, Utilities and Staples as potential candidates.”
That advice remains this week as well.
The risk-adjusted equally weighted model has been increased to 75%. However, the markets need to break above the previous consolidation range to remove resistance to a further advance.
Such an increase will change model allocations to:
20% Cash
35% Bonds
45% in Equities.
As always, this is just a guide, not a recommendation. It is completely OKAY if your current allocation to cash is different based on your personal risk tolerance, time frames, and goals.
For longer-term investors, we still need to see improvement in the fundamental and economic backdrop to support the resumption of a long-term bullish trend. Currently, there is no evidence of that occurring.


