


Written by Lance Roberts, Clarity Financial
9-Days Down
My friend Anora Mahmudova had a good piece of analysis on Friday with respect to the 6 and 12-month returns following 9-consecutive down days.
“The S&P 500 on Friday logged its first nine-day losing streak in almost 36 years, but some analysts view declines of eight days or longer as buying opportunities that are usually followed by gains over the next six or 12 months.”

I have modified Anora’s original table to denote the secular period where these instances were occurring.
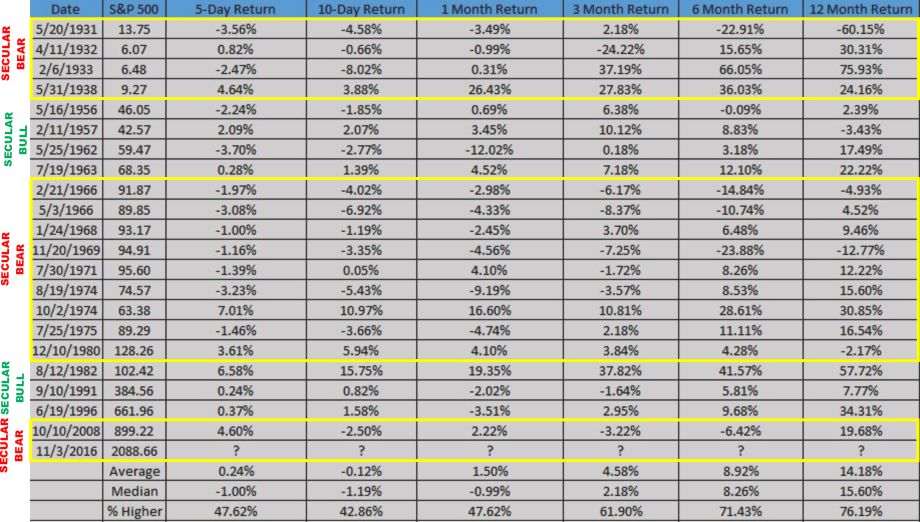
Now, before you go getting all bullish, there are a couple of things that you should note.
First, analysis like this is exceptionally flawed because it obfuscates what happens during the longer-term investment cycle. (Remember, the media says you supposed to be a long-term investor and can’t effectively manage your own portfolio, which is why you should just “index and forgetta’bout it.)
Secondly, I have overlaid these periods (orange dots) over the long term inflation adjusted returns of the market combined with CAPE-10 valuation measures courtesy of Dr. Robert Shiller.
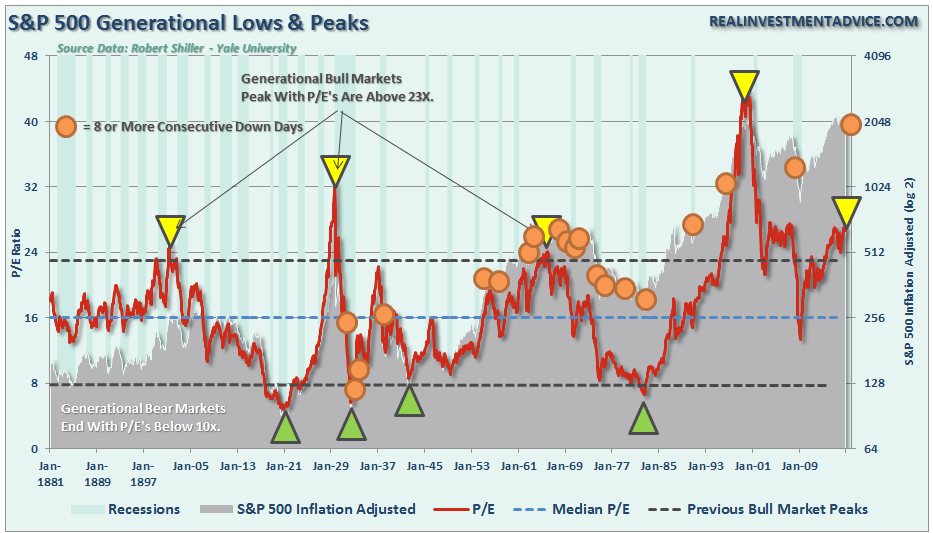
What we find is that long strings of consecutive down days tend to be clustered during long-term secular bear markets and near either short-term or more important major market peaks. Of course, this is not ALWAYS the case, but many times just beyond that 12-month window noted above, bad things tended to happen.
Here is the point, there are many indications the market is currently extremely oversold and likely to bounce next week. Possibly even fairly sharply. However, a bounce is very different than a long-term investable bottom in the market.
If you are a long-term investor that tends not to pay much attention to your portfolio, history suggests that maybe you should.
If you are a short-term trader, there is likely a very tradable opportunity over the next couple of weeks particularly in some of the more beaten down sectors as addressed above.
When investing, it is always context and duration which are critical to portfolio positioning, risk management, and optimal outcomes.
Model Update
S.A.R.M. Sector Analysis & Weighting
Taking a look at individual sectors of the market the deterioration of momentum and breadth continues to become much more evident. The first chart below are the major sectors of the S&P 500 index.
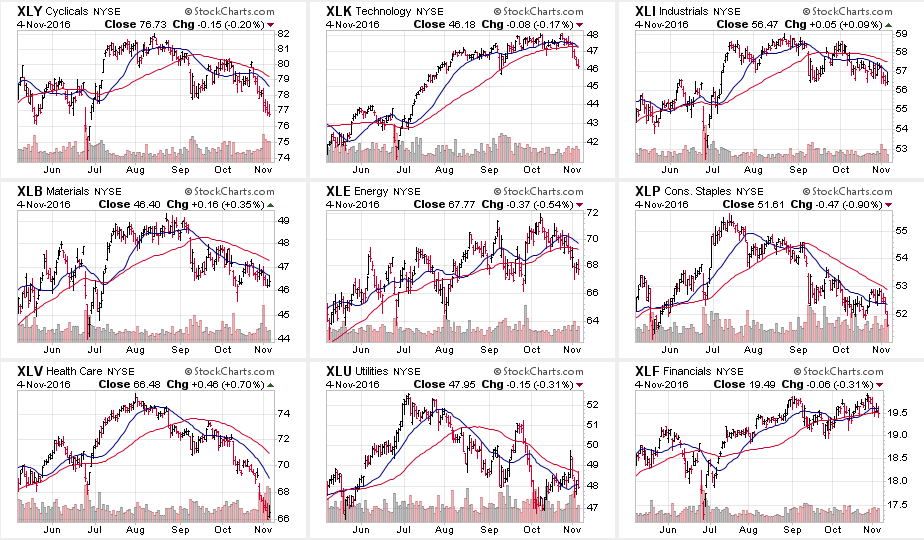
As you will notice 8-out-of-9 sectors, up from 6 last week, have registered short term sell signals with the short-term moving average crossing below the long-term moving average. Furthermore, the majority of the leadership for the current market has come from the technology sector where the momentum of the advance has slowed sharply. However, Utilities picked up some leadership this past week as interest rates declined during the rotation from “risk” to “safety” occurred as expected.
Moving on to other major sectors we find some similar patterns emerging.
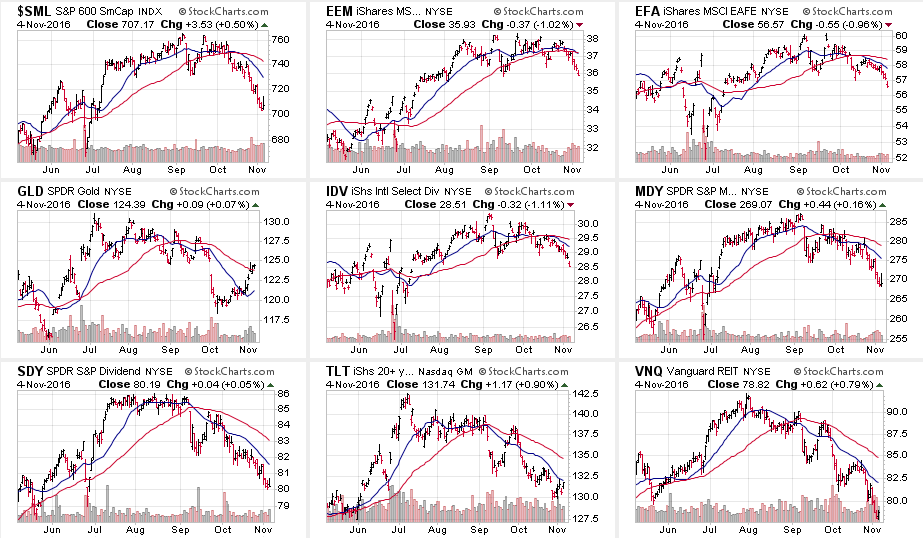
The deterioration is picking up markedly with 9-out-of-9 major indices registering sell signals and seeing deterioration among the previous leadership.
Small Cap, Mid-Cap, Dividend Stocks, and REITs were all hit the hardest as of late. However, as I previously warned, the strengthening of the Dollar is now weighing on the performance of international and emerging market sectors. Caution is advised as the run in Emerging Markets is extremely long in the tooth and is directly impacted by weakness from industrialized economies.
Bonds and Gold strengthened last week as investors began searching for safety.
As I stated last week:
“With the dollar strengthening, interest rates remaining elevated and labor costs on the rise, the risk to corporate profitability is elevated. If earnings season comes in weaker than expected, the recent ability of the market to hold support at bullish levels may fail.”
We are seeing that happen as earnings season progresses. Caution remains a prudent investment stance currently.
I will update this analysis in Tuesday’s Technically Speaking post (click here for free e-delivery)
Let’s take a look at the equal weighted portfolio model.
(Note: This is an equally weighted model example and may differ from discussions of overweighting/underweighting specific sectors or holdings.)
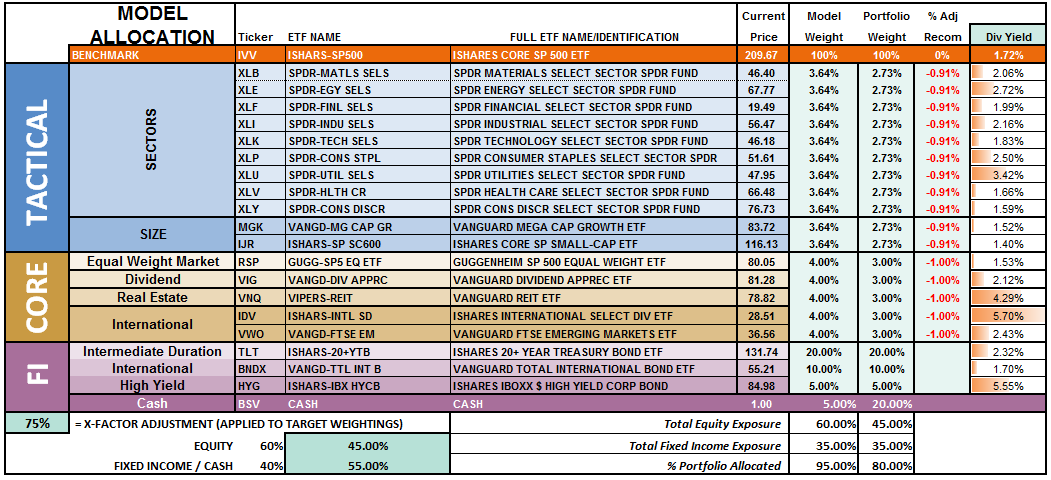
The overall model still remains underweight target allocations. This has been due to the inability of the markets to generate a reasonable risk/reward setup to take on more aggressive equity exposure at this time. However, on a failed rally attempt back to the 50-dma, the ongoing development of sell signals will require a model allocation reduction.
Relative performance of each sector of the model as compared to the S&P 500 is shown below. The table compares each position in the model relative to the benchmark over a 1, 4, 12, 24 and 52-week basis.
Historically speaking, sectors that are leading the markets higher continue to do so in the short-term and vice-versa. The relative improvement or weakness of each sector relative to index over time can show where money is flowing into and out of. Normally, these performance changes signal a change that last several weeks.
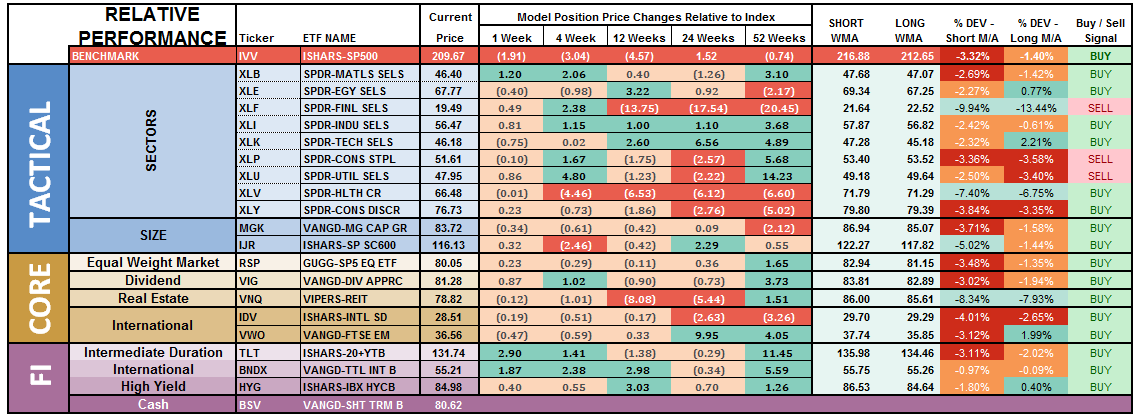
Notice in the next to the last column to the right, the majority of sectors which have previously been pushing extreme levels of deviation from their long-term moving average, have corrected much of those extremes. Furthermore, previously all areas were on long-term buy signals but continued weakness in the markets, combined with loss of momentum, have eroded much of the previous strength.
Financials, Staples and Utilities have now registered, as shown in the last column, a “weekly sell signal.” Importantly, by the time a “sell signal” is registered, the related sector is typically very oversold and will bounce. This tends to be a good opportunity to reduce exposure to that related sector before a continued decline. If the current market weakness continues, expect to see more “sell signals” occurring.
There is a broad deterioration across sector performance which suggests overall weakness in the markets will likely continue in the near-term. Some caution is currently advised.
The chart below is the “spaghetti” chart, via StockCharts, showing the relative strength/performance rotation of sectors relative to the S&P 500. If we are trying to “beat the index” over time, we want to overweight sectors/asset classes that are either improving in performance or outperforming the index, and underweight or exclude everything else.
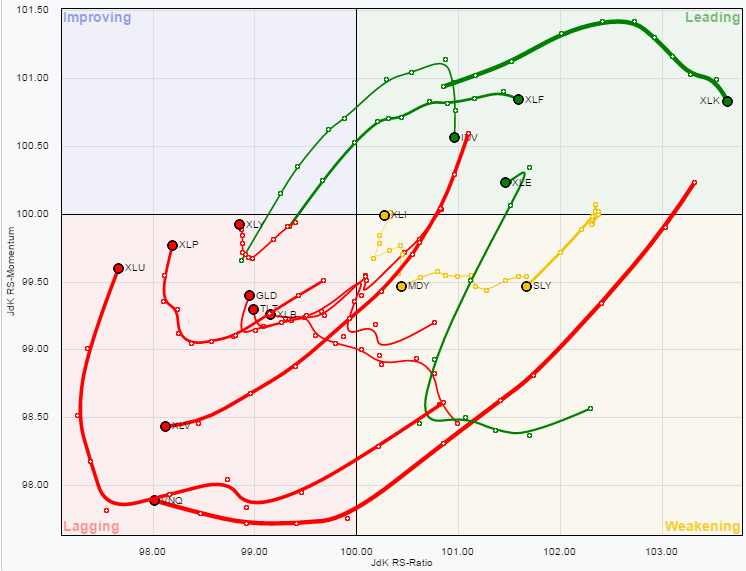
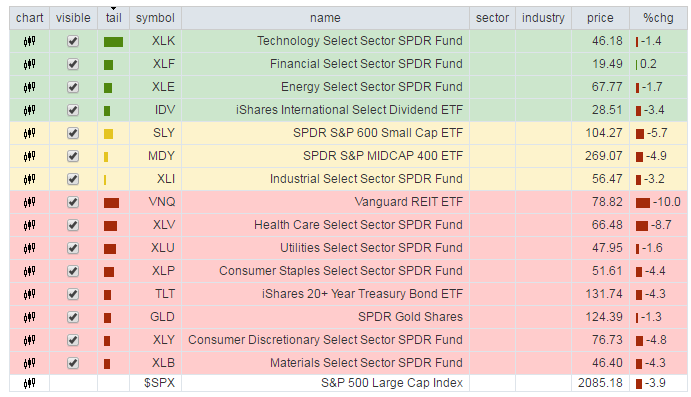
Utilities, REIT’s, Staples, Discretionary, Materials, Bonds, Gold, and Healthcare have remained under pressure this past week. While still underperforming the broad market there are continuing signs of improvement as money rotates from “risk” back towards traditionally “safer” investments.
As I have stated over the last couple of weeks:
“With the rise in rates largely done, sectors with the most benefit from falling rates look reasonable.”
The opposite holds true for those sectors that are adversely affected by a stronger dollar and weaker oil prices. With dollar tailwind still intact, and oil prices grossly extended, profit taking in Small-Cap, Mid-Cap, Emerging Markets, International and Energy stocks seems logical. This recommendation remains from the last couple of weeks and remains salient. “
IMPORTANT NOTE:
There is a difference between improving relative performance and “making money.” All the chart shows above is there are sectors that are either leading or lagging the S&P 500. Improvement DOES NOT mean the sector is making money. It only means the sector is either rising faster than index or not losing as much as the index.
Importantly, not losing as much as the overall index is still losing money.
As I stated last week:
“Lastly, given that a bulk of the sectors remain either in weakening or lagging sectors, this suggests the current advance in the market remains on relatively weak footing.”
I have been recommending taking profits in the Technology sector. This was due to the extreme levels of outperformance of that sector which has begun to fade. The rotation out of technology is likely not complete yet and brings into focus extremely oversold sectors such as Health Care, Utilities and Staples as potential candidates.
The risk-adjusted equally weighted model has been increased to 75%. However, the markets need to break above the previous consolidation range to remove resistance to a further advance.
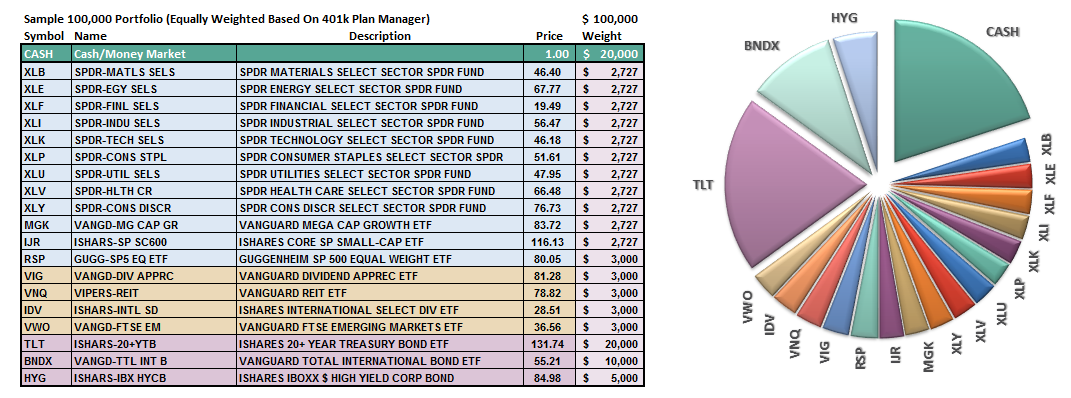
Such an increase will change model allocations to:
20% Cash
35% Bonds
45% in Equities.
As always, this is just a guide, not a recommendation. It is completely OKAY if your current allocation to cash is different based on your personal risk tolerance, time frames, and goals.
For longer-term investors, we still need to see improvement in the fundamental and economic backdrop to support the resumption of a long-term bullish trend. Currently, there is no evidence of that occurring.


