Written by Lance Roberts, Clarity Financial
Market Update
Last week, I analyzed each of the major sectors and markets. Click here to review that analysis.
Outside of a volatile price week, not much has changed in terms of the broader market keeping allocations reduced from targeted levels currently.

Let’s start with a weekly chart:
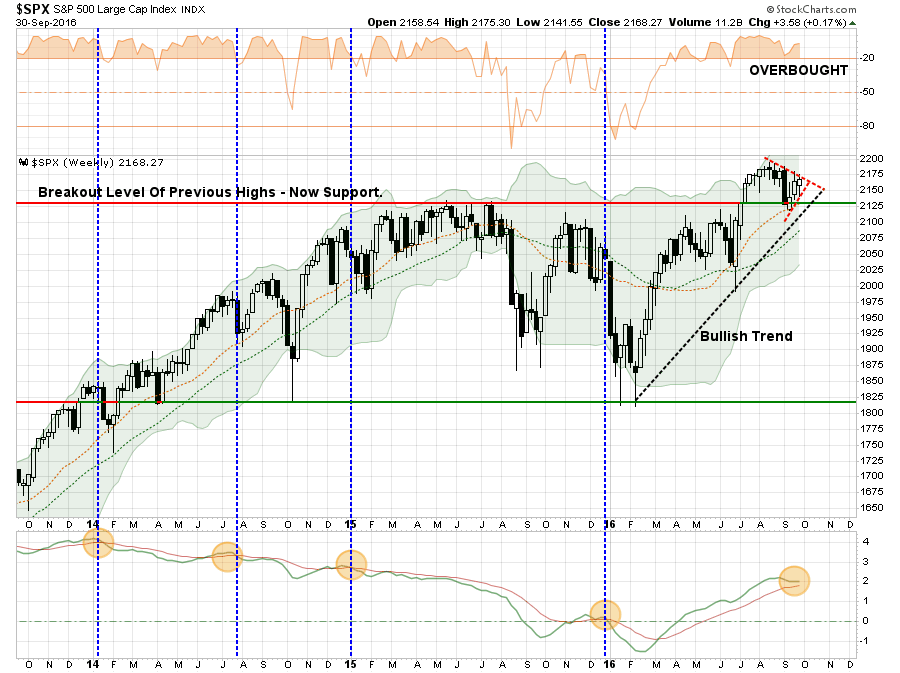
As stated at the beginning of this missive, the bullish trend remains intact currently and the “buy signal” from the February lows is still rising. However, that “buy signal,” as shown at the bottom of the chart, is close to reversing. With the S&P 500 currently in a very tight consolidation pattern, a break to the downside would likely quickly test support where the previous breakout level intersects with the bullish trend from the February lows. A violation of that level would likely lead to a rather sharp market correction of 8-10%.
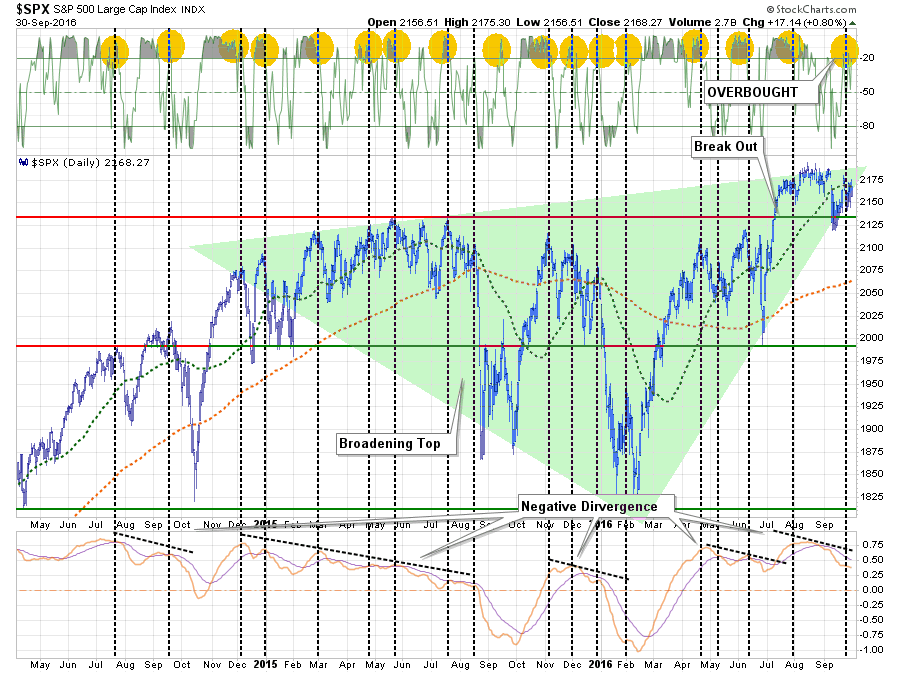
We can see this pattern a bit more clearly by looking at a daily chart.

The dashed red-lines show the consolidating “wedge” pattern currently building. A break out of this consolidation to the upside will lead to a very quick test of old highs with a breakout to “new highs” being an opportunity to increase equity exposure in portfolios for a seasonal year-end advance.
As shown, the market on a short-term basis remains extremely overbought and on a “sell signal” currently. This puts the market at risk of a break to the downside. Such a break will likely see markets quickly attempt a test of the 200-dma around 2060, with 2000 being the next most likely support.
As I wrote Tuesday:
“Currently, the market continues to struggle under an ‘active sell signal’ and the bullish trend support is not far below. If the market fails support of that trend-line expect a bigger correction to ensue.
Combined with current overbought conditions that still need to be resolved, the investment risk remains to the downside currently. This is also confirmed by the next chart below.”
“The markets remain confined within what currently appears to be a broadening topping pattern, or megaphone, which historically suggest a much bigger correction may be in the works. As with the chart above, the overbought condition of the market, combined with active sell signals, suggests the environment for more aggressive equity exposure is not currently present.
For now, we wait until the market resolves this current process by either breaking out to new highs confirming the bullish trend – OR – breaking the bullish trend line and beginning a larger correction process. Guessing at what happens next tends to not work out well for investors historically.”
As I stated above. The “bullish trends,” supported by ongoing Central Bank interventions, remain intact for now. Therefore, we remain invested, but do so cautiously with an eye on the risk of something eventually going wrong and plan for doing something about it when it does.
Do not dismiss the last sentence. It is critically important for you to remember that “having a plan,” and not “acting on the plan,” is the same as having “no plan at all.”
Model Update
S.A.R.M. Sector Analysis & Weighting
After a volatile price week, nothing much has changed from last week. While the advance was good, it failed to clear the 50-dma and which remains resistance for now. While actual portfolio equity risk weightings remain below our target of 75% again this week, the consolidation pattern of the market keeps us somewhat on hold.
However, as stated above, I did add a small trading position to the portfolios of an equal weight S&P 500 index ETF. I am maintaining a very tight stop at the current running bullish trend line, as shown below. I am not highly confident in the addition of the position at the current time, but the market has continued to consistently hold the bullish trend line. Again, this is a trading position and NOT a long-term hold at this point.

Once we see how markets open on Monday, I will consider adding an equal sized position to portfolios of the Volatility Index (VXX) as a hedge if necessary. I will update this analysis in Tuesday’s Technically Speaking post (click here for free e-delivery)
Outside of the addition of the one trading position this week, I do have sector specific trading positions loaded into the system which will be executed consistent with a breakout to new highs. Let’s take a look at the equal weighted portfolio model.
(Note: This is an equally weighted model example and may differ from discussions of overweighting/underweighting specific sectors or holdings.)
Relative performance of each sector of the model as compared to the S&P 500 is shown below. The table compares each position in the model relative to the benchmark over a 1, 4, 12, 24 and 52-week basis.
Historically speaking, sectors that are leading the markets higher continue to do so in the short-term and vice-versa. The relative improvement or weakness of each sector relative to index over time can show where money is flowing into and out of. Normally, these performance changes signal a change that last several weeks.
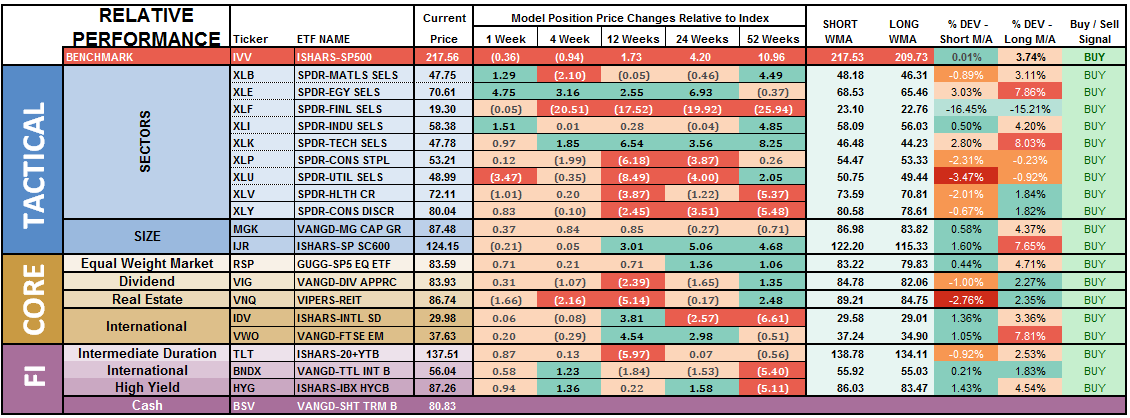
Notice in the next to last column to the right, the majority of sectors which have previously been pushing extreme levels of deviation from their long-term moving average, have corrected much of those extremes.
Financials, Basic Materials, Staples, Utilities, REIT’s and Bonds are currently at the biggest deviations below their short-term moving average. Historically speaking, and as noted above, such deviations would suggest these sectors deserve some attention in portfolios as this is where buying opportunities TEND to exist. It also supports the comment above that a further consolidation or correction in the markets is likely as these more defensive sectors tend to benefit from the rotation from “risk” to “safety.”
The chart below is the “spaghetti” chart, via StockCharts, showing the relative strength/performance rotation of sectors relative to the S&P 500. If we are trying to “beat the index” over time, we want to overweight sectors/asset classes that are either improving in performance or outperforming the index, and underweight or exclude everything else.
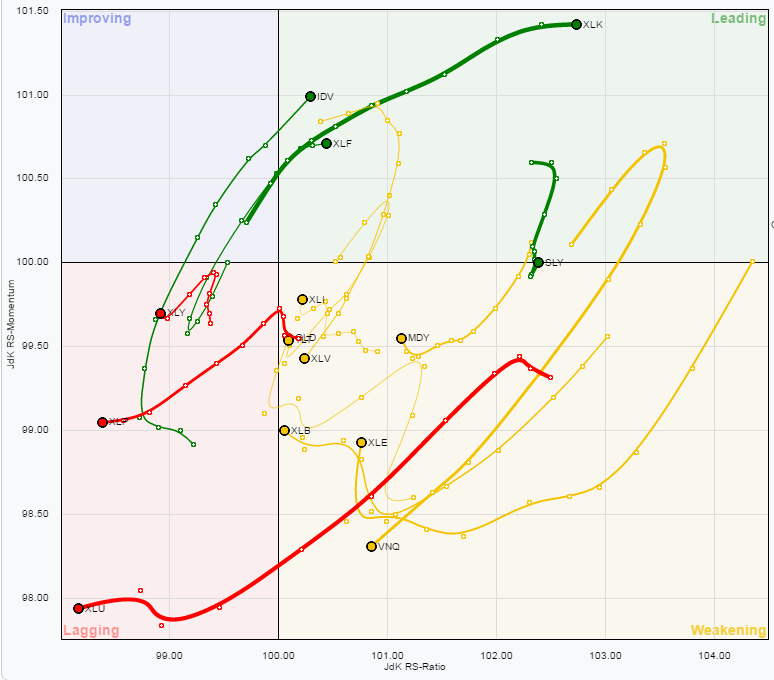

Utilities, Staples and Discretionary have remained under pressure this past week and leadership picked up in International, Small Cap and Financial sectors due to the short-covering push on Friday.
However, given that a bulk of the sectors remain either in weakening or lagging sectors, this suggests the current advance in the market remains on relatively weak footing.
Profits should be taken out of Technology stocks within the next week or two as the current outperformance of this sector is very long in the tooth. Look for a rotation from Technology back into “safety” sectors in the days ahead.
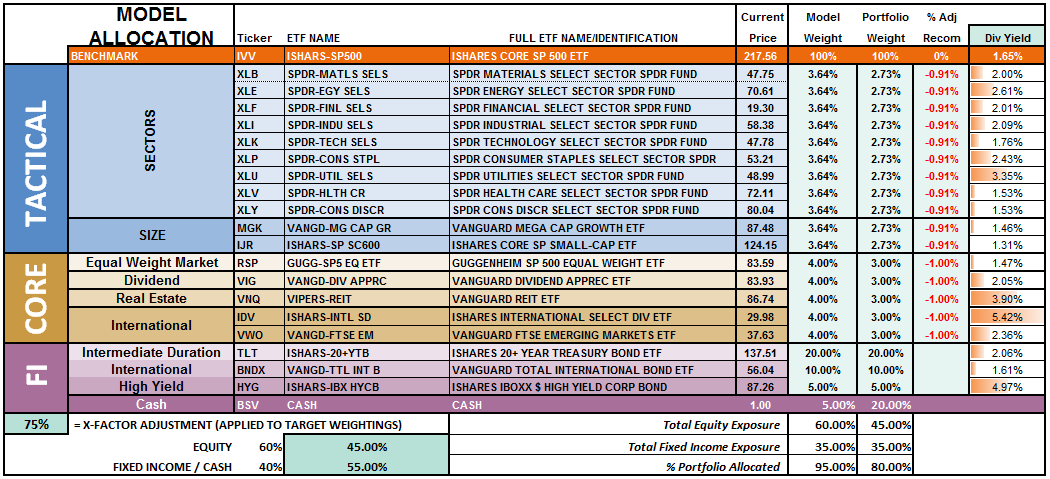
The risk-adjusted equally weighted model has been increased to 75%. However, the markets need to break above the previous consolidation range to remove resistance to a further advance.
Such an increase will change model allocations to:
20% Cash
35% Bonds
45% in Equities.
As always, this is just a guide, not a recommendation. It is completely OKAY if your current allocation to cash is different based on your personal risk tolerance, time frames, and goals.
For longer-term investors, we still need to see improvement in the fundamental and economic backdrop to support the resumption of a long-term bullish trend. Currently, there is no evidence of that occurring.
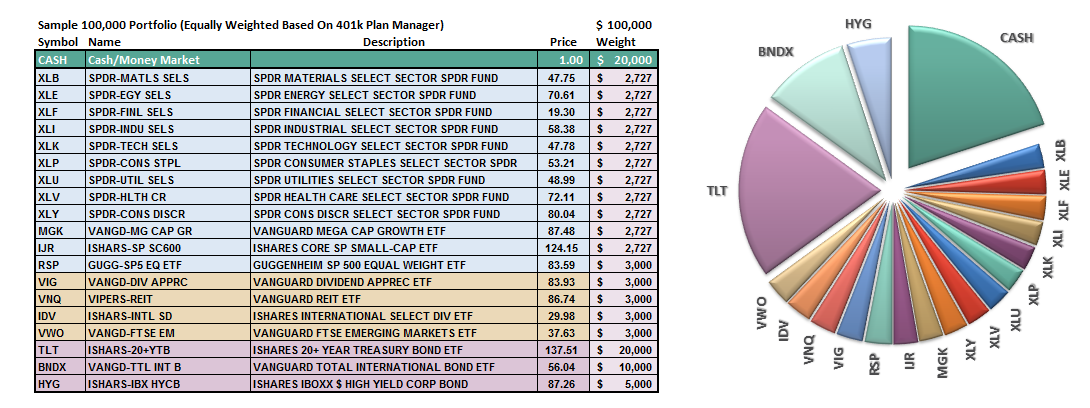
THE REAL 401k PLAN MANAGER
The Real 401k Plan Manager – A Conservative Strategy For Long-Term Investors

NOTE: I have redesigned the 401k plan manager to accurately reflect the changes in the allocation model over time. I have overlaid the actual model changes on top of the indicators to reflect the timing of the changes relative to the signals.
There are 4-steps to allocation changes based on 25% reduction increments. As noted in the chart above a 100% allocation level is equal to 60% stocks. I never advocate being 100% out of the market as it is far too difficult to reverse course when the market changes from a negative to a positive trend. Emotions keep us from taking the correct action.

Round-Trippin’ – Part II
With only a slight tweak to last week’s opening sentence, everything pretty much remains the same.
This past week the markets bounced sharply off of the bullish trend support line as Deutsche Bank received a reprieve with rumors of a reduced fine from the DOJ.
However, with that, we round-tripped right back to where we started from.
So, is the correction over? Not sure just yet, again.
Early warning signals are suggesting the correction has more room to go, so let’s be patient once again this coming week.
Over the past several weeks, I have continued to suggest reviewing portfolios, reducing risk, rebalancing and preparing for “whatever comes next.” That advice has paid off by reducing volatility in portfolios. If you haven’t done anything yet, I would continue to suggest using this bounce, as I predicted last week, to take some action to clean up allocations by:
Tightening up stop-loss levels to current support levels for each position.
Taking profits in positions that have been big winners
Sell laggards and losers
Raise cash and rebalance portfolios to target weightings.
With the election right around the corner, increased volatility is expected. Therefore, having a little extra cash in portfolios will likely be a good hedge.
If you need help after reading the alert; don’t hesitate to contact me.
Current 401-k Allocation Model
The 401k plan allocation plan below follows the K.I.S.S. principal. By keeping the allocation extremely simplified it allows for better control of the allocation and a closer tracking to the benchmark objective over time. (If you want to make it more complicated you can, however, statistics show that simply adding more funds does not increase performance to any great degree.)

401k Choice Matching List
The list below shows sample 401k plan funds for each major category. In reality, the majority of funds all track their indices fairly closely. Therefore, if you don’t see your exact fund listed, look for a fund that is similar in nature.


