
Written by Lance Roberts, Clarity Financial
Sector By Sector
Let’s take a quick look at the 9-major sectors of the S&P 500 to determine the overall strength of the bullish bias.

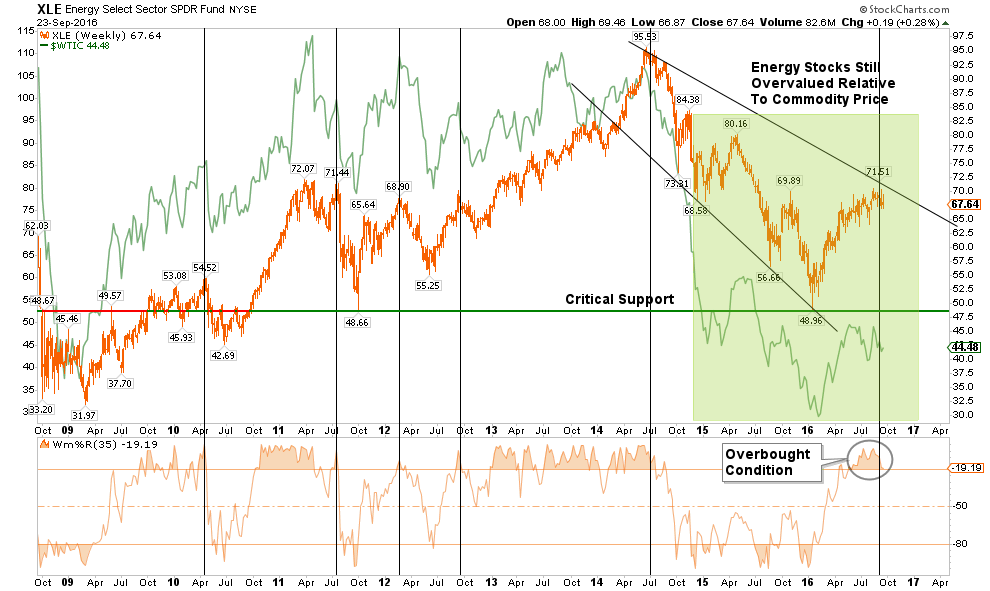
ENERGY
The energy sector is closely tied to the underlying commodity price. Given the ongoing structural dynamics of the commodity, there is still an unrealized detachment between energy sector fundamentals and the markets. There is still more correction to occur in this sector so underweight energy exposure is advised for now.
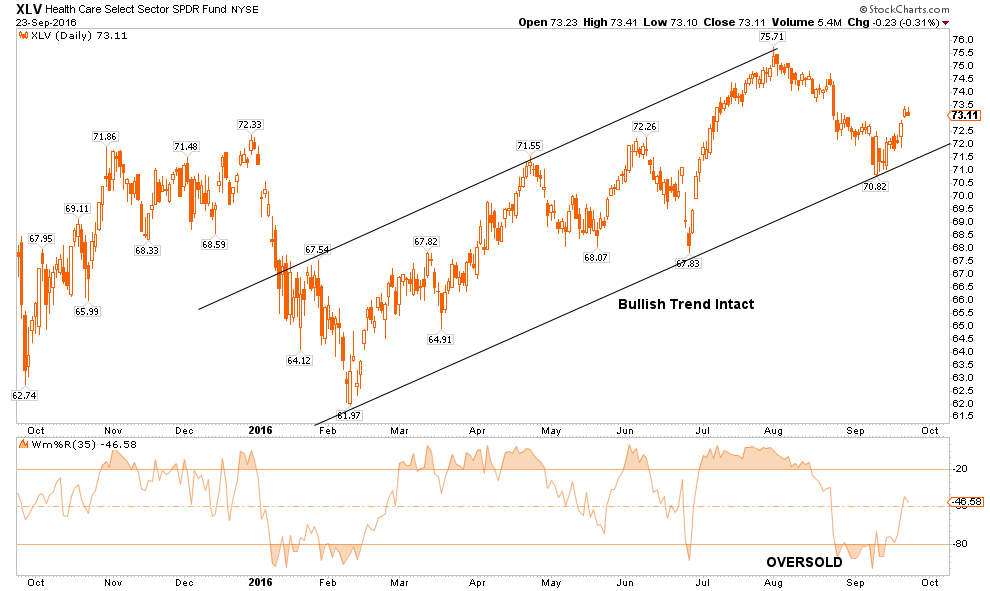
HEALTH CARE
The healthcare sector has been a laggard as of late and is currently recovering from an oversold condition. With the bullish trend line still intact, I would expect this sector to outperform the broader market over the next week as money continues a rotation from “risk” towards “less risk.”
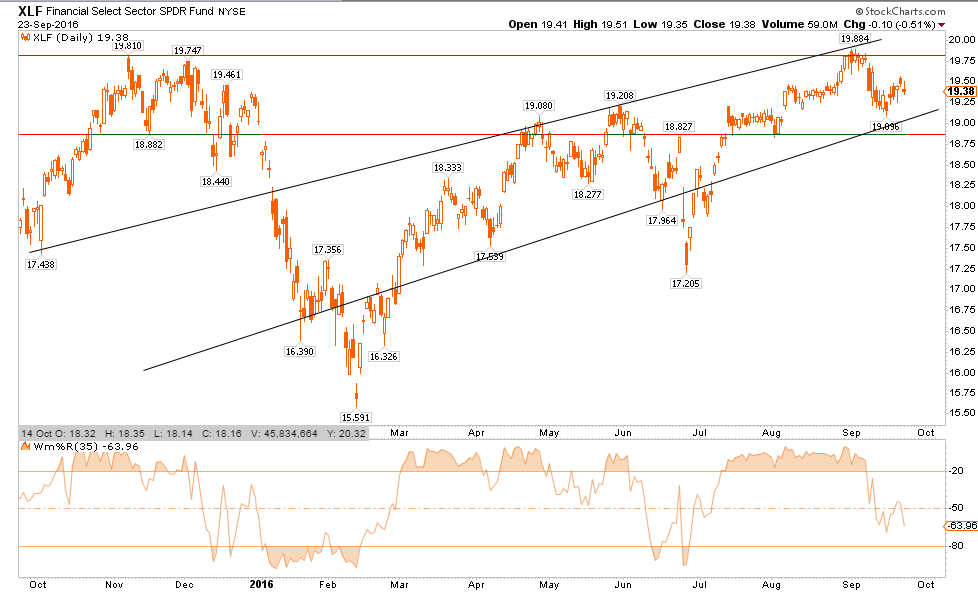
FINANCIALS
Financials continue to be a laggard and with the fundamental problems in the sector, and with major banks, the relative “risk” of ownership continues to outweigh the potential rewards for now. I continue to recommend an underweighting of the sector in portfolios for now.
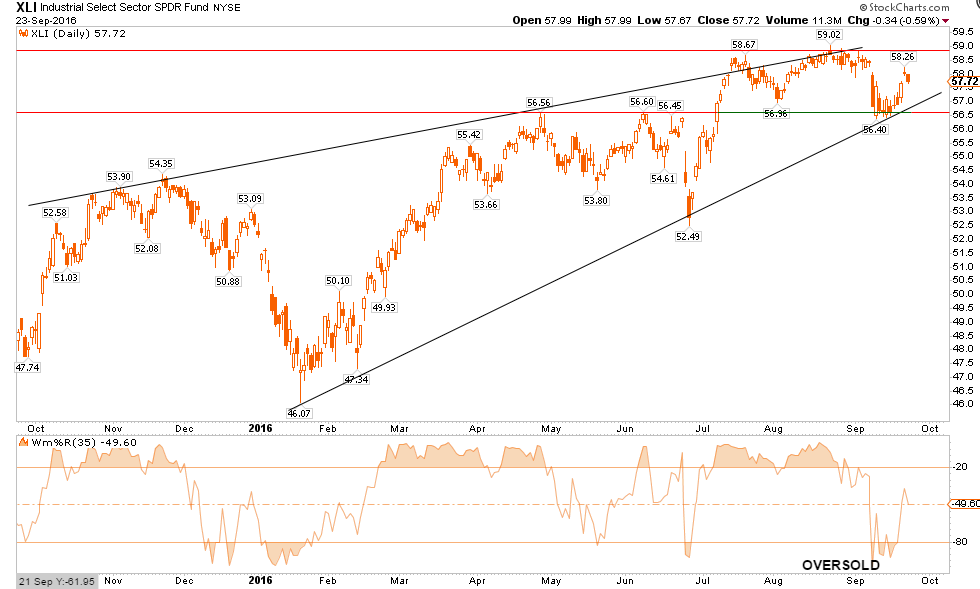
INDUSTRIALS
Industrial stocks, because of the dividend yield, continue to remain overweight in portfolios for now. However, this sector is directly affected by the broader economic cycle and with expectations ahead of fundamental realities, risk is high. No more than a normal weight position in portfolios is advised for now with stops set just below the bullish trend line.
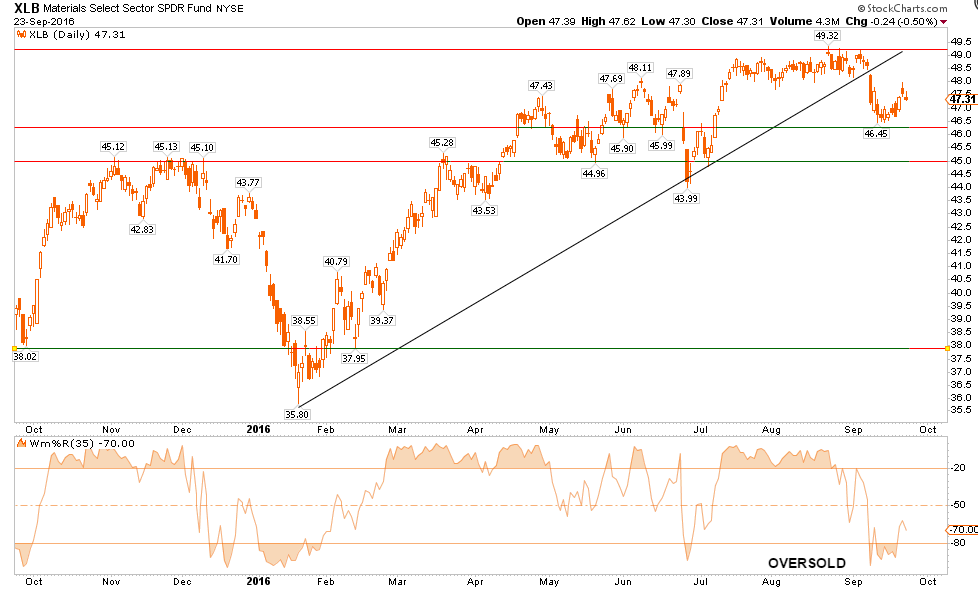
MATERIALS
Basic Materials, also a beneficiary of the dividend chase, have broken their bullish trend line. This takes the sector to an underweight holding for now with stops set at the lower support lines $45.00.
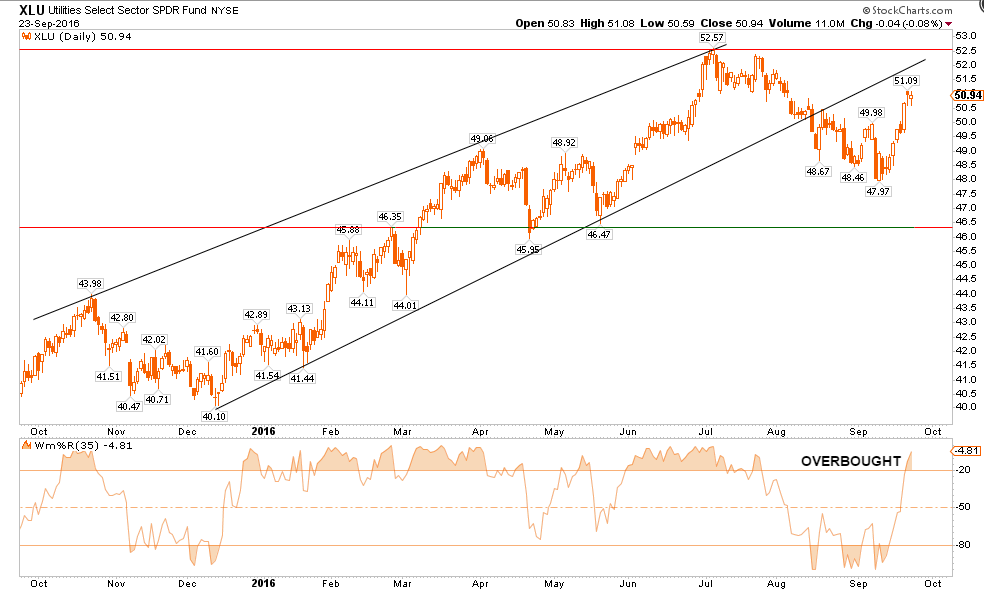
UTILITIES
As I suggested last week, Utilities have had a strong advance this week as money rotated back into “safety” plays of bonds and interest rate sensitive sectors. However, like the Materials sector, the bullish trend line has been broken so caution is advised. Stops should be set on current holdings at $46.5.
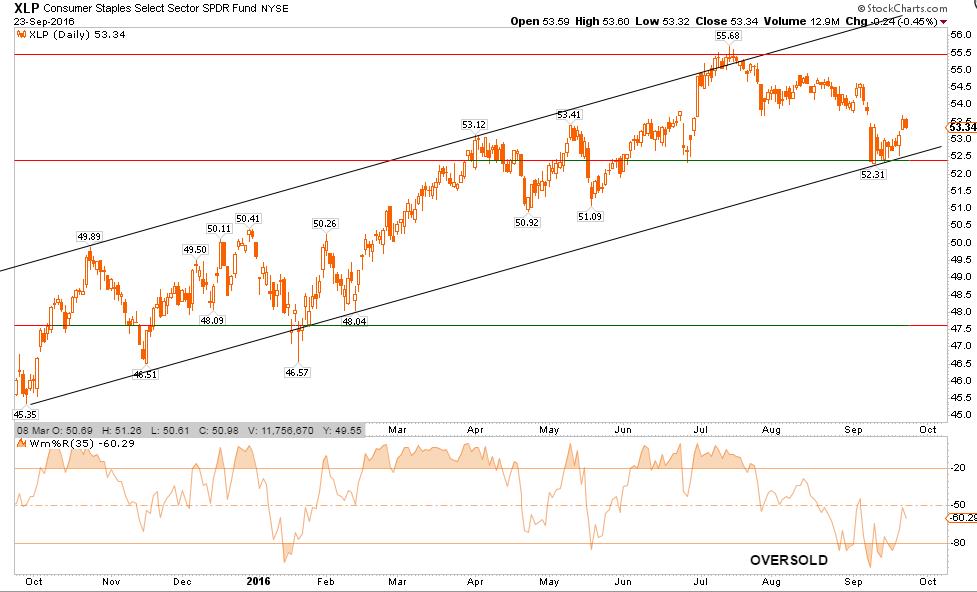
STAPLES
Staples, another beneficiary of the yield and safety chase, held support at the bullish trend line and is currently oversold. Weightings to this sector can be increased for now with a target at the upper resistance levels of old highs.
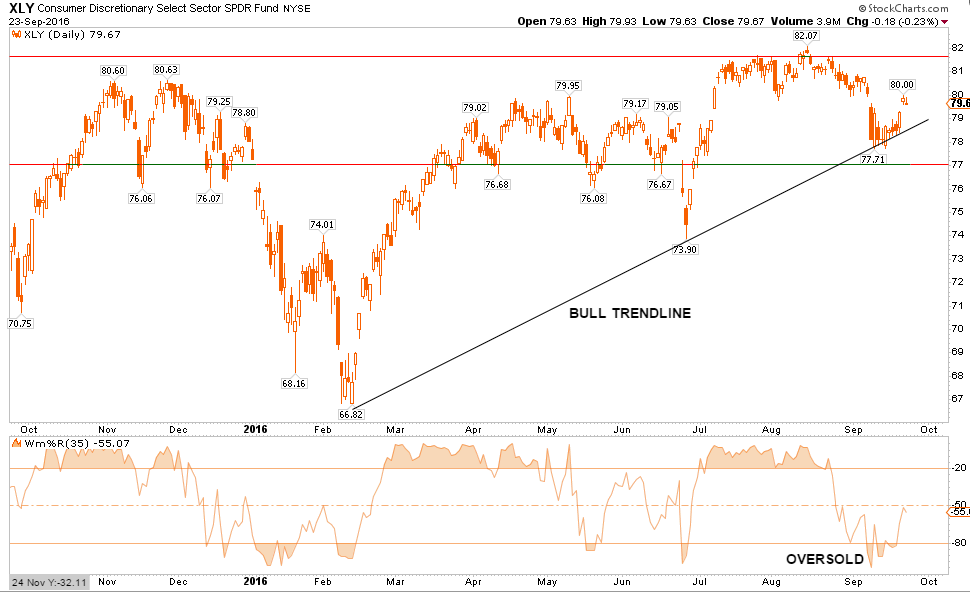
DISCRETIONARY
As goes Staples, so goes Discretionary. Same advice as well. Portfolio weightings can be increased for now to Discretionary holdings with a target of previous highs. Stops should be set at the bullish trend line support.
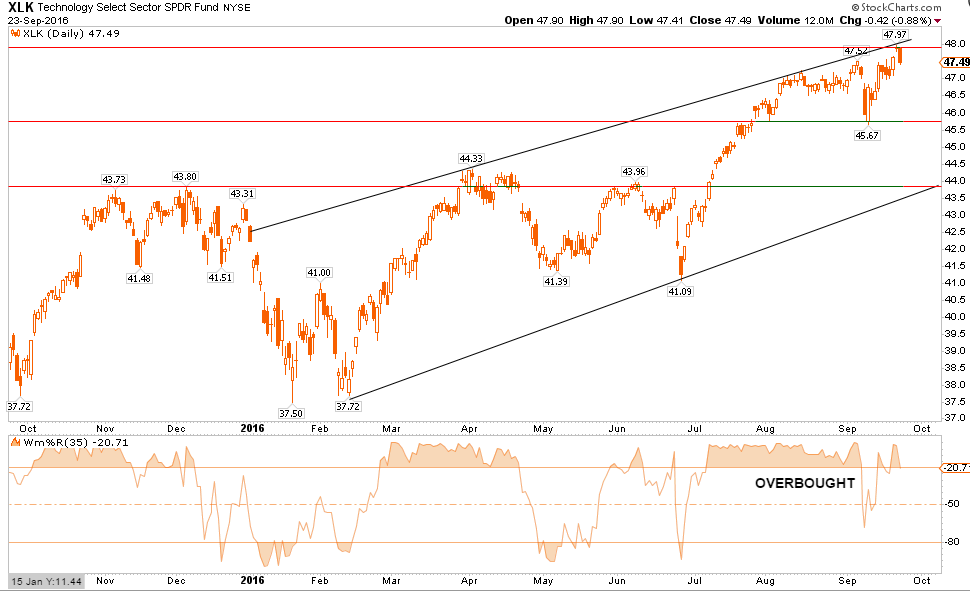
TECHNOLOGY
The Technology sector has been the “obfuscatory” sector over the past couple of weeks. Due to the large weightings of Apple, Google, Facebook, and Amazon, the sector kept the S&P index from turning in a worse performance than should have been expected. Apple’s surge alone last week accounted for roughly half of the performance of the index alone. The sector is overbought but in a strong trend. Weighting should be at normal portfolio weight for now with a stop at the recent lows.
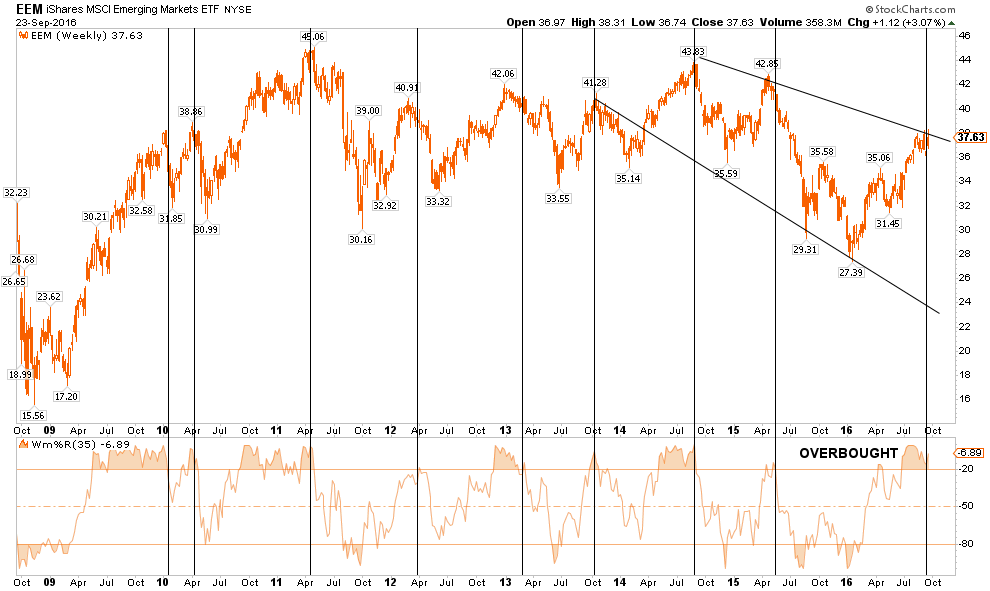
EMERGING MARKETS
Emerging markets have had a very strong performance during the summer but remain in a very defined downtrend. With the sector once again at very overbought levels, profits should be harvested and the sector under-weighted in portfolios. Long-term underperformance of the sector relative to domestic stocks continues to keep emerging markets unfavored in allocation models for now.
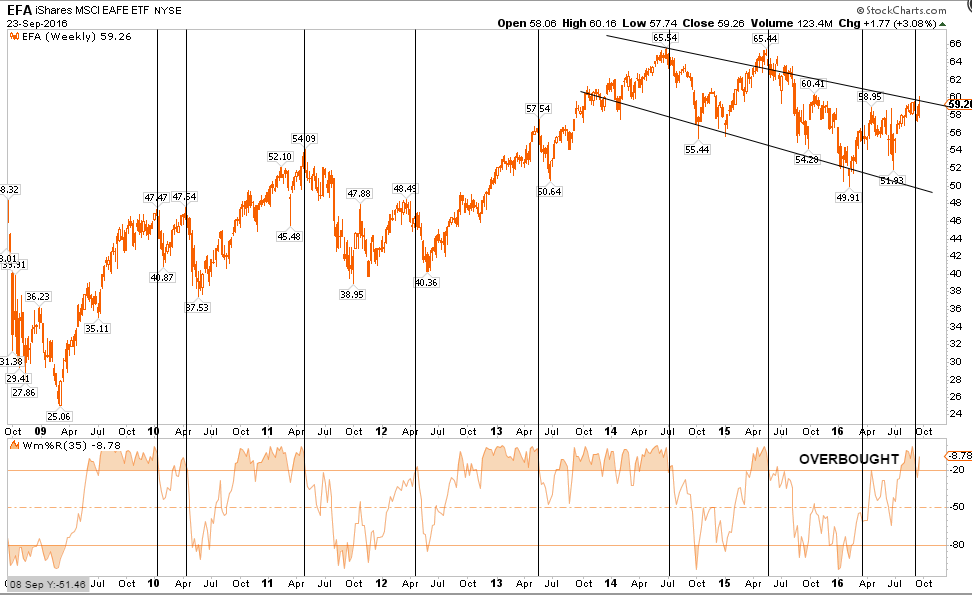
INTERNATIONAL MARKETS
As with Emerging Markets, International sectors also remain unfavored in allocation models. The long-term downtrend remains intact and is currently very overbought. Underweight the sector for now, take profits, and focus more on domestic sectors for now.
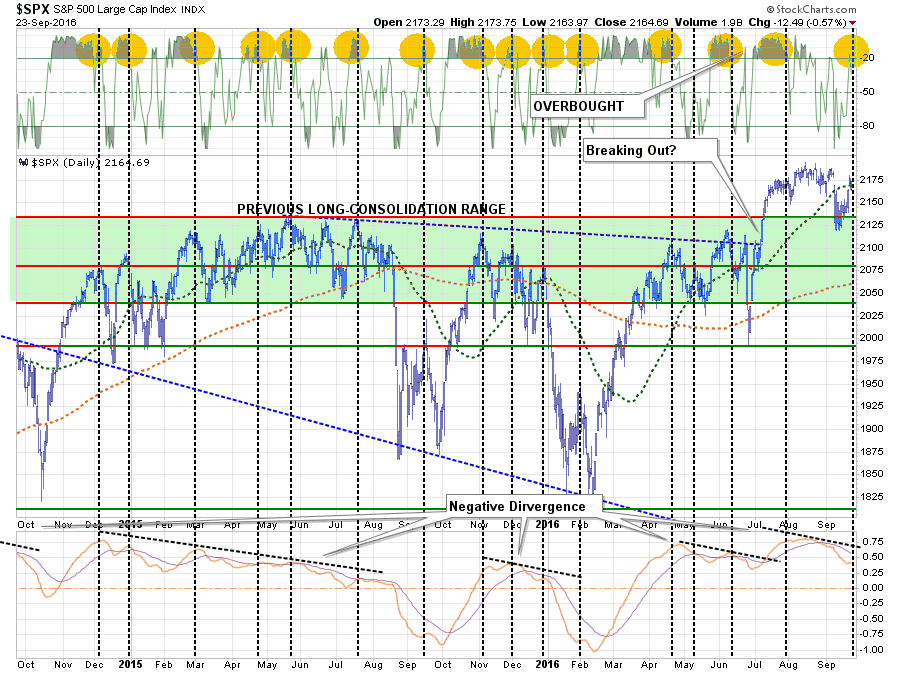
DOMESTIC MARKETS
The S&P 500 had a good run last week as the Fed remained on the sidelines once again. However, with the markets back to overbought, and failing to hold its respective 50-dma, the corrective process is likely not over as of yet. Caution still advised for now.
Still Buying Bonds
Two weeks ago, I discussed what I believe to be the premature calls for the death of the “bond bull market.” As I wrote:
“Given that interest rates had gotten extremely oversold during the ‘Brexit,’ as money poured into bonds for safety, it is not surprising to see rates have a reflexive move higher. What we saw on Friday was likely rate “shorts” being blown out of positions.”
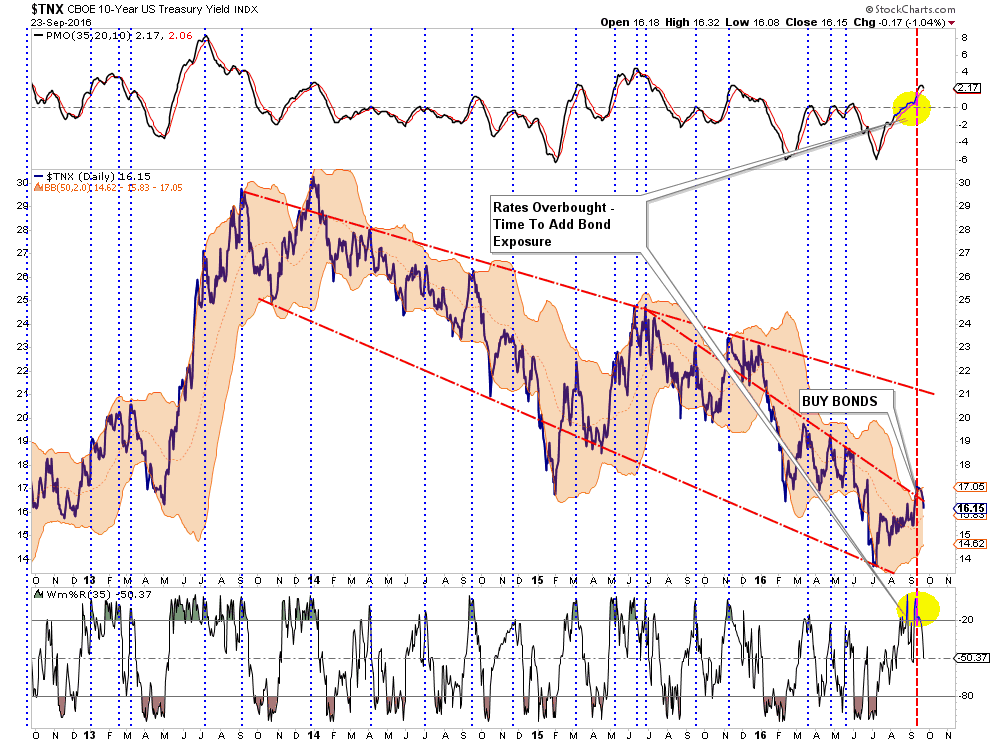
“Importantly, while interest rates could possibly tick higher to the long-term downtrend line at 2.1%, (OMG, run for the hills), the reality is the economy is not growing strongly enough to support substantially higher rates which will push the economy more quickly towards the next recession.
Of course, during recessions interest rates fall sharply which is why I still suspect, given the majority of global economies in negative territory, them to ultimately approach zero.“
With economic data still pointing to a weaker economic environment ahead, I am still buying bonds.
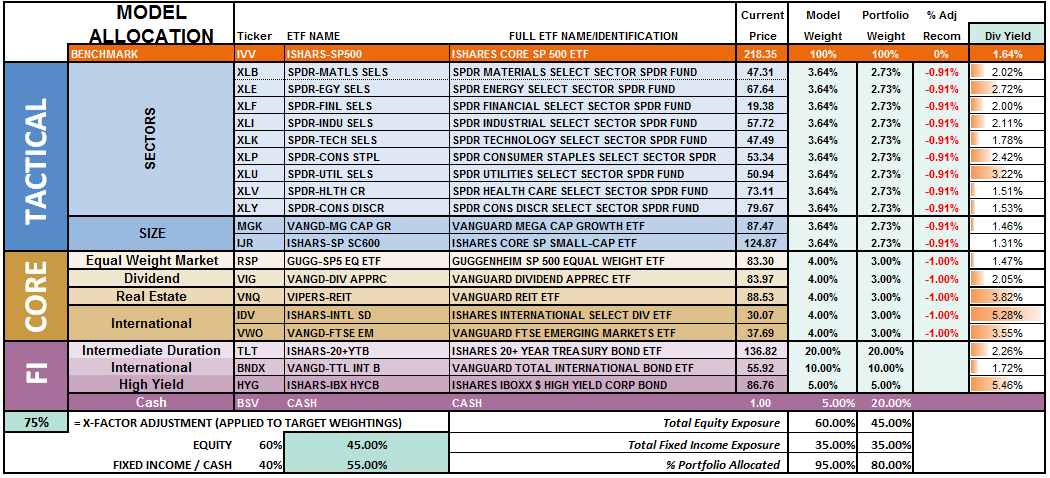
Model Update
S.A.R.M. Sector Analysis & Weighting
As I said last week:
“The question now – is it over yet? The internal damage to the market was substantially greater than the headline index would suggest, so some caution is advised heading into next week. However, we have been looking for an opportunity to increase equity exposure in portfolios and we may get that opportunity soon. We will patiently wait and let the market “tell us” what to do next rather than “guessing” at it. “
While the advance was good, it failed to clear the 50-dma and remains below significant overhead resistance. While actual portfolio equity risk weightings remain below our target of 75% again this week, the odds of a further correction next week keeps us on hold for now until we find a short-term bottom and can redetermine risk/reward ratios. I have loaded positions in the trading system to be allocated if the markets continue to strengthen next week.
(Note: This is an equally weighted model example and may differ from discussions of overweighting/underweighting specific sectors or holdings.)
Relative performance of each sector of the model as compared to the S&P 500 is shown below. The table compares each position in the model relative to the benchmark over a 1, 4, 12, 24 and 52-week basis.
Historically speaking, sectors that are leading the markets higher continue to do so in the short-term and vice-versa. The relative improvement or weakness of each sector relative to index over time can show where money is flowing into and out of. Normally, these performance changes signal a change that last several weeks.
As I noted last week as well:
“The recent spike in interest rates has now reached the top of the long-term downtrend and suggests that staples, utilities, and bonds will improve in performance over the next couple of weeks. Such improvement will most likely coincide with an ongoing market consolidation or correction.”
That advice worked out well this past week and remains this week as well.
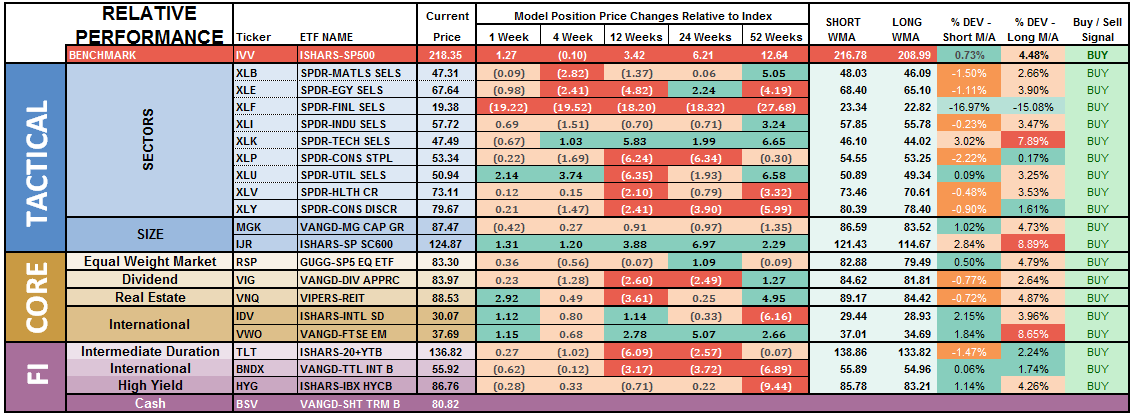
Notice in the next to last column to the right, the majority of sectors which have previously been pushing extreme levels of deviation from their long-term moving average, have corrected much of those extremes.
Basic Materials, Staples, Utilities, REIT’s and Bonds are currently at the biggest deviations below their short-term moving average. Historically speaking, and as noted above, such deviations would suggest these sectors deserve some attention in portfolios as this is where buying opportunities TEND to exist. It also supports the comment above that a further consolidation or correction in the markets is likely as these more defensive sectors tend to benefit from the rotation from “risk” to “safety.”
Importantly, if the current pullback is a “buy the dip” opportunity, the sectors that maintain their technical underpinnings and resolve the extreme deviations from short and long-term moving averages will provide good opportunities to add to portfolios.
The two charts below graphically show the relationship of each position’s performance relative to the S&P 500 Index. If we are trying to “beat the index” over time, we want to overweight sectors/asset classes that are either improving in performance or outperforming the index, and underweight or exclude everything else.
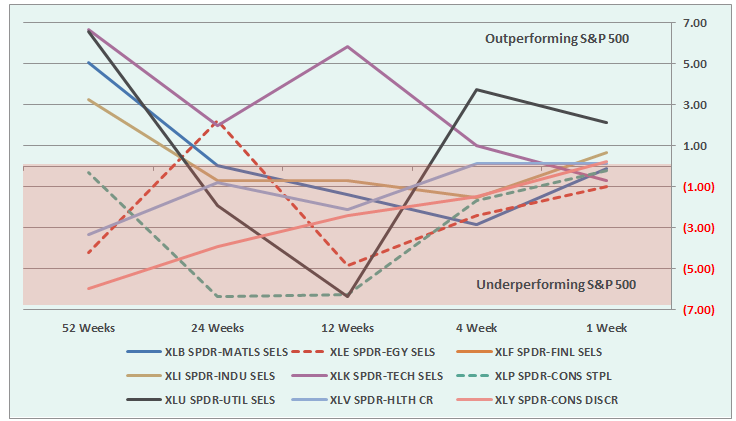
Sectors Currently Outperforming by >1%
Utilities (improving)
Sectors Currently Performing In Line <>1%
Healthcare
Staples
Discretionary (improving)
Energy
Materials (improving)
Industrials (improving)
Sectors Currently Under Performing By >1%
Financials (weakening – $WFC related, could spread to other majors.)
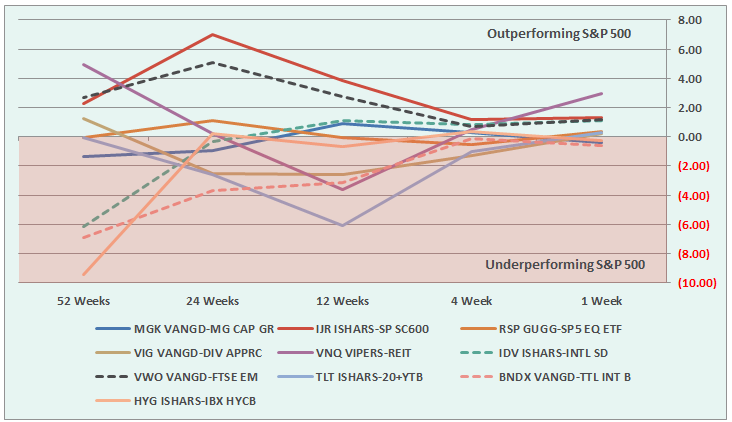
Index/Other Asset Classes Out Performing S&P 500 By >1%
REIT’s (improving)
International (improving, but extreme overbought)
Emerging Markets (improving, but extreme overbought)
Small Caps (improving)
Index/Other Asset Classes Performing In-Line With S&P 500 <>1%
Equal-Weight S&P 500 (improving)
Dividend Stocks (improving)
International Bonds
High Yield Bonds
Domestic Bonds (improving)
Mid-Cap Stocks (weakening)
Index/Other Asset Classes Under Performing S&P 500 By >1%
None
The risk-adjusted equally weighted model has been increased to 75%. However, as stated above, further consolidation in the markets is needed before making any changes.
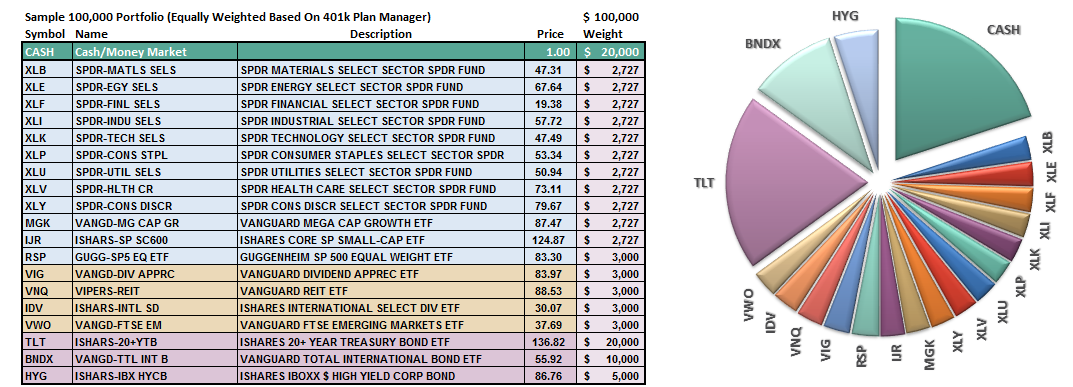
Such an increase will change model allocations to:
20% Cash
35% Bonds
45% in Equities.
As always, this is just a guide, not a recommendation. It is completely OKAY if your current allocation to cash is different based on your personal risk tolerance, time frames, and goals.
For longer-term investors, we still need to see improvement in the fundamental and economic backdrop to support the resumption of a long-term bullish trend. Currently, there is no evidence of that occurring.
THE REAL 401k PLAN MANAGER
The Real 401k Plan Manager – A Conservative Strategy For Long-Term Investors
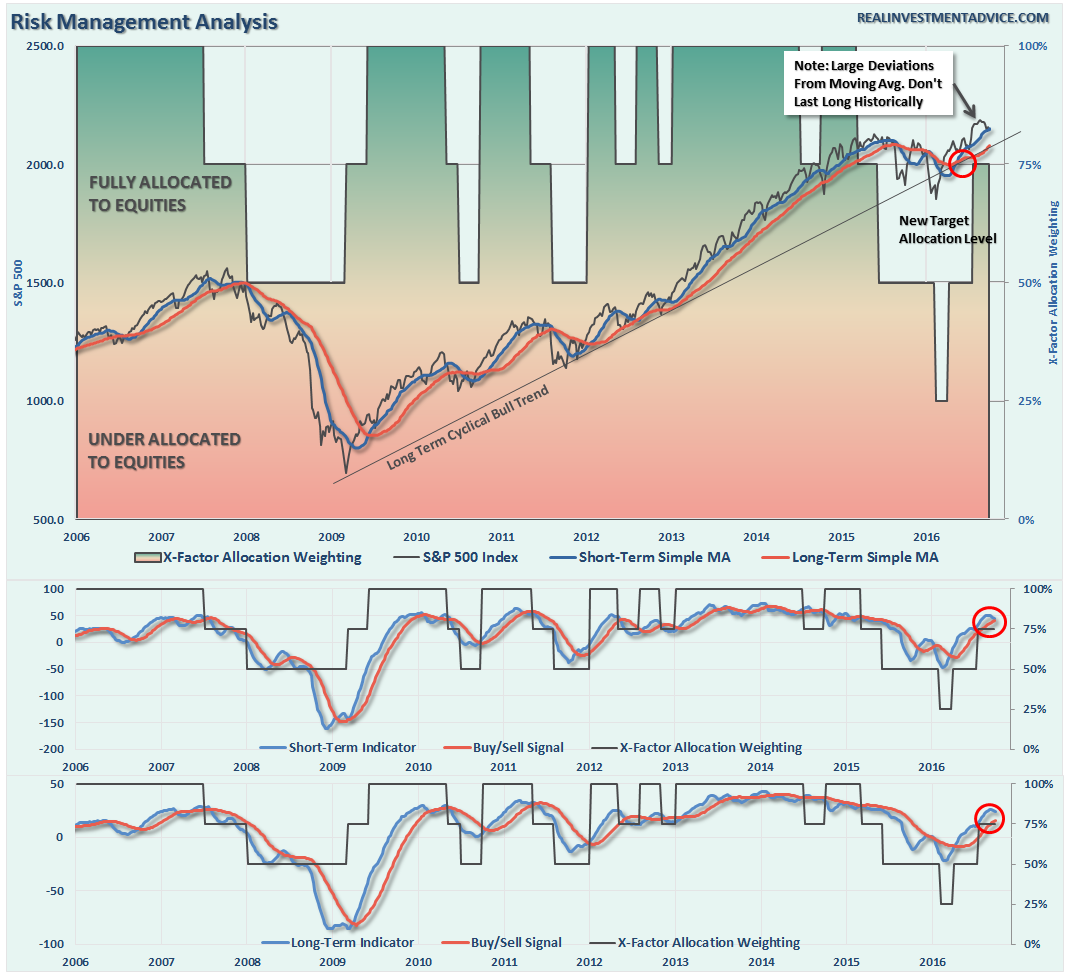
NOTE: I have redesigned the 401k plan manager to accurately reflect the changes in the allocation model over time. I have overlaid the actual model changes on top of the indicators to reflect the timing of the changes relative to the signals.
There are 4-steps to allocation changes based on 25% reduction increments. As noted in the chart above a 100% allocation level is equal to 60% stocks. I never advocate being 100% out of the market as it is far too difficult to reverse course when the market changes from a negative to a positive trend. Emotions keep us from taking the correct action.

Round-Trippin’
This past week the markets bounced sharply off of the bullish trend support line as Yellen & Co. promised to not remove the punch bowl now until Christmas. What a “Grinch.”
However, with that, we round-tripped right back to where we started from.
So, is the correction over? Not sure just yet.
Early warning signals are suggesting the correction has more room to go, so let’s be patient this coming week. By this time, next week, we will likely have a fairly good indication as to what the market wants to do.
Over the past several weeks, I have continued to suggest reviewing portfolios, reducing risk, rebalancing and preparing for “whatever comes next.” That advice has paid off by reducing volatility in portfolios. If you haven’t done anything yet, I would continue to suggest using this bounce, as I predicted last week, to take some action to clean up allocations by:
Tightening up stop-loss levels to current support levels for each position.
Taking profits in positions that have been big winners
Sell laggards and losers
Raise cash and rebalance portfolios to target weightings.
With the election right around the corner, increased volatility is expected. Therefore, having a little extra cash in portfolios will likely be a good hedge.
If you need help after reading the alert; don’t hesitate to contact me.
Current 401-k Allocation Model
The 401k plan allocation plan below follows the K.I.S.S. principal. By keeping the allocation extremely simplified it allows for better control of the allocation and a closer tracking to the benchmark objective over time. (If you want to make it more complicated you can, however, statistics show that simply adding more funds does not increase performance to any great degree.)

401k Choice Matching List
The list below shows sample 401k plan funds for each major category. In reality, the majority of funds all track their indices fairly closely. Therefore, if you don’t see your exact fund listed, look for a fund that is similar in nature.


