by Lance Roberts, Clarity Financial
This past week featured a rather dismal set of economic data confirming continuing weakness from wholesale trade, to ISM manufacturing to the employment report on Friday. The good news is “the market loved it.”

Despite the “hawkish” intentions by the Fed to suggest they would raise interest rates in September, the weak data likely keeps them “sidelined” once again waiting for more confirmation of a strengthening economy that never actually comes. However, keeping the Fed on the sidelines when translated means “continued accommodation for the markets.”
John Murphy over at Stockcharts.com summed it up well:
“This morning’s August jobs report saw a gain of 151,000 jobs versus estimates for a gain of 180,000. That low number is giving a boost to stocks, and helping to unwind some of the recent hedges against a possible September rate hike.“
So stocks rose on Friday.
Unfortunately, as shown in the chart below. We just aren’t really going anywhere.

The good news is the market is holding its bullish trend line which runs along the 50-day moving average. A violation of that moving average will likely lead to a retest of the previous breakout highs which intersects with the more important bullish trend from the February lows. That bull trend line was successfully tested in June allowing for an increase in equity exposure in portfolios at that time. However, since then, not much has happened.
David Larew (you should follow him @ThinkTankCharts) had a couple of very interesting pieces on Friday confirming my own analysis.
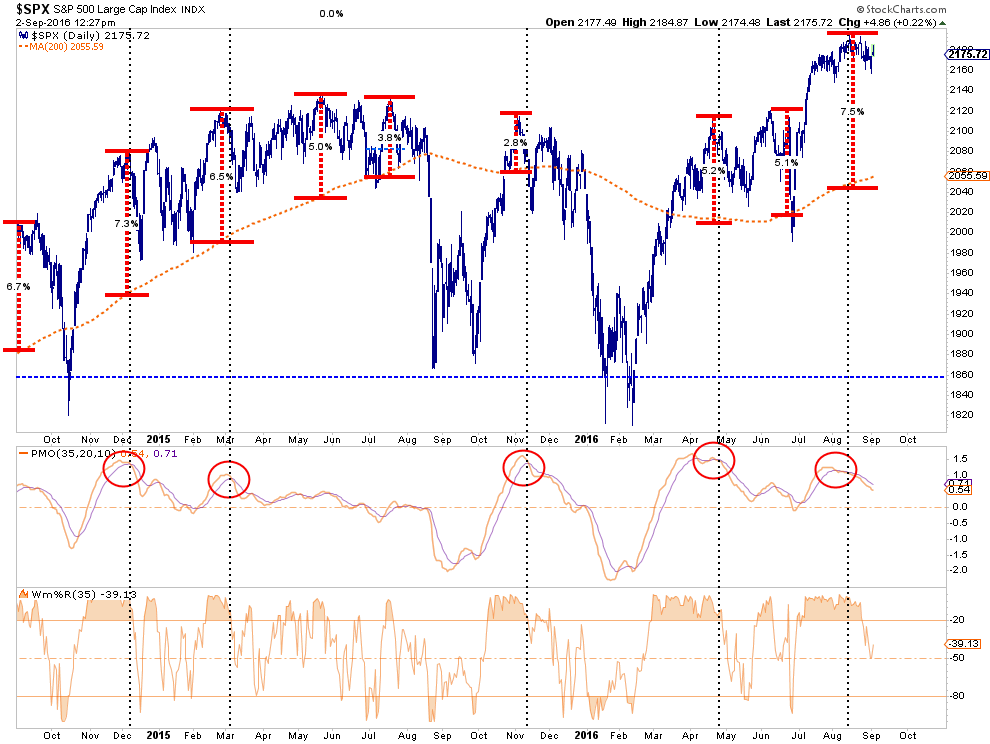
The chart below shows the negative divergences in relative strength and the moving average convergence divergence indicators.
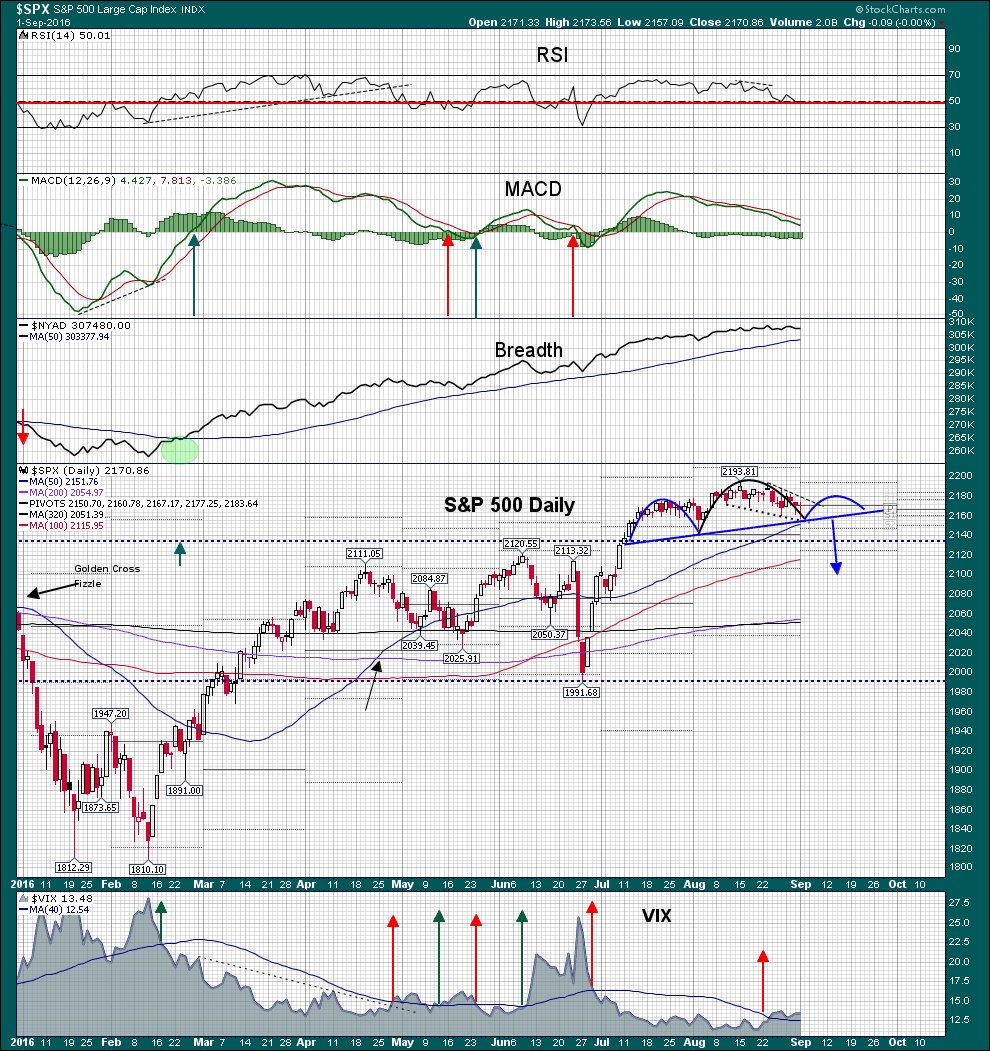
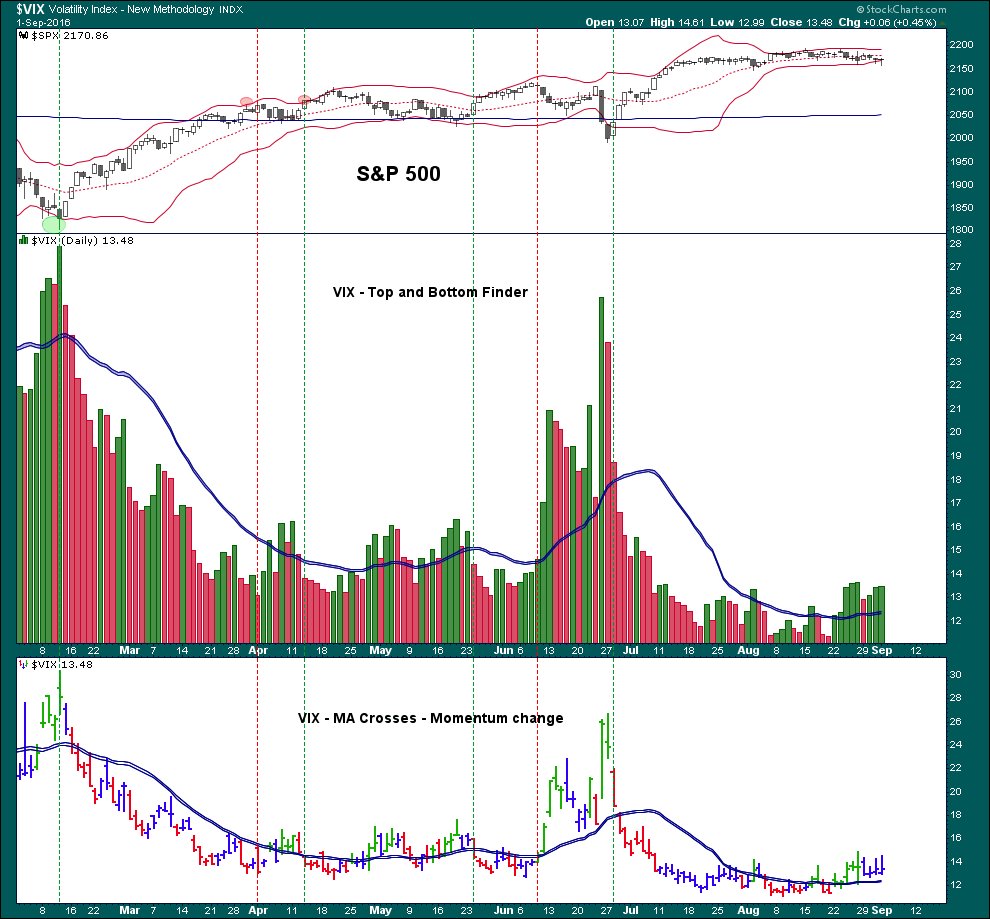
David shows the market wrestling with a supportive “neckline” currently which is indicative of a more important developing topping pattern. With the Volatility Index breaking above its moving average, and the range of the VIX very compressed (chart below) a rather violent break to the downside would not be surprising.
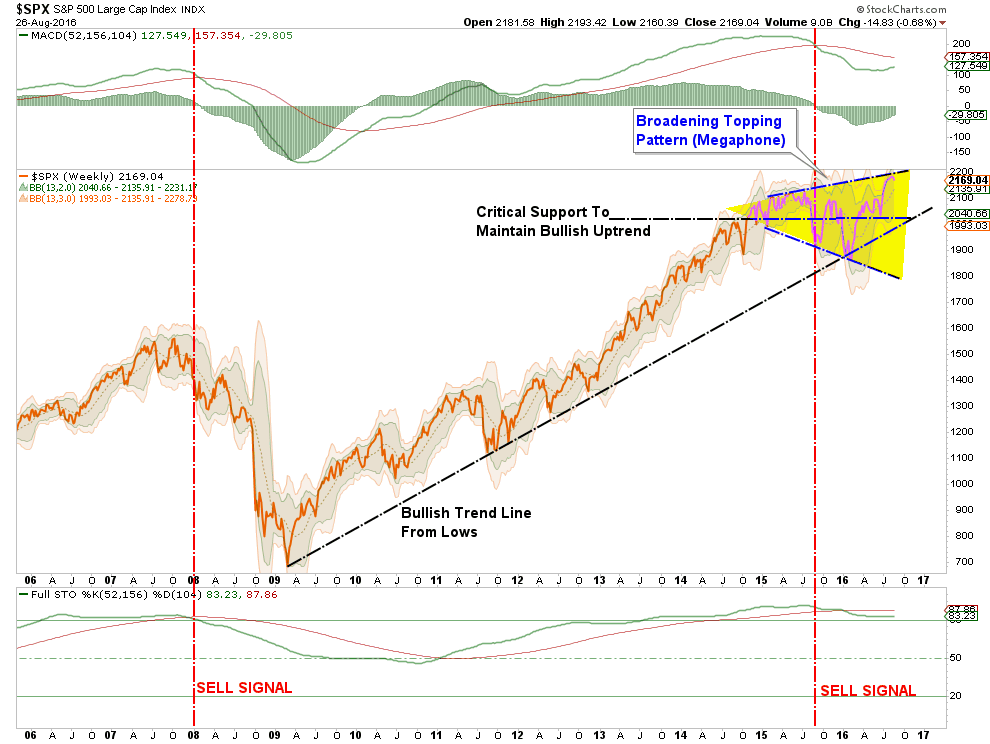
This potential topping pattern also brings into focus the more important broadening topping process I addressed last week.
“Furthermore, on a longer-term basis, the market continues within a “broadening topping process” or a “megaphone”pattern. While these patterns do not always come to fruition, the fact this one is combined with a dual sell-signals only registered prior to the financial crisis does provide some cause for concern.”
Importantly, for now, the bulls clearly remain in charge of the market. Regardless of the news, it seems as if the market simply will not go down.
I get it.
I understand it.
But, don’t get trapped by it.
Take a look at the chart below.
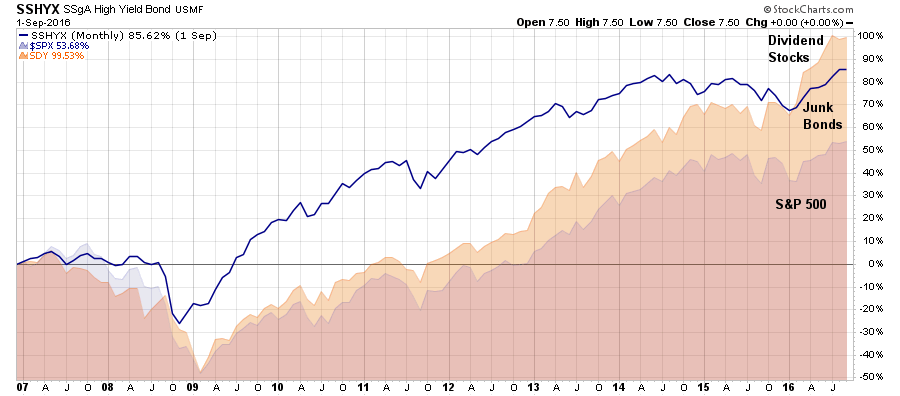
The chase for yield has pushed relative performance of dividend yielding investments will above that of the overall market. Does this at all seem like a normal thing that should be happening? The “chase low volatility/safe haven assets” is very likely the bubble that will be identified in hindsight.
As pointed out by Paul Winter of UBS just recently:
“Secondly, low volatility equities are trading at significantly higher multiples relative to the market. Importantly, whilst low volatility stocks appear to be trading on a premium to their own history, it should also be noted that these stocks make up a significant proportion of the market by weight.”
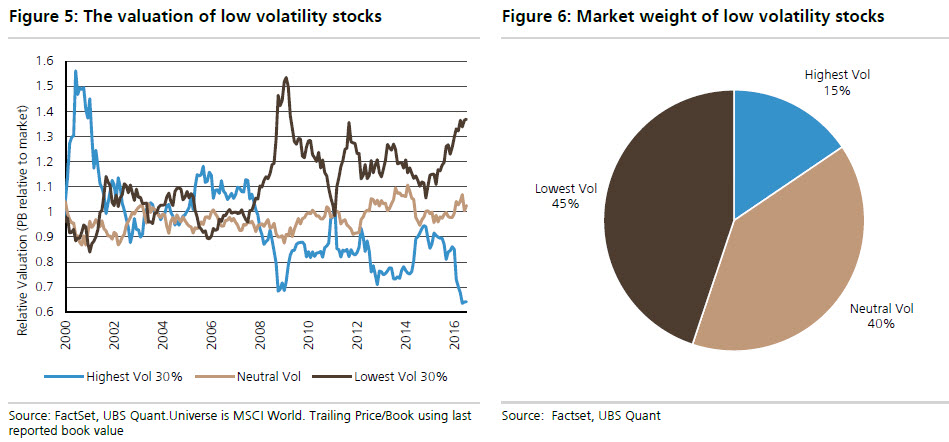
“Low volatility deciles 1, 2 and 3 make up approximately 45% of the market by market capitalization. As a result, the overvaluation of low volatility stocks is significantly contributing to the valuation of the market as a whole.
These stocks tend to have higher levels of gearing and whilst they have a low beta to equity markets (Figure 7), they carry a higher residual beta to credit markets (Figure 8).”
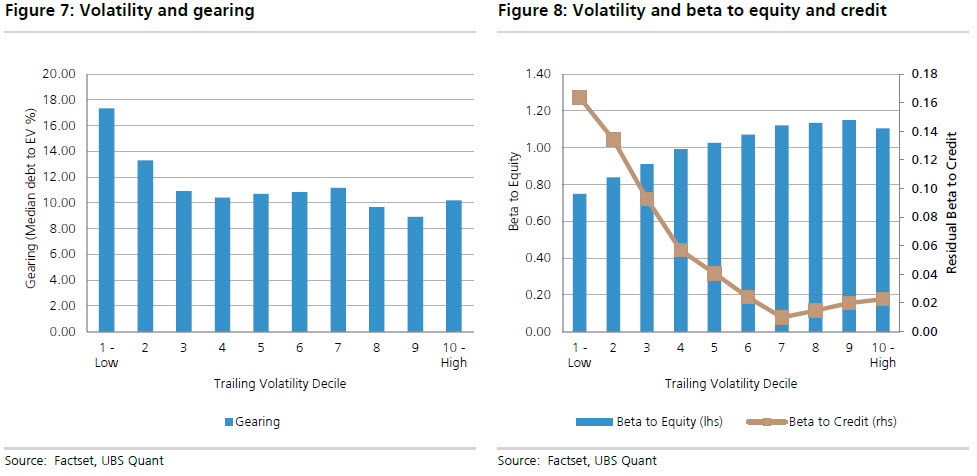
“If this is indeed the end of the credit cycle, we believe these stocks are likely to under perform.”
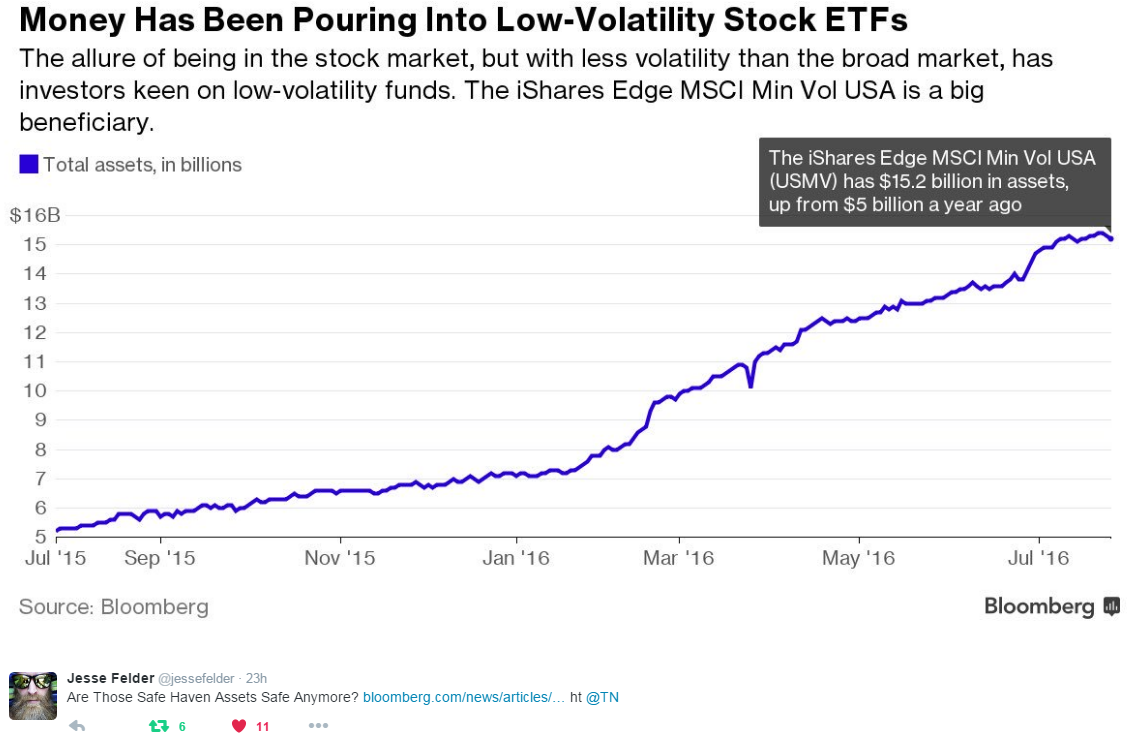
When investors have little, or no, fear of losing money in the market they begin to seek the things with the greatest returns. Over the last few years the chase for yield, due to the Fed’s consistent push to suppress interest rates, has driven investors into taking on additional credit risk to increase incomes. That same yield chase has manifested itself also in a massive outperformance of “dividend yielding stocks” over the broad market index as shown above.
The chart shows investors are rapidly taking on excessive credit risk which is driving down yields in bonds and pushing up valuations in traditionally mature companies into stratospheric valuations. As noted recently by Jesse Felder during historic market corrections, money has traditionally hidden in “safe assets.”
This time, such a rotation may be the equivalent of jumping from the “frying pan into the fire.”
Are Those Safe Haven Assets Safe Anymore? https://t.co/sauqge6ufl ht @TN pic.twitter.com/eWtFvp1f9H
Lack Of Fear
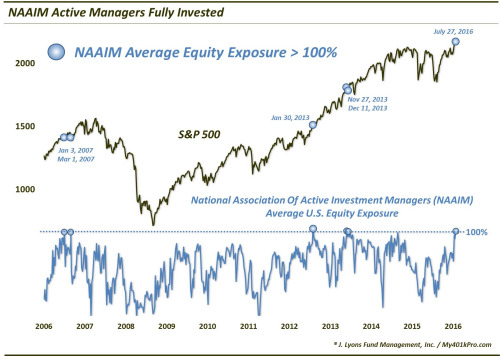
The downfall of all investors is ultimately “greed.” Greed can be measured a couple of ways. The first, as noted by Dana Lyons recently, is the allocation to equities. Historically, this has been a good measure of the “risk appetite”of investors.
“That said, regardless of the investment acumen of any group (we think it is very high among NAAIM members),once the collective investment opinion or posture becomes too one-sided, it can be an indication that some market action may be necessary to correct such consensus. As we mentioned, that may indeed be the case with the NAAIM Exposure Index, as last week’s survey indicated an average of over 100% exposure to U.S. equities by its respondents. That is just the 6th reading over 100% in the survey’s 10-year history.”
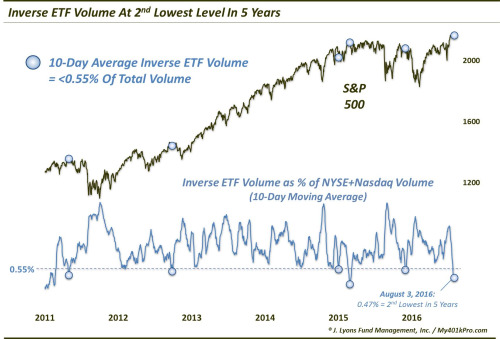
But beyond just the “need for greed,” investors have been lulled into a deep sense of complacency. Not surprisingly, the volume of bearish ETF’s is almost non-existent. To wit:
“Contrary to the track record following the elevated NAAIM readings, prior low levels of inverse ETF volume in the past 5 years have marked stock market drawdowns of various magnitudes. Now, as the market climate has been extremely positive overall during the past 5 years, the drawdowns were not necessarily long lasting. However, there was consistent weakness, at least in the months following such complacent readings.”
Importantly, the amount of leverage investors are taking on is further confirmation of the presence of “greed” and “lack of fear.” The chart below is the amount of investor’s relative positive or negative net credit balances as compared to the index itself.
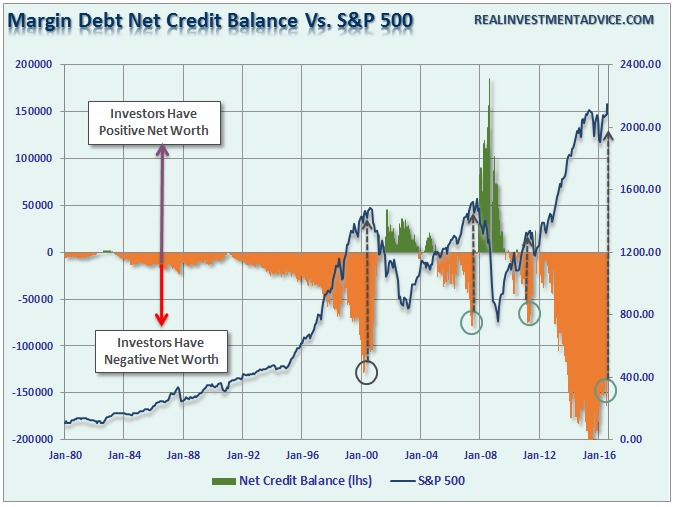
While margin debt and negative net credit balances have been reduced mildly since the beginning of the year, we are still at levels not seen since the peak of the last cyclical bull market cycle. This should raise some concerns about sustainability currently. It is the unwinding of this leverage that is critically dangerous in the market as the acceleration of “margin calls” lead to a vicious downward spiral. While this does not mean that a massive market correction is imminent – it does suggest that leverage, and speculative risk taking, are likely much further along than currently recognized. Importantly, it is when “greed” turns back into “fear” that margin debt really matters.
Pushing Extremes
Prices are ultimately affected by physics. Moving averages, trend lines, etc. all exert a gravitational pull on prices in both the short and long-term. Like a rubber-band, when prices are stretched too far in one direction, they tend to snap back quickly. It is these reversions, both short and long-term, that generally take investors by surprise because they happen so quickly.
The current deviation of over 7.5% from the long-term trend line is one of the larger in recent history. This deviation also comes at a time when long-term MACD and Momentum measures are on important “sell signals.” Such a combination has not turned out well for investors in the past.
But this time could be different? Right?
As hinted at above, the ongoing monetary actions by global Central banks has created a “Pavlovian” response in the markets. When Central Banks ring the proverbial “bell,” investors have rushed to buy in some of the most speculative areas of the market under the assumption they will always be bailed out. However, such is unlikely to always be the case and the massive increase in speculative risks, combined with excess leverage, leave the markets vulnerable to a sizable correction at some point in the future.
The only missing ingredient for such a correction currently is simply a catalyst to put “fear” into an overly complacent marketplace. There is currently no shortage of catalysts to pick from an economic disruption, another Eurozone related crisis, or an unexpected shock from an area yet to be on our radar such as the recent bankruptcy of Hanjin Shipping last week.
“U.S. retailers, bracing for a blow as they stock up for the crucial holiday sales season, asked the government to step in and help resolve a growing crisis caused by the near-collapse of South Korea’s Hanjin Shipping Co., one of the world’s largest container shipping companies.
Hanjin handles about 7.8% of the trans-Pacific trade volume for the U.S. market, Ms. Kennedy’s letter said. Since the shipping company filed for bankruptcy protection in a Seoul court Wednesday, terminal operators, ports, cargo handlers, truckers and others have refused to handle its cargo, for fear they won’t get paid. That is causing turmoil at U.S. ports and beyond, said shippers, importers, and freight forwarders.”
And there’s your next reason for faltering retail sales and weak corporate profits.
One more chart from David:

In the long term, it will ultimately be the fundamentals that drive the markets. Currently, the deterioration in the growth rate of earnings, and economic strength, are not supportive of the speculative rise in asset prices or leverage.
The chart below is simply a quarterly chart of the S&P overlaid against valuations and technical extremes. See the problem here?
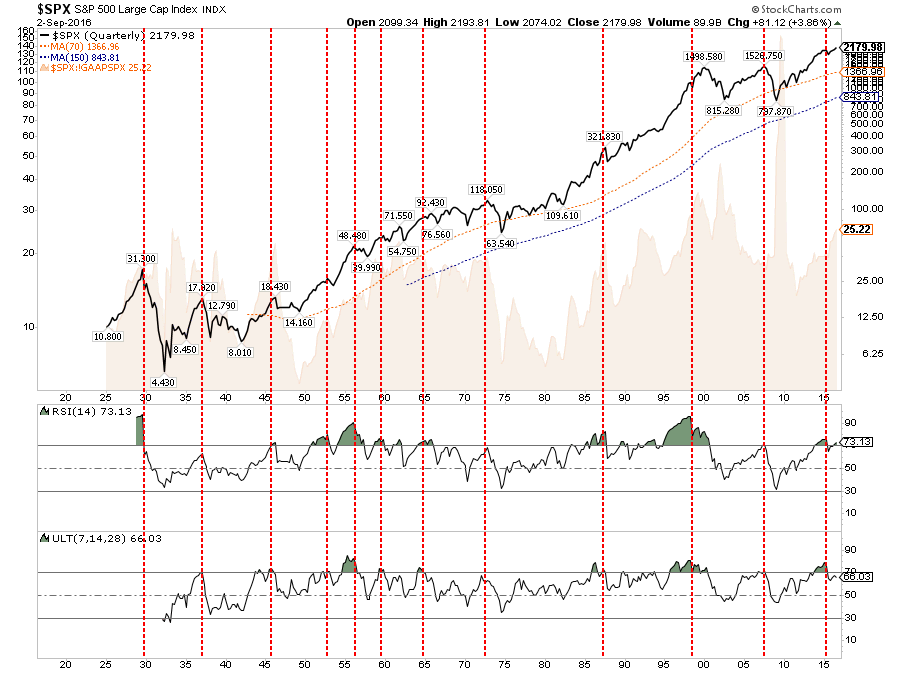
The idea of whether, or not, the Federal Reserve, along with virtually every other central bank in the world, are inflating the next asset bubble is of significant importance to investors who can ill afford to once again lose a large chunk of their net worth.
It is all reminiscent of the market peak of 1929 when Dr. Irving Fisher uttered his now famous words:
“Stocks have now reached a permanently high plateau.”
They weren’t and it wasn’t.


