Written by Lance Roberts, Clarity Financial
3 Signs Of Excess Bullishness
I have written over the last several weeks that despite much mainstream media commentary to the contrary, actual “bullishness” in the market was hitting extremes.

Here are 3-signs:
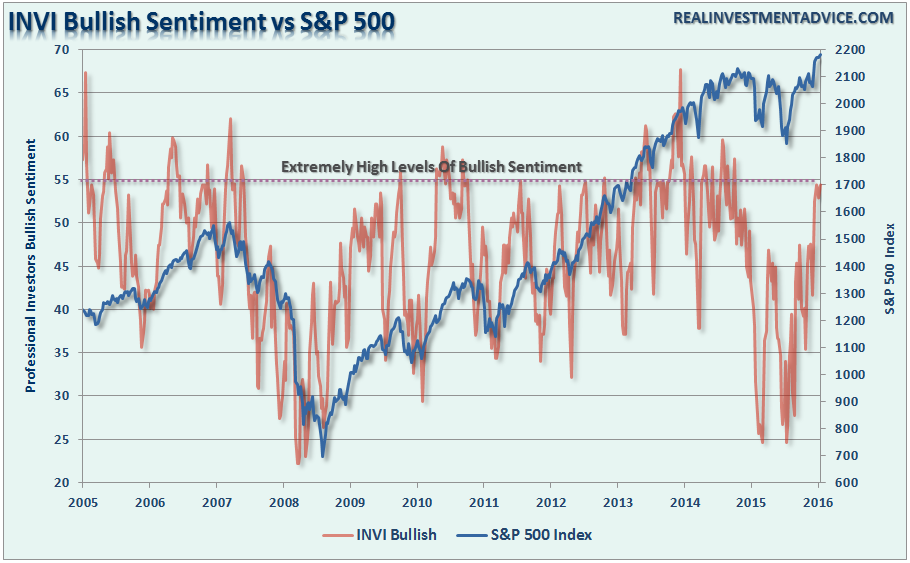
With professional investors, as represented by the IINV Sentiment Survey, pushing more exuberant levels of bullishness the potential for a short-term reversal in the markets is more than elevated.
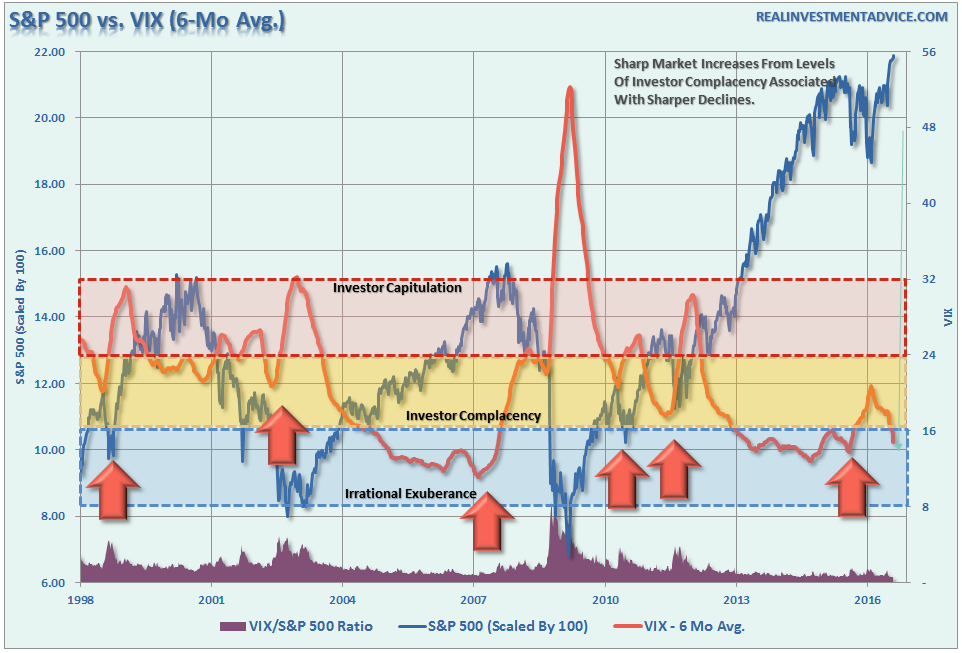
The chart below shows the S&P 500 as compared to the level of volatility as represented by the 6-month average of the Volatility Index (VIX). I have provided three different bands showing levels of investor sentiment as it relates to volatility. Not surprisingly, as markets ping new highs, volatility is headed towards new lows.
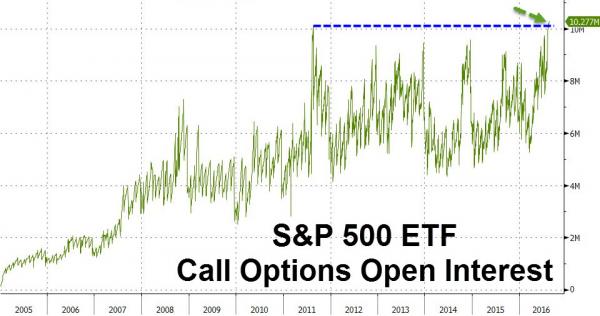
The open interest in S&P 500 ETF (SPY) call options has never been higher as the last few days panic-buying leveraged long positions lifted exposure above summer 2011 highs…The last time SPY call option open interest was this high, S&P 500 tumbled 20% in 2 months amid the US downgrade…The level of bullish bets that the SPDR S&P 500 exchange-traded fund will rise reached a record this month and hit the highest level since January relative to bearish options. (h/t ZeroHedge)
With speculative positioning in VIX futures at record shorts (most bullish), professional investors extremely bullish, and speculative longs in Dow and Nasdaq at or near record highs, the question seems to not be “IF” if a correction will happen, just “WHEN.”
Oil Back To Extremes
Two week’s ago I asked the question “Is This The Bottom For Oil Prices?”

“The current deviation between the S&P 500 and oil contracts will likely not last long. Either the S&P 500 is due for a more meaningful correction, as discussed above, or there is about to be a rapid rise in oil prices.”
The latter happened to oil prices over the last two week’s as it rebound sharply from extreme oversold to overbought conditions. As shown below, oil sold off to minor support which was 3-standard deviations below the short-term moving average. The good news is the bounce held support and has now pushed oil prices back into extreme overbought territory.
While potential upside on oil could be as high as $52/bbl, the more likely outcome is a correction that would coincide with a rebound in the dollar as I will address momentarily. As shown below, oil prices are now as overbought as they have been since the peak in 2013. Watch the bottom indicator for an important sell signal WHEN it occurs.
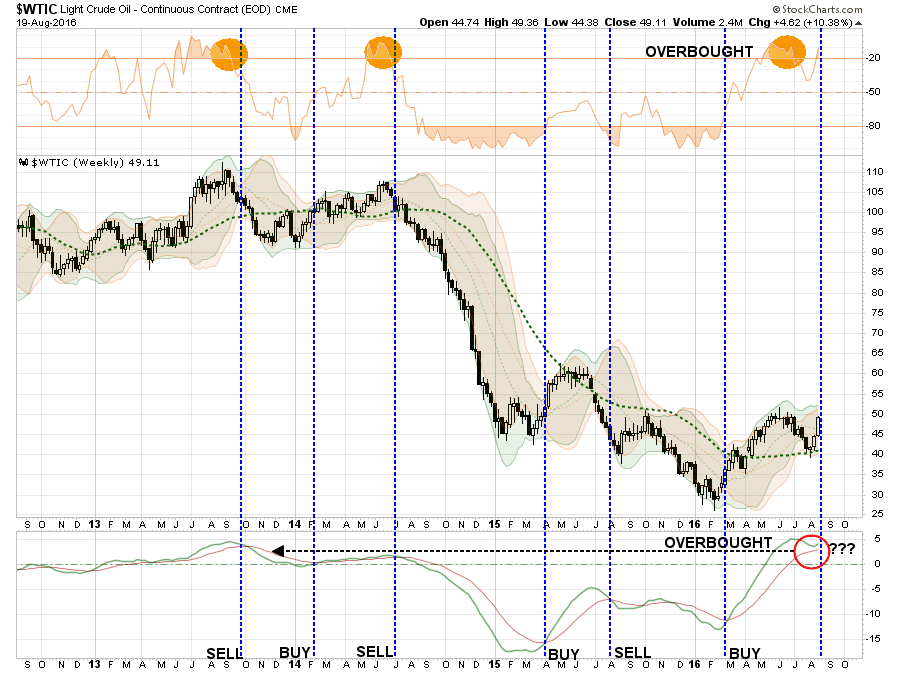
Currently, the number of net reportable contracts remains heavily biased to the long side. If oil prices break to the downside you should expect to see a rather rapid unwinding of contracts, and subsequently oil prices, to lower levels. I would suspect that my long-term target of $30-35/bbl will prove very realistic.
US Dollar Correction Likely Over
I wrote at the beginning of July the rise in the dollar would likely to continue which would suppress both oil prices AND earnings. As noted:
“While earnings are set to decline again this quarter which will push valuations even further into the proverbial stratosphere, the real risk to watch is the US Dollar. While Central Banks have gone all in, including the BOJ with additional QE measures of $100 billion, to bail out financial markets and banks following the “Brexit” referendum, it could backfire badly if the US dollar rises from foreign inflows. As shown below, a stronger dollar will provide another headwind to already weak earnings and oil prices in the months ahead which could put a damper on the expected year-end “hockey stick” recovery currently expected. “
Unlike the stock market which is pushing extreme overbought levels, the dollar is at an extreme oversold condition and has only started a potential longer-term move higher. This is something to pay very close attention to in the months ahead.
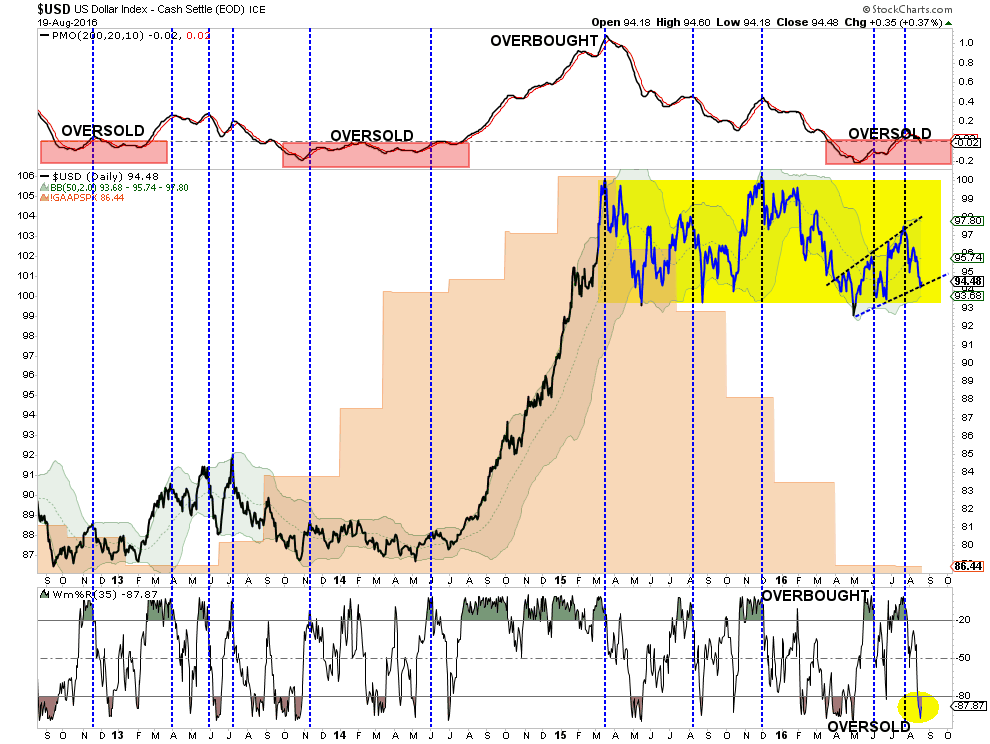
As noted, with interest rates negative in many areas of the world, the push of capital into the U.S. for a higher return on reserves is very likely. A further strengthening of the dollar will have a deleterious effect on oil prices, emerging markets, and corporate profitability. The net positive will be further inflows into U.S. bonds.
The bottom line is there is a wicked setup being developed that could lead to a rapid destruction of capital if something “goes wrong” in the weeks or months ahead. With the risk/reward ratio very negative currently, caution is highly advised.
Model Update
S.A.R.M. Sector Analysis & Weighting
Not surprisingly, given the lack of direction or resolution of the current overbought condition, the portfolio equity risk weighting remains at 50% again this week. However, as stated above, this allocation will increase to 75% given the appropriate correction of the overbought condition. With all buy signals currently in place, and the bullish trend intact, this is not a market to bet heavily against…for now. However, it is also not a market to become extremely complacent in either.
Again, we must be given the right “set up” to increase equity allocations. Begin by “averaging up” in existing holdings to match model allocation and weights. When, and IF, the market confirms the continuation of the “bullish trend,” then begin adding new holdings to the model.
(Note: This is an equally weighted model example and may differ from discussions of overweighting/underweighting specific sectors or holdings.)

Relative performance of each sector of the model as compared to the S&P 500 is shown below. The table compares each position in the model relative to the benchmark over a 1, 4, 12, 24 and 52-week basis.
Historically speaking, sectors that are leading the markets higher continue to do so in the short-term and vice-versa. The relative improvement or weakness of each sector relative to index over time can show where money is flowing into and out of. Normally, these performance changes signal a change that last several weeks.
The fall in the US Dollar over the last could of weeks has boosted the performance of the energy, materials, and industrial sectors of the market. However, as stated above, we have likely gotten the majority of that advance already locked in so profit taking is likely wise.
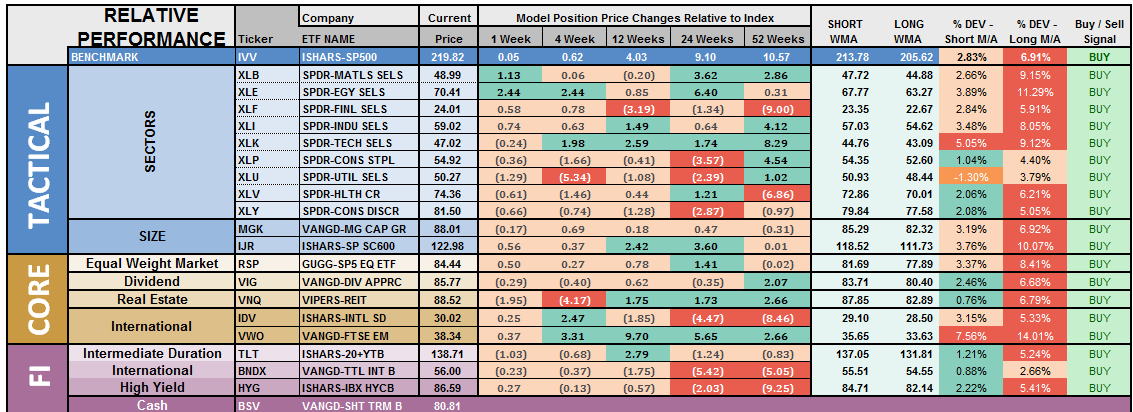
Notice in the next to last column to the right, the majority of all sectors and indices are pushing extreme levels of deviation from their long-term moving average. Such deviations can not, and do not, last long historically. A resolution of those deviations, which will occur during a corrective action, will provide the necessary risk/reward rebalancing to increase model allocations.
The two charts below graphically show the relationship of each position’s performance relative to the S&P 500 Index. If we are trying to “beat the index” over time, we want to overweight sectors/asset classes that are either improving in performance or outperforming the index, and underweight or exclude everything else.
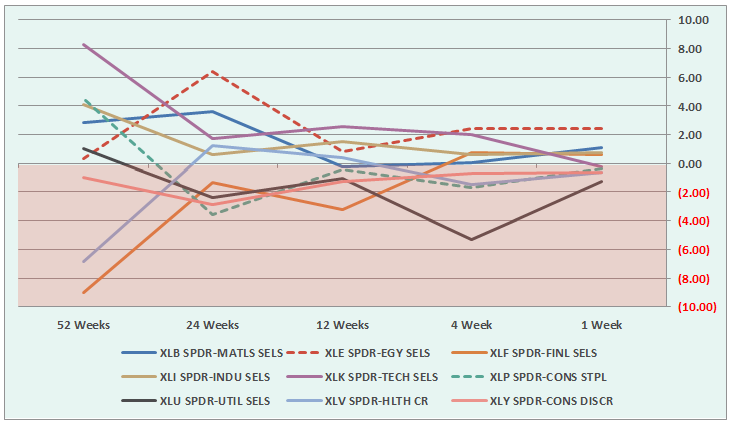
Sectors Currently Outperforming by >1%
Energy
Materials
Sectors Currently Performing In Line <>1%
Industrials
Staples
Technology
Financial
Discretionary
Healthcare
Sectors Currently Under Performing By >1%
Utilities
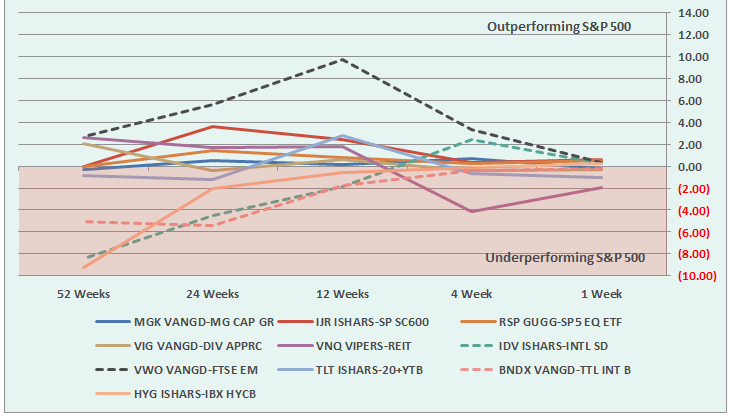
Index/Other Asset Classes Out Performing S&P 500 By >1%
None
Index/Other Asset Classes Performing In-Line With S&P 500 <>1%
Mid-Caps
Small-Caps
Equal-Weight S&P 500
International Bonds
High-Yield Bonds
Dividend Stocks
Emerging Markets
International Stocks
Index/Other Asset Classes Under Performing S&P 500 By >1%
Bonds
REIT’s
The risk-adjusted equally weighted model has been increased to 75%. However, as stated above, a pullback in the markets is needed before making any changes.
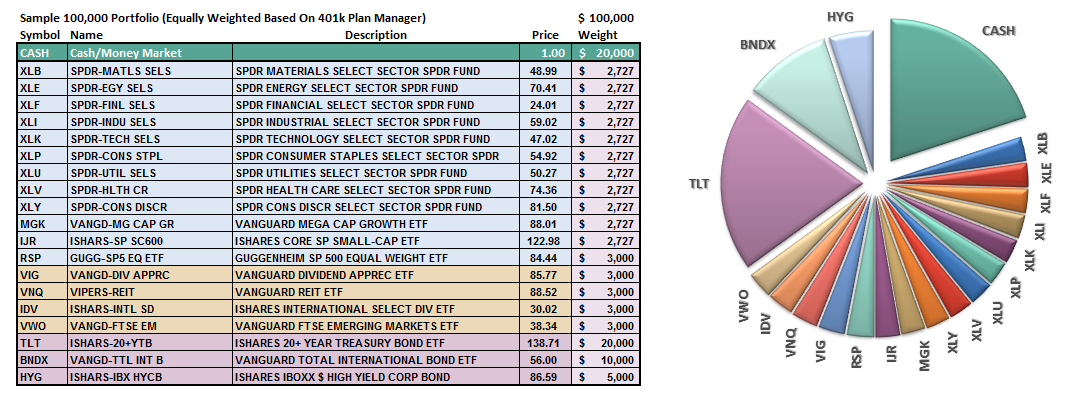
Such an increase will change model allocations to:
20% Cash
35% Bonds
45% in Equities.
As always, this is just a guide, not a recommendation. It is completely OKAY if your current allocation to cash is different based on your personal risk tolerance, time frames, and goals.
For longer-term investors, we still need to see improvement in the fundamental and economic backdrop to support the resumption of a long-term bullish trend. Currently, there is no evidence of that occurring.


