Written by Lance Roberts, Clarity Financial
Bonds Bid
Last week, I stated:
“With rates now pushing on the long-term downtrend line, I am now looking for weakness in the bond market to add to existing fixed income holdings for the next decline in rates.”

This past week, rates reversed from the downtrend line as suspected as stocks struggled last week to gain ground. I have updated the chart from last week below:
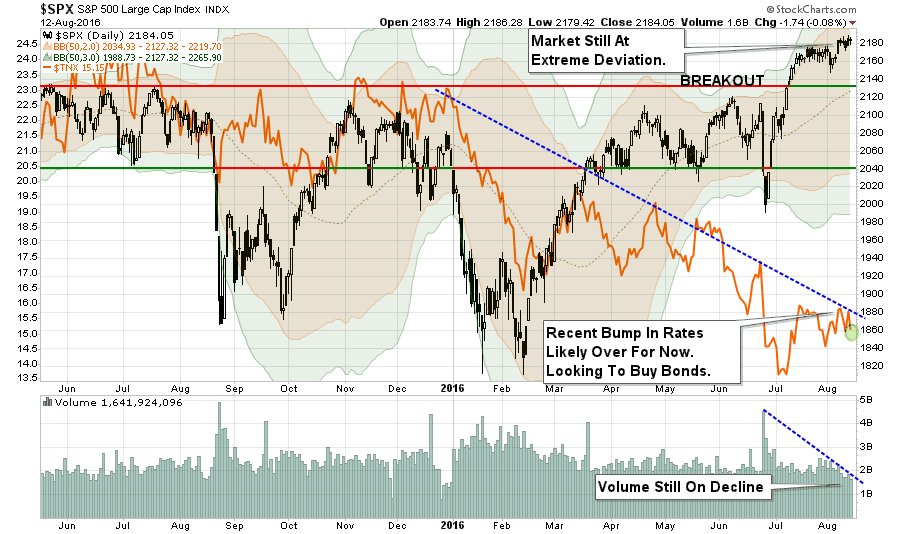
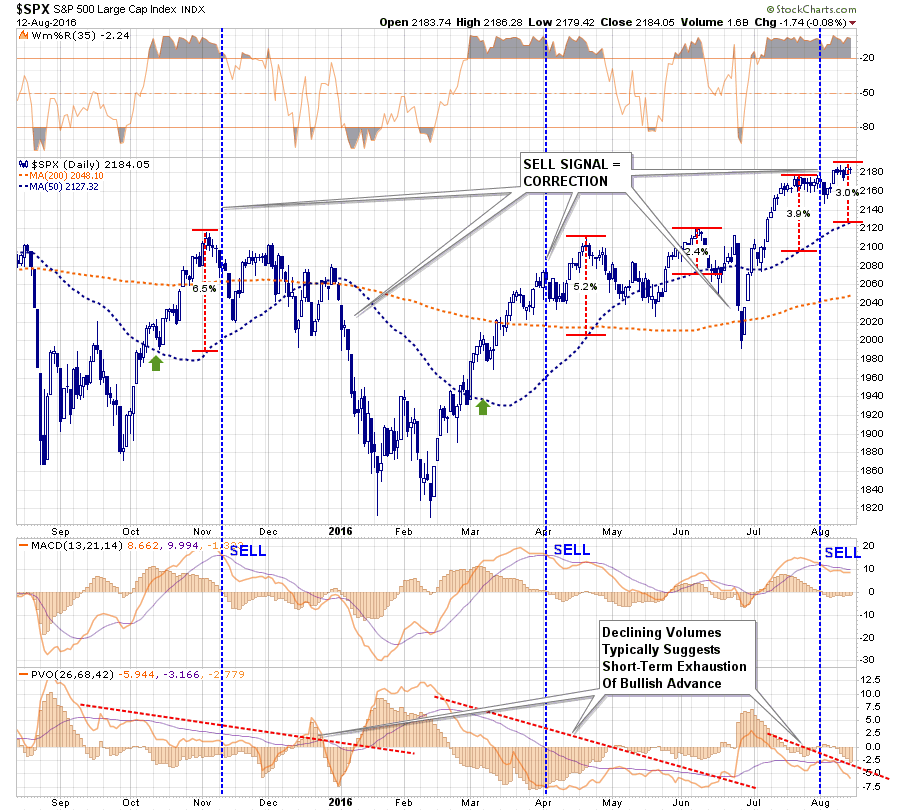
My best guess remains, as stated in the main body of this missive, is that a corrective action happens over the next few days to weeks. As shown in the chart below, the current deviation from the 50-dma combined with an excessively overbought condition, a sell signal, and declining volume has previously led to corrections. Sure, this time could be different, but I am not willing to bet my clients money on that.
Such a correction will pull money out of equities as the quest for “risk” reverses into a search for “safety.” That shift will likely push rates back towards recent lows. Therefore, I still think adding to current bond exposure at these levels makes sense…for now.
Model Update
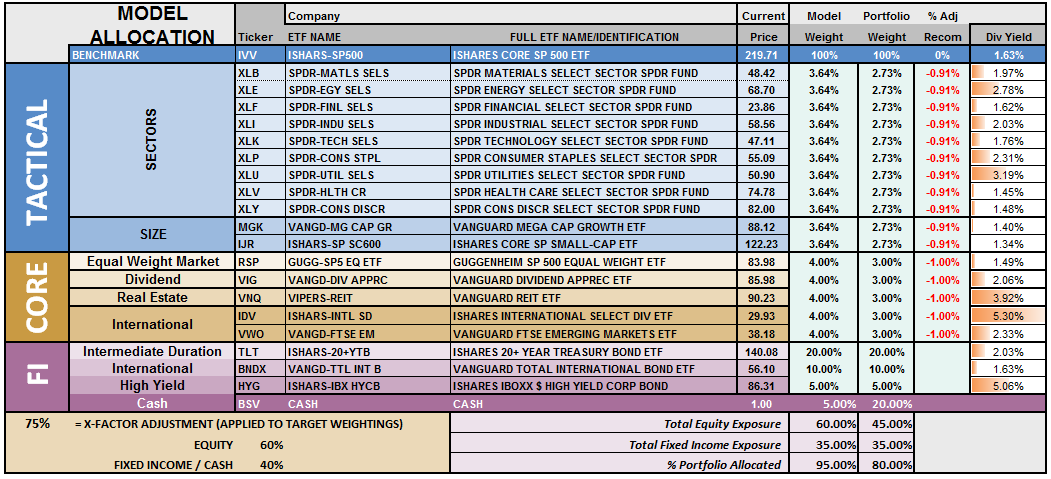
S.A.R.M. Sector Analysis & Weighting
Not surprisingly, given the lack of direction or resolution of the current overbought condition, the portfolio equity risk weighting remains at 50% again this week. However, as stated above, this allocation will increase to 75% given the appropriate correction of the overbought condition. With all buy signals currently in place, and the bullish trend intact, this is not a market to bet heavily against…for now. However, it is also not a market to become extremely complacent in either.
Again, we must be given the right “set up” to increase equity allocations. Begin by “averaging up” in existing holdings to match model allocation and weights. When, and IF, the market confirms the continuation of the “bullish trend,” then begin adding new holdings to the model.
(Note: This is an equally weighted model example and may differ from discussions of overweighting/underweighting specific sectors or holdings.)
Relative performance of each sector of the model as compared to the S&P 500 is shown below. The table compares each position in the model relative to the benchmark over a 1, 4, 12, 24 and 52-week basis.
Historically speaking, sectors that are leading the markets higher continue to do so in the short-term and vice-versa. The relative improvement or weakness of each sector relative to index over time can show where money is flowing into and out of. Normally, these performance changes signal a change that last several weeks.
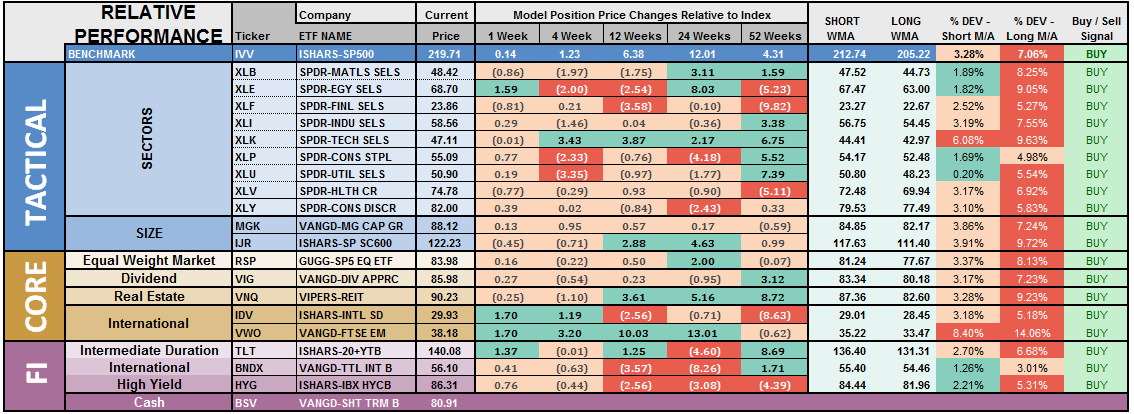
Notice in the next to last column to the right, the majority of all sectors and indices are pushing extreme levels of deviation from their long-term moving average. Such deviations can not, and do not, last long historically. A resolution of those deviations, which will occur during a corrective action, will provide the necessary risk/reward rebalancing to increase model allocations.
The two charts below graphically show the relationship of each position’s performance relative to the S&P 500 Index. If we are trying to “beat the index” over time, we want to overweight sectors/asset classes that are either improving in performance or outperforming the index, and underweight or exclude everything else.
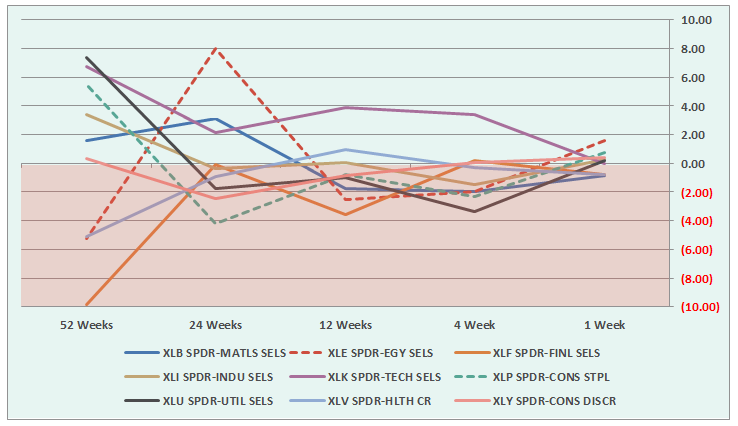
Sectors Currently Outperforming by >1%
Energy
Sectors Currently Performing In Line <>1%
Industrials
Staples
Technology
Financial
Utilities
Sectors Currently Under Performing By >1%
Healthcare
Discretionary
Materials
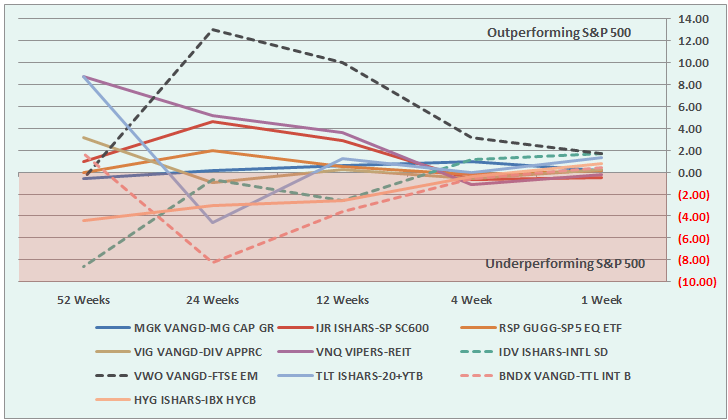
Index/Other Asset Classes Out Performing S&P 500 By >1%
Emerging Markets (but notice deterioration in relative performance)
International Stocks
Bonds (moved into lead following last week’s recommendation)
Index/Other Asset Classes Performing In-Line With S&P 500 <>1%
Mid-Caps
Small-Caps
Equal-Weight S&P 500
International Bonds
High-Yield Bonds
Dividend Stocks
REIT’s
Index/Other Asset Classes Under Performing S&P 500 By >1%
None
The risk-adjusted equally weighted model has been increased to 75%. However, as stated above, a pullback in the markets is needed before making any changes.
Such an increase will change model allocations to:
20% Cash
35% Bonds
45% in Equities.
As always, this is just a guide, not a recommendation. It is completely OKAY if your current allocation to cash is different based on your personal risk tolerance, time frames, and goals.
For longer-term investors, we still need to see improvement in the fundamental and economic backdrop to support the resumption of a long-term bullish trend. Currently, there is no evidence of that occurring.
THE REAL 401k PLAN MANAGER
The Real 401k Plan Manager – A Conservative Strategy For Long-Term Investors
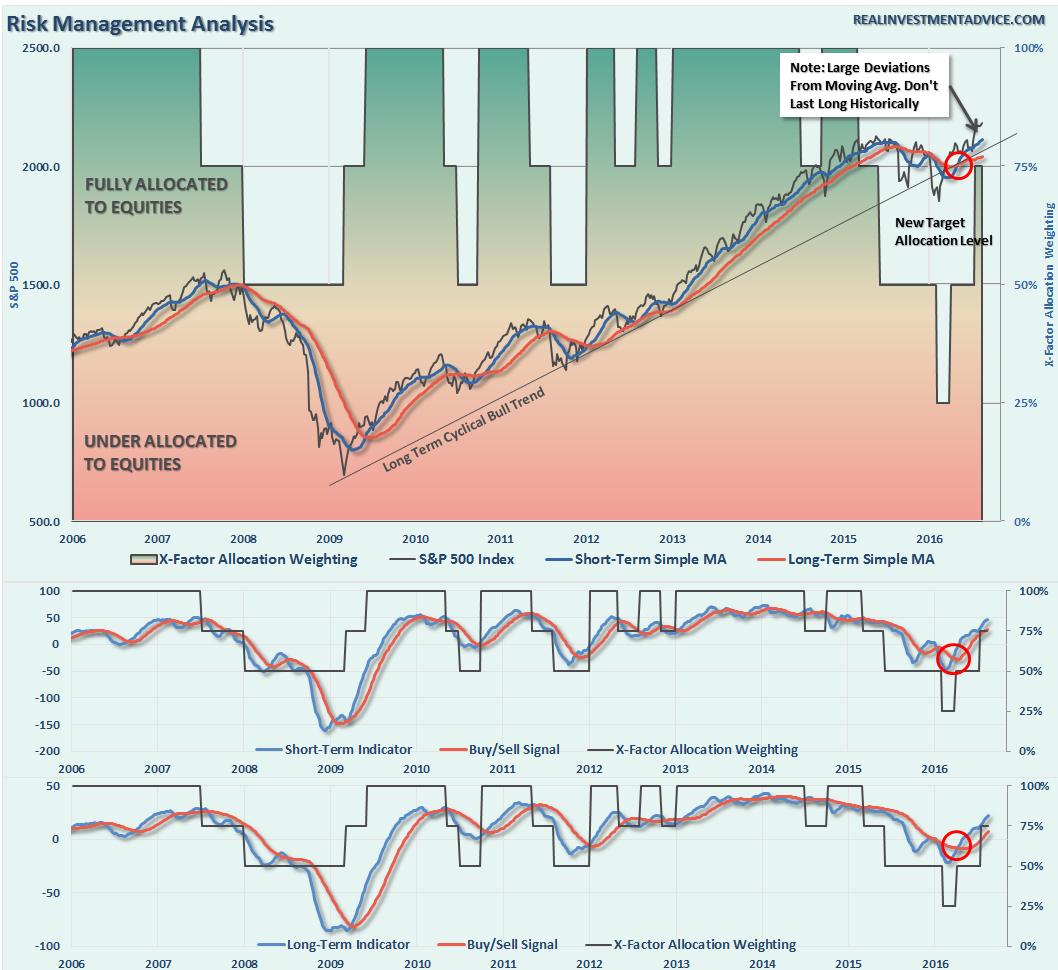
NOTE: I have redesigned the 401k plan manager to accurately reflect the changes in the allocation model over time. I have overlaid the actual model changes on top of the indicators to reflect the timing of the changes relative to the signals.
There are 4-steps to allocation changes based on 25% reduction increments. As noted in the chart above a 100% allocation level is equal to 60% stocks. I never advocate being 100% out of the market as it is far too difficult to reverse course when the market changes from a negative to a positive trend. Emotions keep us from taking the correct action.

Risk Remains – So Does The Message
As I noted over the last couple of weeks:
“With the technical underpinnings still bullishly biased at the moment, we are now in the position to increase equity allocations over the next couple of weeks.
However, as is always the case, by the time markets makes a significant technical change, prices are generally at an extreme overbought or oversold condition. This is the case currently with the recent breakout which has created an extreme overbought condition in the short term.”
And…again…we are still waiting.
I know. It’s boring. We all want to “DO SOMETHING.”
But that is simply emotion working on you. In investing, sometimes the best thing “TO DO” is to “DO NOTHING.” This is where having the patience to wait for the “fat pitch” becomes much more difficult, but more often than not, provides the best results.
As discussed at length in the above missive, we certainly want to prepare ourselves to increase equity exposure in portfolios, however, we must patiently wait for the right conditions to apply those increases. Furthermore, while waiting for the relaxation of prices to make more prudent entries, it also enables investors to bypass potential “head fakes” of market actions.
Review the allocation model adjustments below
Identify the next course of actions in your 401k-plan
Wait to make adjustments until technical conditions improve.
Change allocations to target levels when conditions are right.
If you need help after reading the alert; don’t hesitate to contact me.
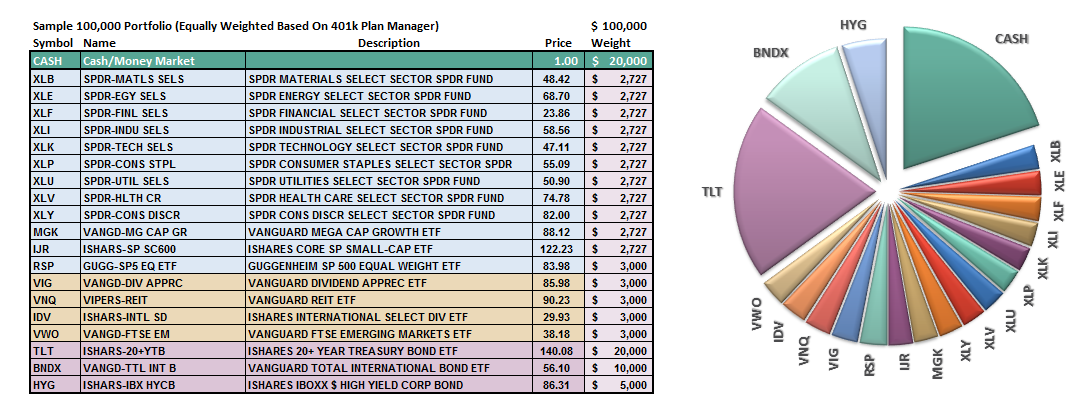
Current 401-k Allocation Model
The 401k plan allocation plan below follows the K.I.S.S. principal. By keeping the allocation extremely simplified it allows for better control of the allocation and a closer tracking to the benchmark objective over time. (If you want to make it more complicated you can, however, statistics show that simply adding more funds does not increase performance to any great degree.)

401k Choice Matching List
The list below shows sample 401k plan funds for each major category. In reality, the majority of funds all track their indices fairly closely. Therefore, if you don’t see your exact fund listed, look for a fund that is similar in nature.


