Written by Lance Roberts, Clarity Financial
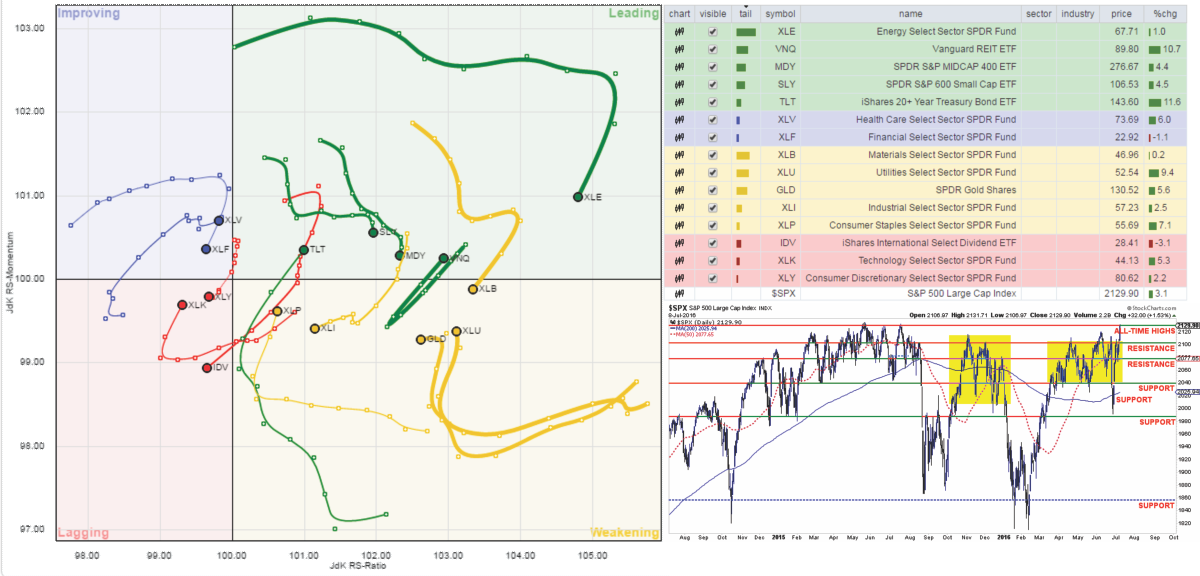
S.A.R.M. Model Allocation
The Sector Allocation Rotation Model (SARM) is an example of a basic well-diversified portfolio. The purpose of the model is to look “under the hood” of a portfolio to see what parts of the engine are driving returns versus detracting from it. From this analysis, we can then determine where to overweight sectors which are leading performance, reduce in areas lagging, and eliminate those areas that are dragging.

This past week’s volatility didn’t change the backdrop of the market much. However, it is worth noting that the leadership of energy, basic materials, small and mid-cap is fading along with the relative performance of healthcare and financials. Somewhat surprisingly, given the rally in the market last week, Bonds and REITs surged to leadership positions in the market. Not something that should have happened.
The sector recommendations over the last three weeks, shown below, have paid off handsomely over the last couple of weeks. This week follow the sector recommendations above in the main body of this missive.
S.A.R.M. Sector Analysis & Weighting
The current risk weighting remains at 50% this week.
While the market did push above resistance, a sustained breakout through next week is required to confirm that advance. As I stated last week:
“With technical underpinnings still ‘bullishly biased,’ we want to give the markets the benefit of the doubt for now.”
However, despite the rally, the longer term technical underpinnings still remain weak so caution is still necessary for now.
Relative performance of each sector of the model as compared to the S&P 500 is shown below. The table compares each position in the model relative to the benchmark over a 1, 4, 12, 24 and 52-week basis.
Historically speaking, sectors that are leading the markets higher continue to do so in the short-term and vice-versa. The relative improvement or weakness of each sector relative to index over time can show where money is flowing into and out of. Normally, these performance changes signal a change that last several weeks.
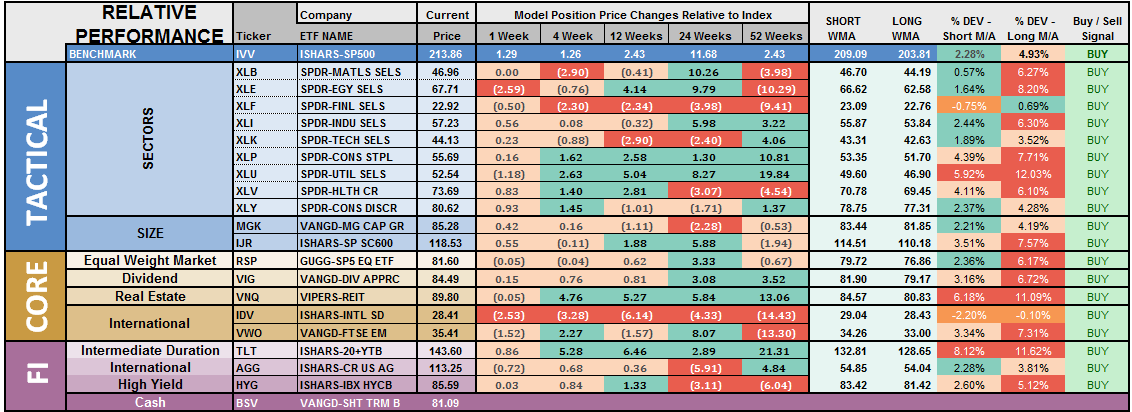
The last column is a sector specific “buy/sell” signal which is simply when the short-term weekly moving average has crossed above or below the long-term weekly average. The number of sectors on “buy signals” has improved from just 2 a few weeks ago to 19 this past week.
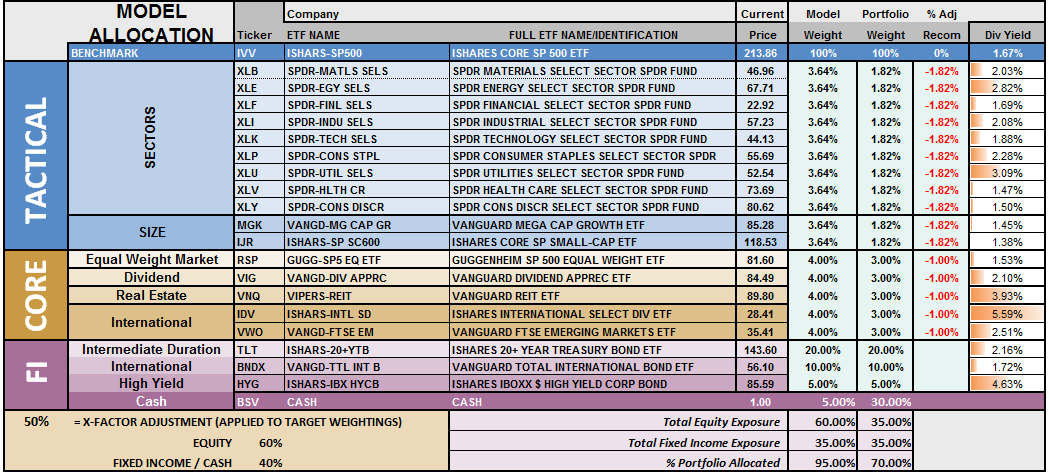
The risk-adjusted equally weighted model remains from last week. No changes this week.
The portfolio model remains at 35% Cash, 35% Bonds, and 30% in Equities.
As always, this is just a guide, not a recommendation. It is completely OKAY if your current allocation to cash is different based on your personal risk tolerance, time frames, and goals.
For longer-term investors, we need to see an improvement in the fundamental and economic backdrop to support a resumption of the bullish trend. Currently, there is no evidence of that occurring.
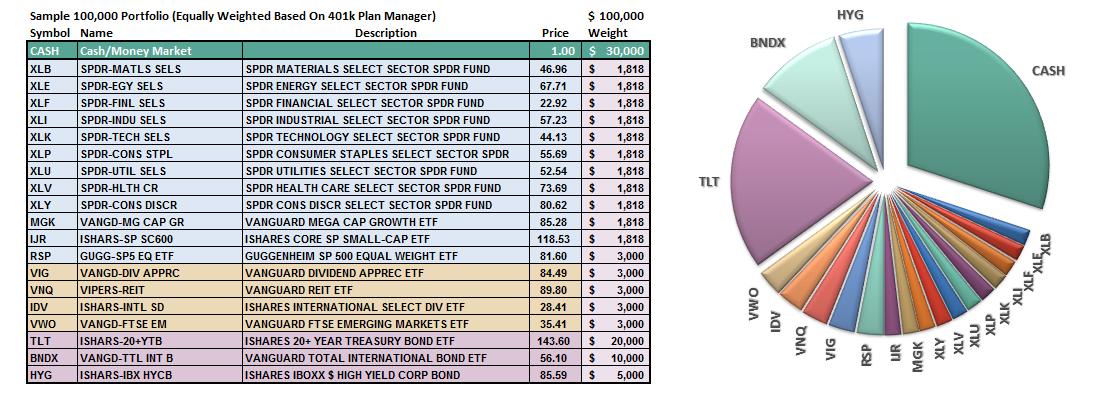
THE REAL 401k PLAN MANAGER
The Real 401k Plan Manager – A Conservative Strategy For Long-Term Investors
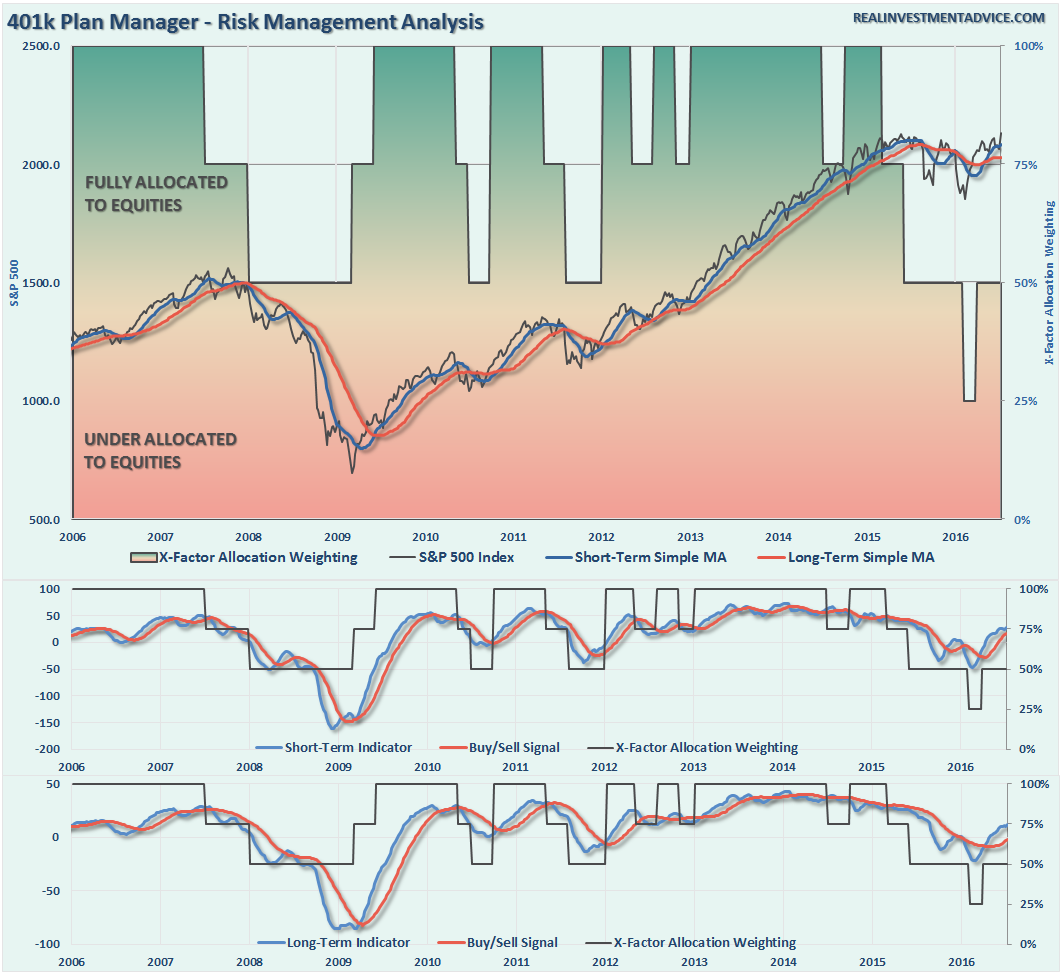
NOTE: I have redesigned the 401k plan manager to accurately reflect the changes in the allocation model over time. I have overlaid the actual model changes on top of the indicators to reflect the timing of the changes relative to the signals.
There are 4-steps to allocation changes based on 25% reduction increments. As noted in the chart above a 100% allocation level is equal to 60% stocks. I never advocate being 100% out of the market as it is far too difficult to reverse course when the market changes from a negative to a positive trend. Emotions keep us from taking the correct action.

Breakout? Waiting For Confirmation
As I discussed last week, the fear of “Brexit” related impacts sent Central Banks into overdrive to push asset prices higher. As noted repeatedly above, while the market did break above resistance we need to wait for confirmation through the end of next week.
With the technical underpinnings still bullishly biased at the moment, we are now in the position to increase equity allocations over the next couple of weeks.
However, while I make that statement, it is also important to realize the fundamental and economic dynamics still tilt long-term risk/reward ratios out of favor. But, as investors, we must capitalize on trends should such trends return to a positive basis.
For longer-term investors, the markets have made virtually no progress since January of 2015. Therefore, there is little evidence to suggest stepping away from a more cautionary allocation…for now but that could be changing.
Patience for one more week.
If you need help after reading the alert; don’t hesitate to contact me.
Current 401-k Allocation Model
The 401k plan allocation plan below follows the K.I.S.S. principal. By keeping the allocation extremely simplified it allows for better control of the allocation and a closer tracking to the benchmark objective over time. (If you want to make it more complicated you can, however, statistics show that simply adding more funds does not increase performance to any great degree.)

401k Choice Matching List
The list below shows sample 401k plan funds for each major category. In reality, the majority of funds all track their indices fairly closely. Therefore, if you don’t see your exact fund listed, look for a fund that is similar in nature.


