Written by Lance Roberts, Clarity Financial
BEWARE AUGUST
Art Cashin delivered some great comments on CNBC stating:
“Not at all, I think the only thing I heard from him was a mild frustration that they couldn’t get things going. The market is more powerful than the Fed, that’s the problem.“

Of course, it was Sandy Jadeja, a technical analyst and chief market strategist at Core Spreads, that caught my attention just recently. He predicted that we are in for some big bumps on the road to 2018.
“We are currently in a very dangerous time zone between 2011 until 2018. This is an 84-year cycle [called the ‘Time Cycle’] and the previous cycle appeared during 1928 until 1934 where the Great Depression took place.”
Take a look at this chart:
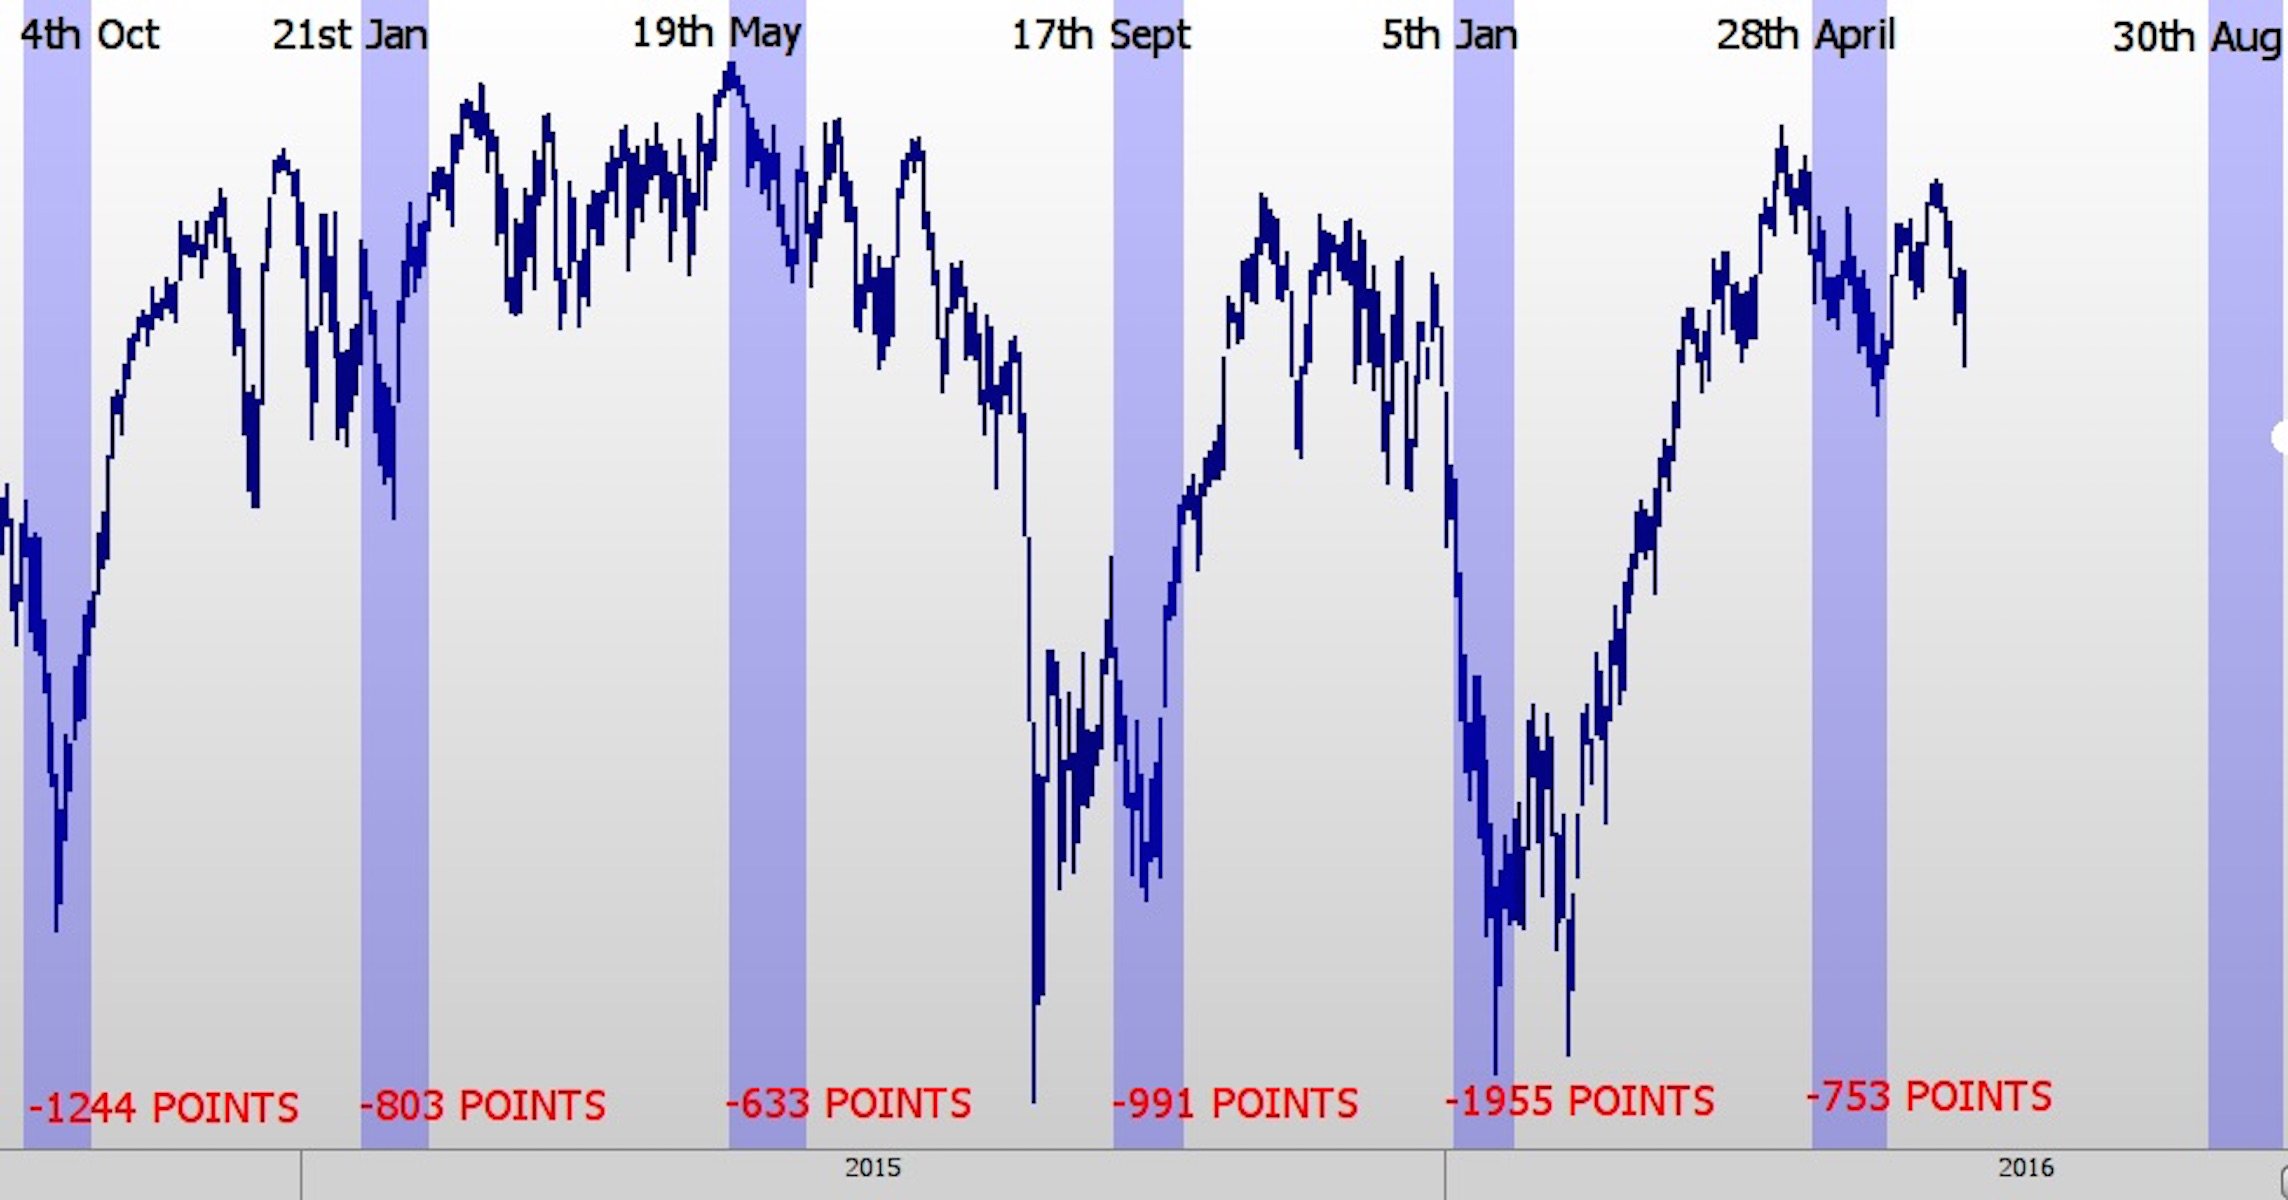
“This exact same cycle is what we are in right now. And so I am worried that we could see a potential threat to our economy in the current ‘Time Cycle’ we are witnessing right now.
We have a situation. This lasts until 2018 for this particular cycle. And my worry is that we could see sudden sharp declines take place and tripping investors if they are not prepared.”
Jadeja is convinced that the sudden declines will take place on three dates:
between August 26 and August 30,
September 26, and;
October 20, 2016
He has been deadly accurate previously, so I wouldn’t entirely dismiss his views. I have bookmarked these dates and will follow up when we get closer to these periods.
No Change To Allocations (Again)
The inability for the markets to advance, but having not yet violated important support levels, keeps portfolio allocation models once again unchanged.
Please review the portfolio management rules discussed a few weeks ago which guide the investment process in my shop. It is through following these basic rules that, with the markets overbought, underlying fundamentals and economics deteriorating, and profits still weak, that I continue to suggest some portfolio actions be taken to reduce, not eliminate, overall risk as noted above.
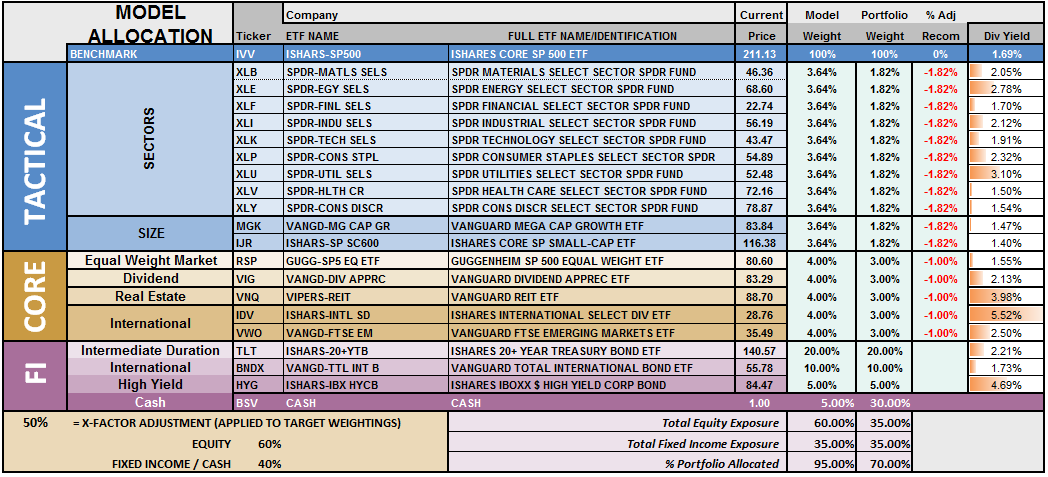
S.A.R.M. Model Allocation
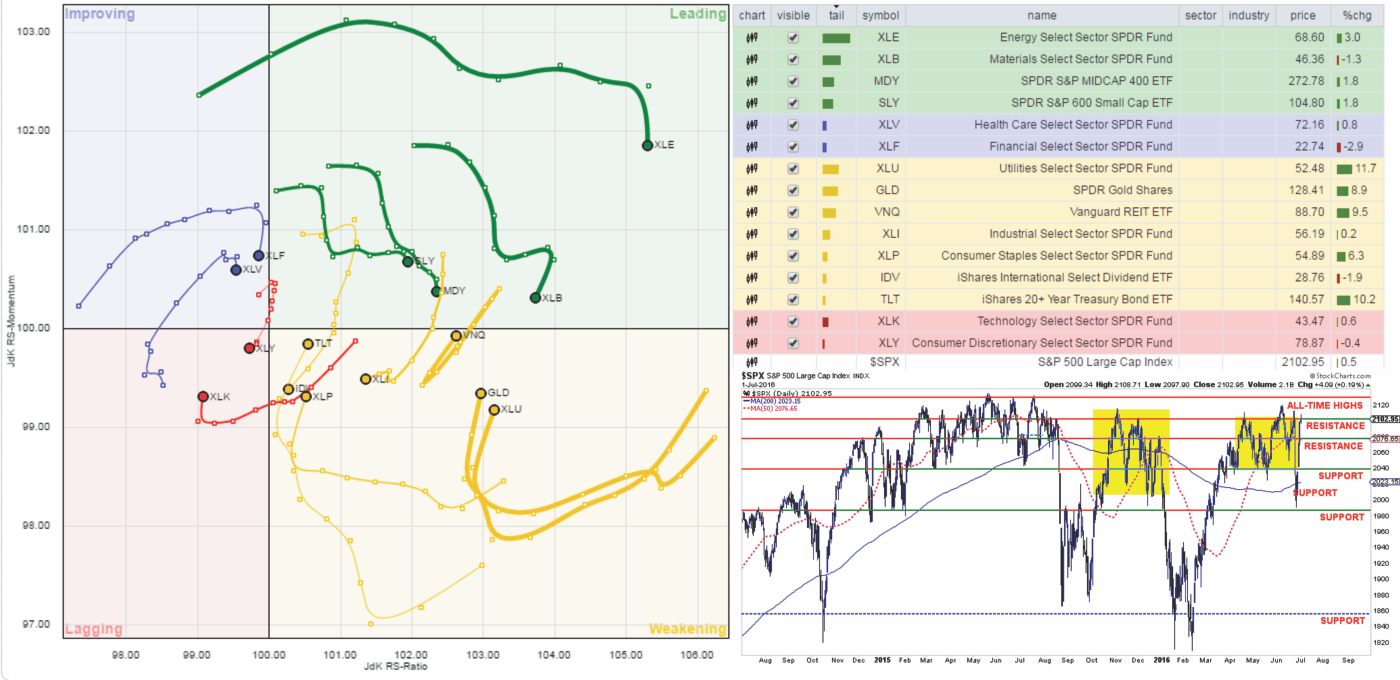
The Sector Allocation Rotation Model (SARM) is an example of a basic well-diversified portfolio. The purpose of the model is to look “under the hood” of a portfolio to see what parts of the engine are driving returns versus detracting from it. From this analysis, we can then determine where to overweight sectors which are leading performance, reduce in areas lagging, and eliminate those areas that are dragging.
This past week’s volatility didn’t change the backdrop of the market much. However, it is worth noting that the leadership of energy, basic materials, small and mid-cap is fading along with the relative performance of healthcare and financials.
The sector recommendations over the last two weeks, shown below, paid off handsomely during this past week’s wild ride. With some extra cash in hand, laggards reduced, portfolio volatility was well reduced relative to the markets.
LEADING BUT WEAKENING: Energy, Materials, Mid-cap and Small-cap
IMPROVING BUT WEAKENING: Financials and Health Care
LAGGING BUT IMPROVING: Utilities, Gold, Bonds, REIT’s and Staples
LAGGING & WEAKENING: Discretionary, Technology, International & Industrials
The sector comparison chart below shows the 9-major sectors of the S&P 500.
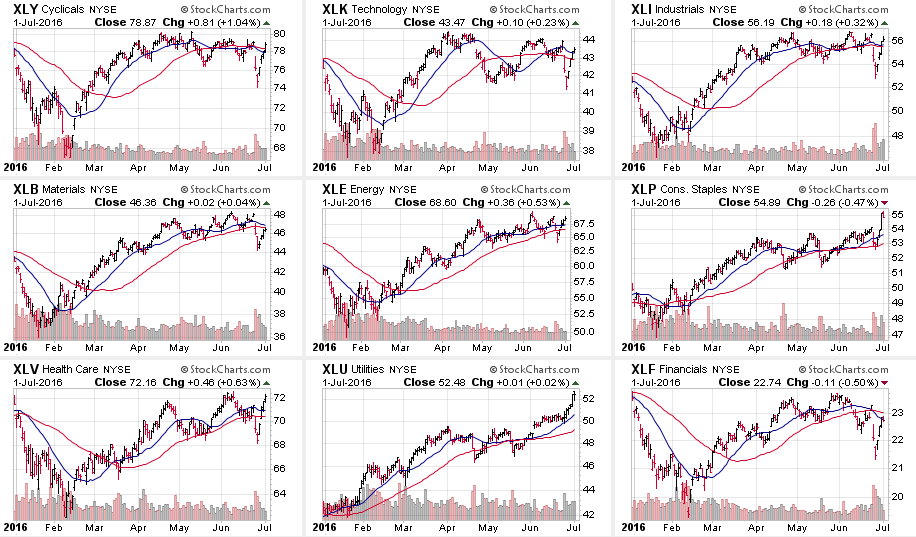
The “Brexit” sell-off was seen across all sectors of the market with the exception of Utilities and Staples. Both of these sectors are EXTREMELY OVERBOUGHT and profit taking is strongly advised.
The hardest hit sector was Financials as potential debt default concerns rose, however, Matericals, Healthcare, Technology, Discretionary and Industrials were all punished. But, by Friday, the damage has been mostly reversed.
In other major markets and asset classes, International and International Dividend Yielding markets were the hardest hit last week along with Small-Cap, Mid-Cap, Emerging Markets. Like the S&P above, the majority of the damage has been reversed.
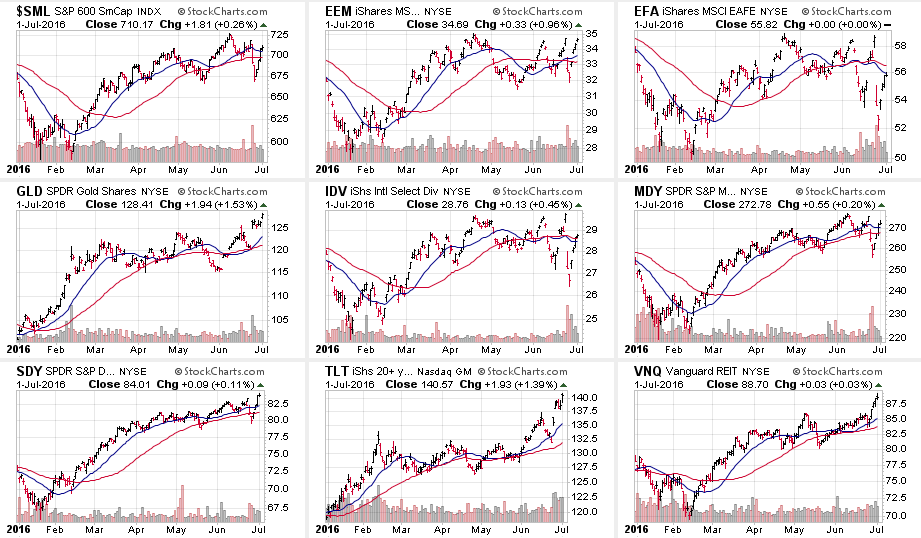
On a short-term basis, bonds, REIT’s and gold are pushing extreme levels of deviation, profit taking at these levels would be strongly recommended.
As I stated two weeks ago:
“We saw the early stages of deterioration in leadership in Small and Mid-Cap stocks last week, so profit taking would be suggested.“
That proved very prescient. I suspect we are about to see the same rotation in bonds, REIT’s, Gold, Utilities & Staples so, again, profit taking and rebalancing is advised.
S.A.R.M. Sector Analysis & Weighting
The current risk weighting remains at 50% this week. The failure to maintain the breakout above 2100 holds allocation changes for now. With technical underpinnings still “bullishly biased,” we want to give the markets the benefit of the doubt for now. However, with those technical underpinnings deteriorating, risk has risen markedly.
Relative performance of each sector of the model as compared to the S&P 500 is shown below. The table compares each position in the model relative to the benchmark over a 1, 4, 12, 24 and 52-week basis.
Historically speaking, sectors that are leading the markets higher continue to do so in the short-term and vice-versa. The relative improvement or weakness of each sector relative to index over time can show where money is flowing into and out of. Normally, these performance changes signal a change that last several weeks.
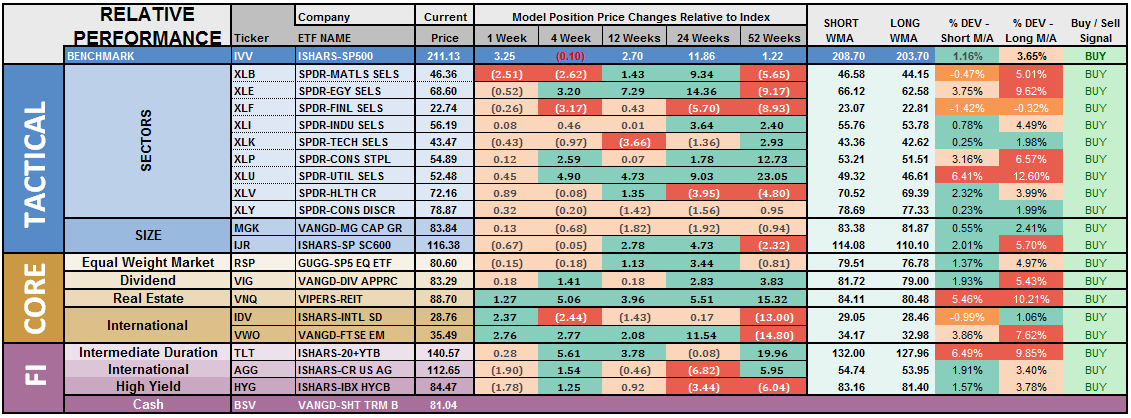
The last column is a sector specific “buy/sell” signal which is simply when the short-term weekly moving average has crossed above or below the long-term weekly average. The number of sectors on “buy signals” has improved from just 2 a few weeks ago to 19 this past week.
The risk-adjusted equally weighted model remains from last week. No changes this week.
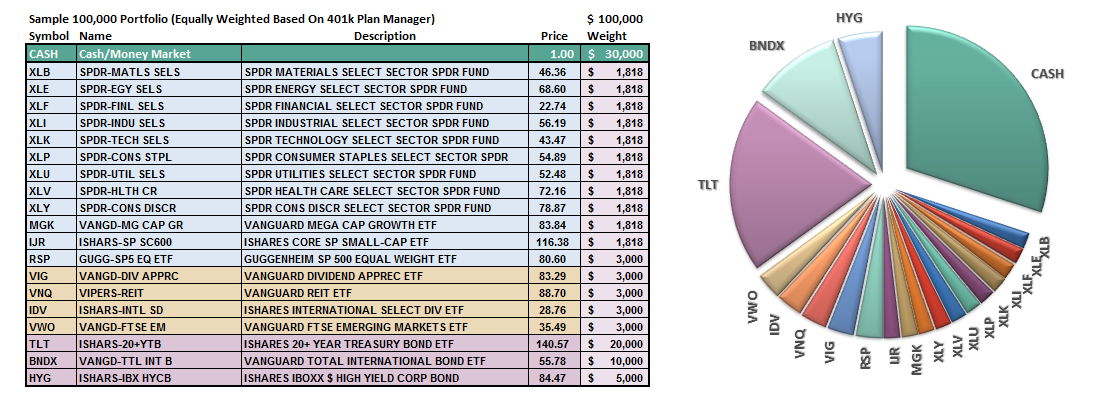
The portfolio model remains at 35% Cash, 35% Bonds, and 30% in Equities.
As always, this is just a guide, not a recommendation. It is completely OKAY if your current allocation to cash is different based on your personal risk tolerance, time frames, and goals.
For longer-term investors, we need to see an improvement in the fundamental and economic backdrop to support a resumption of the bullish trend. Currently, there is no evidence of that occurring.


