Written by Lance Roberts, Clarity Financial
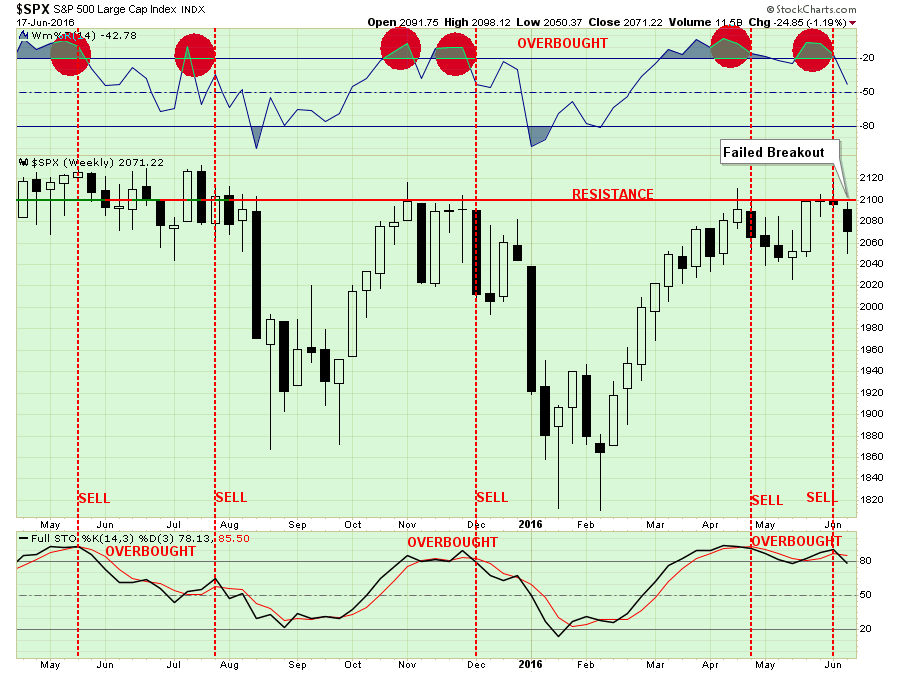
Last week, I discussed the failure of the market to hold its breakout about 2100 which keeps the market confined within the bearish trend that began in May of last year. Here is the updated chart that discussion.

As I stated two weeks ago in this missive:
“With the market now overbought on a WEEKLY basis, there is little “fuel in the tank” to substantially drive prices higher in the short-term.“
In the chart above, I added vertical red dashed lines which denote the combination of both oversold conditions AND a stochastic sell signal. The combination of these two factors suggests more price weakness over the next couple of weeks.
As has been repeatedly been the case, with risk outweighing reward at the moment, a more cautious stance to portfolio management should be considered.
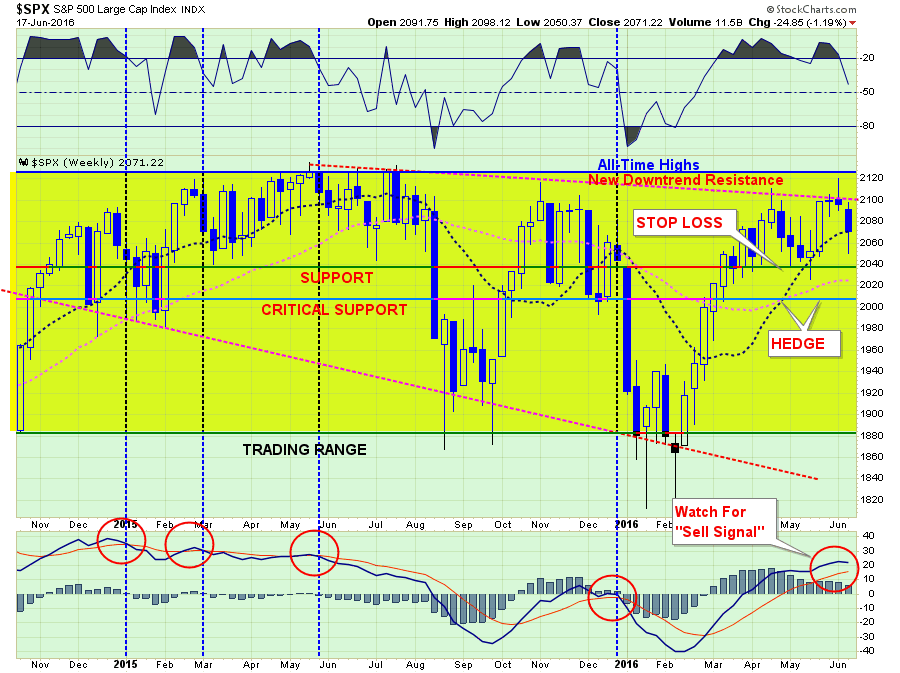
The next chart shows the now 13-month long sideways trading range of the market. However, most importantly, the downward trending price pattern remains in place. The recent failure at the downtrend resistance line remains a concern.
The vertical blue-dashed lines denote market sell signals where subsequent price action has been poor, to say the least. While a “sell signal” is NOT CURRENTLY in place, it will not require much further deterioration in price to trigger one.
As I stated last week:
“As shown in the top part of the chart above, when the markets are as overbought as they are now, it has generally been at, or near, a short-term peak in the market.”
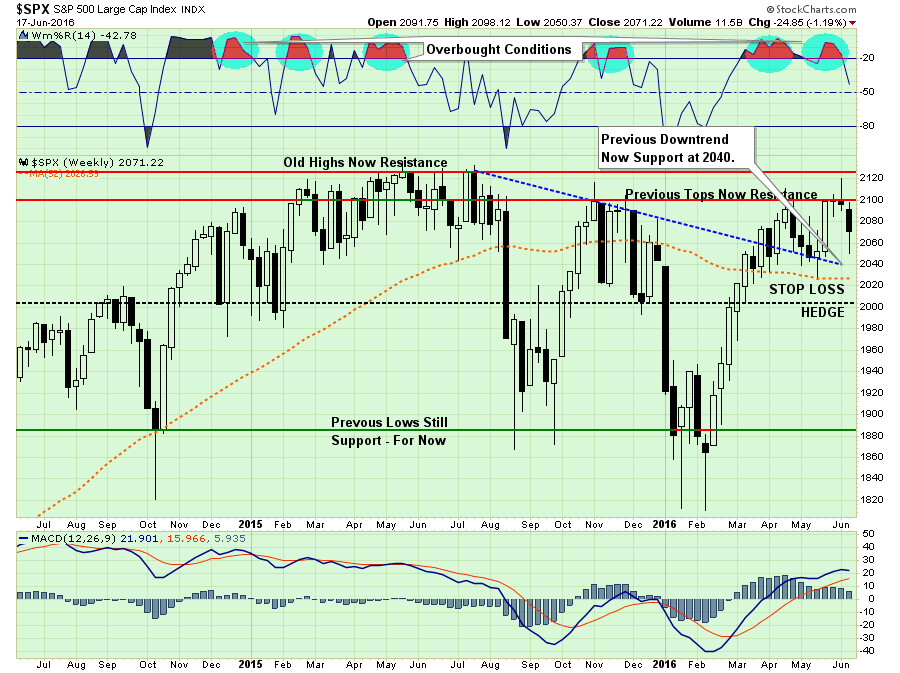
The short-term outlook continues to suggest more vulnerability to selling. The failure of the markets to hold support at 2080 now sets the market up to test support at 2040.
Stop loss levels remain in place at 2040 currently. A break of 2000 will initiate a market-neutral hedging strategy to reduce overall equity exposure and related portfolio risk.
Interest Rates & Bonds
Despite all of the “bullish bantering” by the nattering nabobs who have actually never lived through a bear market, interest rates are currently telling you several things:
The economy is substantially weaker than headlines suggests (hence the coming negative revisions)
Money is seeking safety over risk which leaves equity markets at risk of reversions.
Inflationary pressures are likely lower than advertised, and;
Recession risks are rising (recessions average 30% bear market declines)
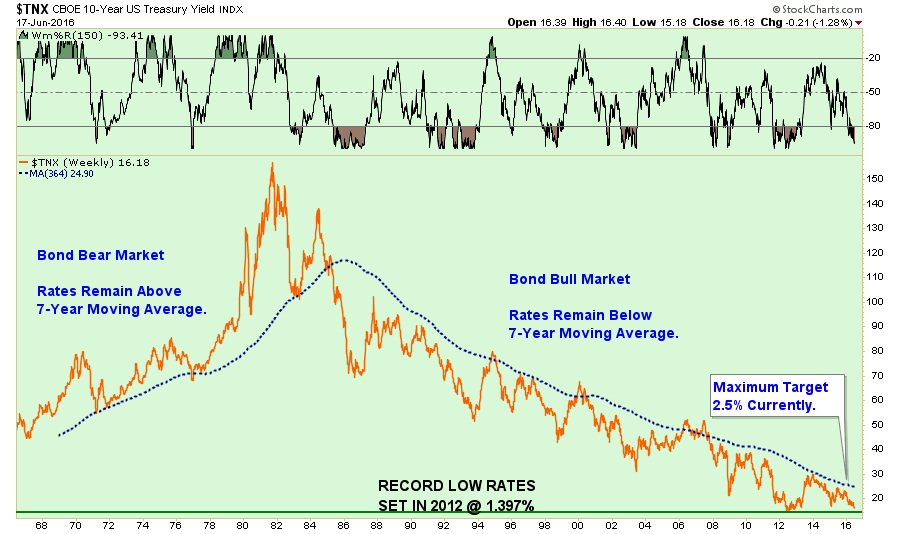
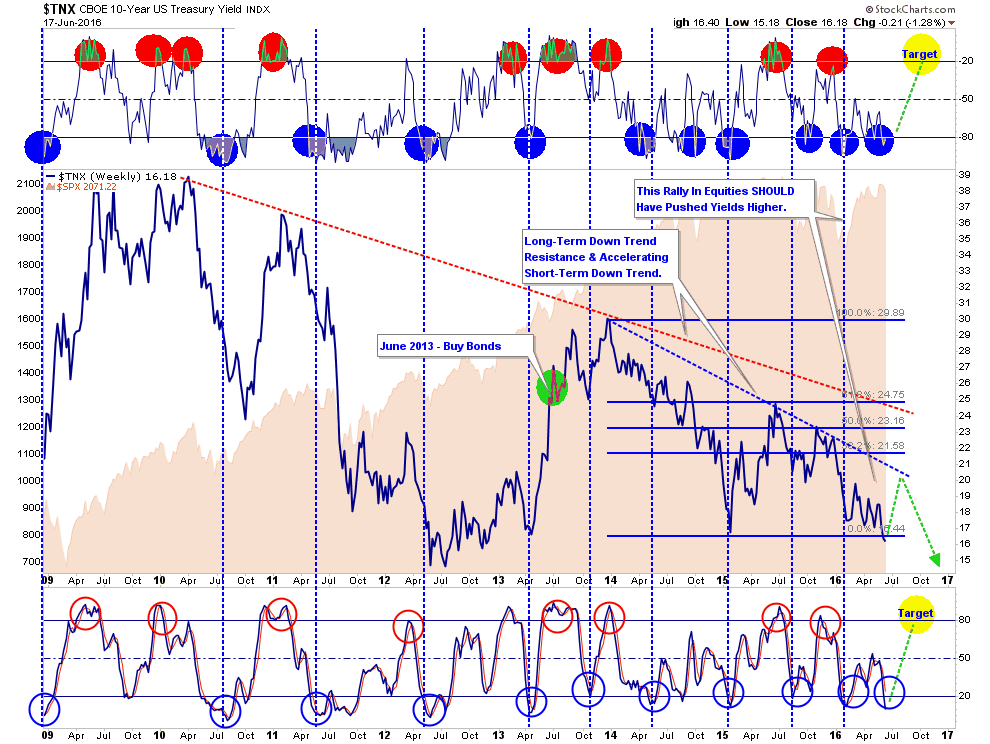
As shown in the chart below, interest rates are now pushing towards their lowest rates on record which were set in 2012 during the “micro-recession” and debt-ceiling default debate.
However, there IS some short-term good news for equity bulls.
With interest rates extremely oversold, making bonds extremely overbought, a reversal in rates should be expected. Such a reversal should lead, at some point, to a shift back into equities for a counter-trend rally. Unfortunately, as shown above, and below, for those continuing to expect an end to the “bond bull” market, such a counter-trend rally would only likely approach 2%ish.
As a quick side note, the death of the “Great Bond Bull Market” is greatly over-exaggerated. As I have written many times in the past, rates are a function of economic growth, inflation, and monetary velocity.
As my friend Charles Hugh-Smith recently penned:
“Take a declining population with declining rates of productivity growth and load it up with debt, and you get a triple-whammy recipe for permanent stagnation.”
While this sounds like what is currently happening in the U.S., he was actually talking about Japan. But the similarities are quite staggering between the two countries, and as with Japan, the ingredients for higher interest rates are simply “gone.”
Furthermore, historically speaking, there is plenty of evidence, much like Japan, we are just beginning an extremely long period of low interest rates. Such will contribute to the expectation of a low-return environment over the next 10-20 years as economic growth remains mired at lower levels.
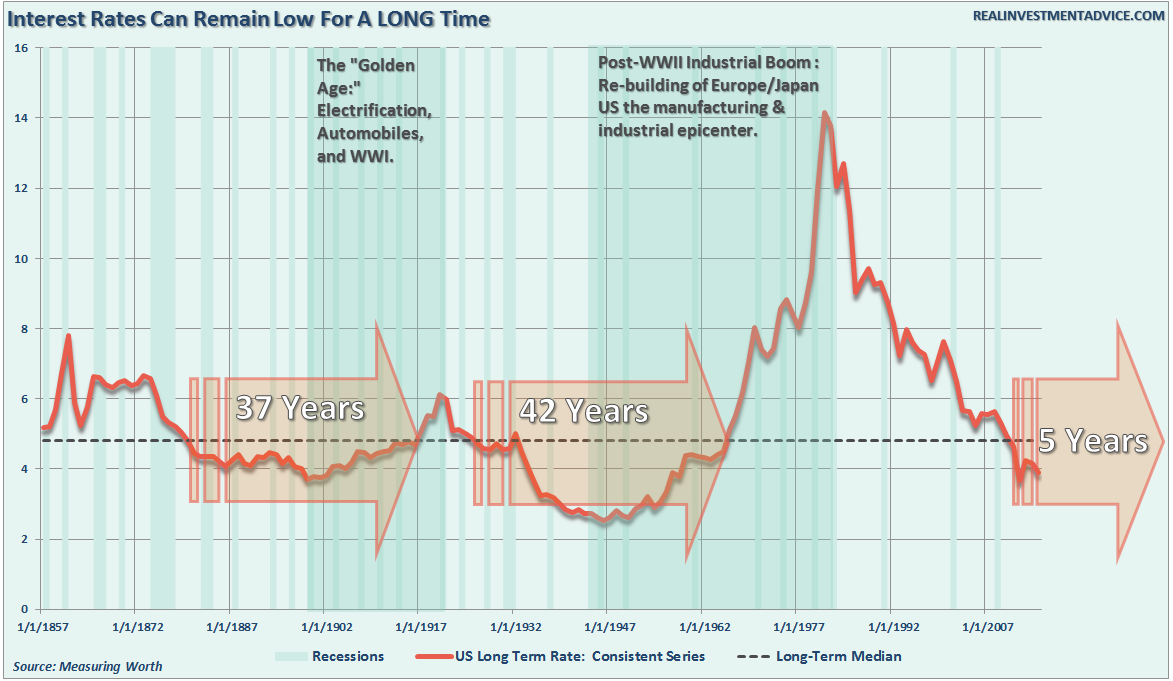
While the “Great Bond Bull” market of the last 30-years, which has been a huge tailwind to overall portfolio returns has been largely harvested, the next 20-years will likely be a trading range that will have to be managed not unlike an equity portfolio.
The new paradigm for adding to portfolio returns will require taking advantage of interest rate declines to shorten-duration and harvest profits, while extending duration and adding to bonds on advances.
Yes, Virginia, you will now have to actively manage risk on BOTH sides of portfolio allocation. However, effectively doing so will set advisors apart from their “buy and hold” counter-parts and create real “value” for their clients.
No Change To Allocations
The inability for the markets to advance, but having not yet violated important support levels, keeps portfolio allocation models once again unchanged.
Last week, I discussed the portfolio management rules that guide the investment process in my shop. It is through following these basic rules that, with the markets overbought, underlying fundamentals and economics deteriorating, and profits still weak, that I continue to suggest some portfolio actions be taken to reduce, not eliminate, overall risk.
Tighten up stop-loss levels to current support levels for each position.
Hedge portfolios against major market declines.
Take profits in positions that have been big winners
Sell laggards and losers
Raise cash and rebalance portfolios to target weightings.
S.A.R.M. Model Allocation
The Sector Allocation Rotation Model (SARM) is an example of a basic well-diversified portfolio. The purpose of the model is to look “under the hood” of a portfolio to see what parts of the engine are driving returns versus detracting from it. From this analysis, we can then determine where to overweight sectors which are leading performance, reduce in areas lagging, and eliminate those areas that are dragging.
This past week saw a continuation of that relative rotation from RISK to SAFETY as performance improved in bonds and areas that benefit from lower rates. Furthermore, RISK based sectors have continued to wane in performance and the number of sectors leading the markets have continued to shrink. As I stated previously, such action is indicative of short-term topping process following an advance. This is exactly what we continue to see play out as we witnessed during the summer and winter of 2015.
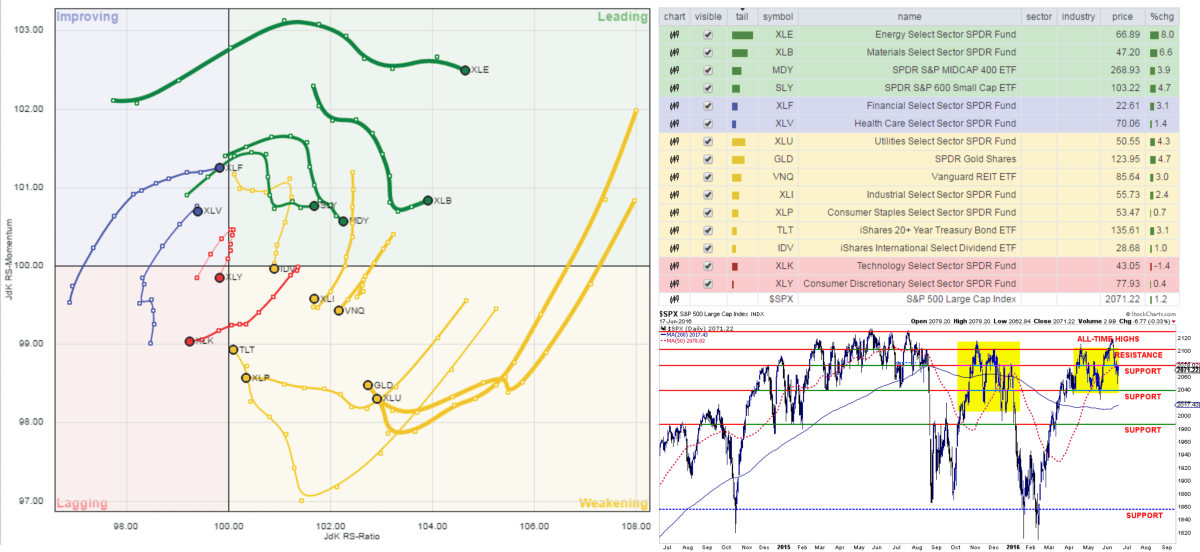
Health Care and Financials continued their relative improvement last week, but Discretionary lost footing and has slipped very quickly from its previously leading position. While Energy, Basic Materials, Mid-Cap, Small-Cap and International continue to provide leadership, relative outperformance has weakened markedly.
LEADING: Energy, Materials, Mid-cap and Small-cap (Take Profits)
IMPROVING: Financials and Health Care (Hold)
LAGGING BUT SHOWING IMPROVEMENT: Utilities, Gold, Bonds and Staples (Hold and Selectively Add)
LAGGING & WEAKENING: Discretionary, Technology, International, Industrials, & REITs (Reduce)
The sector comparison chart below shows the 9-major sectors of the S&P 500.
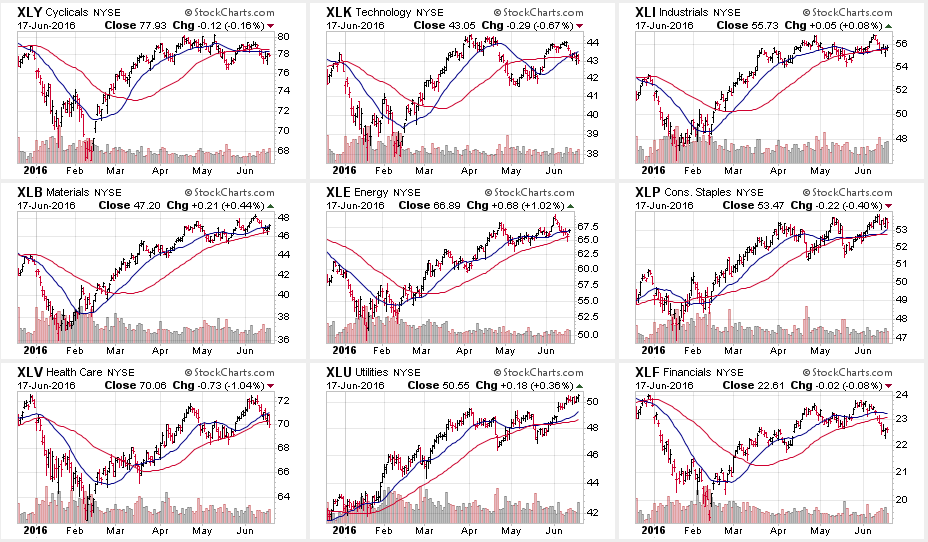
The sell-off last week was most clearly seen in across all sectors of the market last week with the exception of Utilities. The hardest hit sector was Financials as the decline of interest rates, and the inability of the Fed to hike rates, led to continuing concerns about net-interest margins in the sector.
Healthcare, which I stated two weeks ago was pushing extreme overbought conditions and some profit taking would be wise, also fell sharply this past week.
The case with Healthcare is now seen in Utilities. The very sharp push in the sector has now pushed it back into extreme overbought territory. While the “yield chase” is still intact, it would be rise to take some profits from the sector near term.
Small-Cap, Mid-Cap, Dividend Yield and Bonds are all pushing extreme overbought levels. We saw the early stages of deterioration in leadership in Small and Mid-Cap stocks last week, so profit taking would be suggested. Bonds are also extremely overbought.
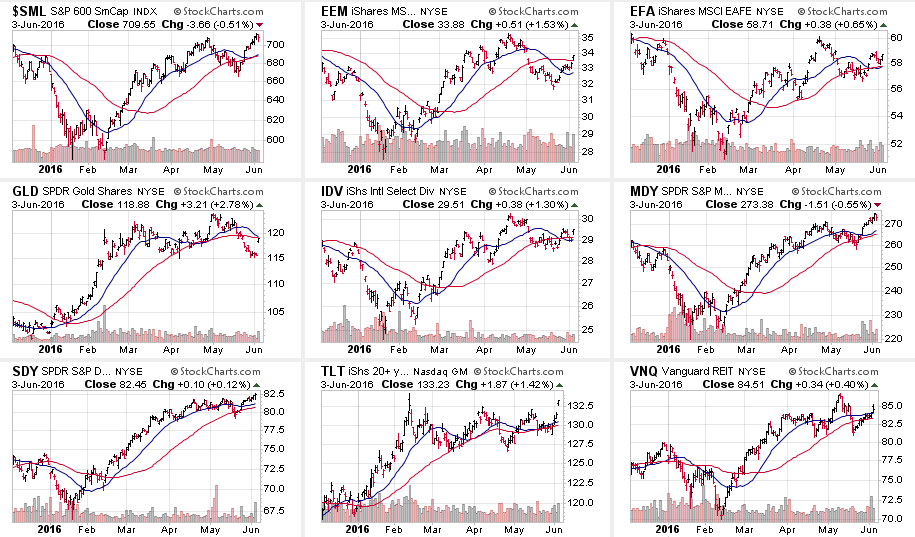
In early 2013, I recommended getting out of Gold. Despite the recent short term bounce, Gold remains a laggard to just about every other major asset class. There is still no reason to own gold at this time until the technical backdrop and long-term downtrends are resolved.
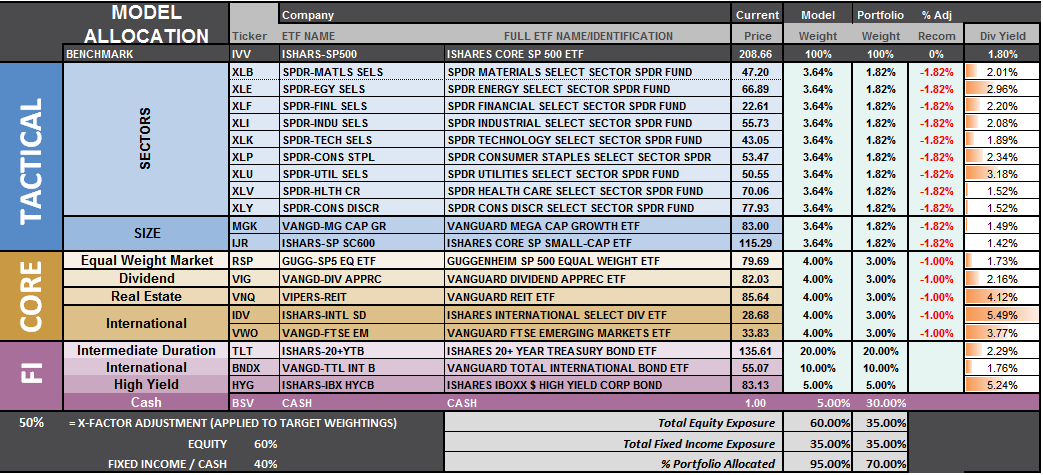
S.A.R.M. Sector Analysis & Weighting
The current risk weighting remains at 50% this week. The failure to maintain the breakout above 2100 holds allocation changes for now. With technical underpinnings still “bullishly biased,” we want to give the markets the benefit of the doubt for now.
It will still require a move to new all-time highs in order to safely increase model allocations further at this juncture.
Relative performance of each sector of the model as compared to the S&P 500 is shown below. The table compares each position in the model relative to the benchmark over a 1, 4, 12, 24 and 52-week basis.
Historically speaking, sectors that are leading the markets higher continue to do so in the short-term and vice-versa. The relative improvement or weakness of each sector relative to index over time can show where money is flowing into and out of. Normally, these performance changes signal a change that last several weeks.
As stated above, Bonds & Utilities had the biggest performance improvements last week.
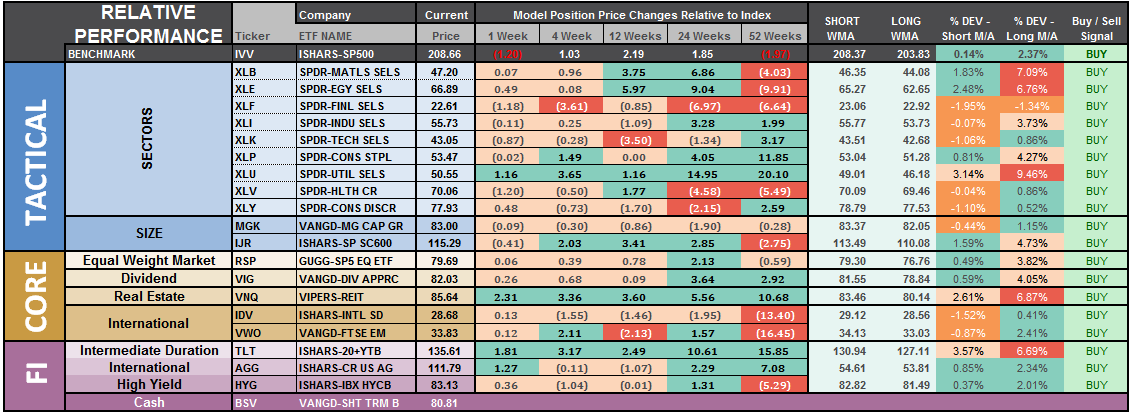
The last column is a sector specific “buy/sell” signal which is simply when the short-term weekly moving average has crossed above or below the long-term weekly average. The number of sectors on “buy signals” has improved from just 2 a few weeks ago to 19 this past week.
It is worth noting that ALL 19-sectors are now on bullish buy signals. As stated above, the technical underpinnings are bullish and should not be lightly dismissed. It is just highly unusual for such to be the case at a time where economic and fundamental weakness is so prevalent. In other words, this is a clear sign of market exuberance in the making.
The risk-adjusted equally weighted model remains from last week. No changes this week.
The portfolio model remains at 35% Cash, 35% Bonds, and 30% in Equities.
As always, this is just a guide, not a recommendation. It is completely OKAY if your current allocation to cash is different based on your personal risk tolerance, time frames, and goals.
For longer-term investors, we need to see an improvement in the fundamental and economic backdrop to support a resumption of the bullish trend. Currently, there is no evidence of that occurring.
THE REAL 401k PLAN MANAGER
The Real 401k Plan Manager – A Conservative Strategy For Long-Term Investors
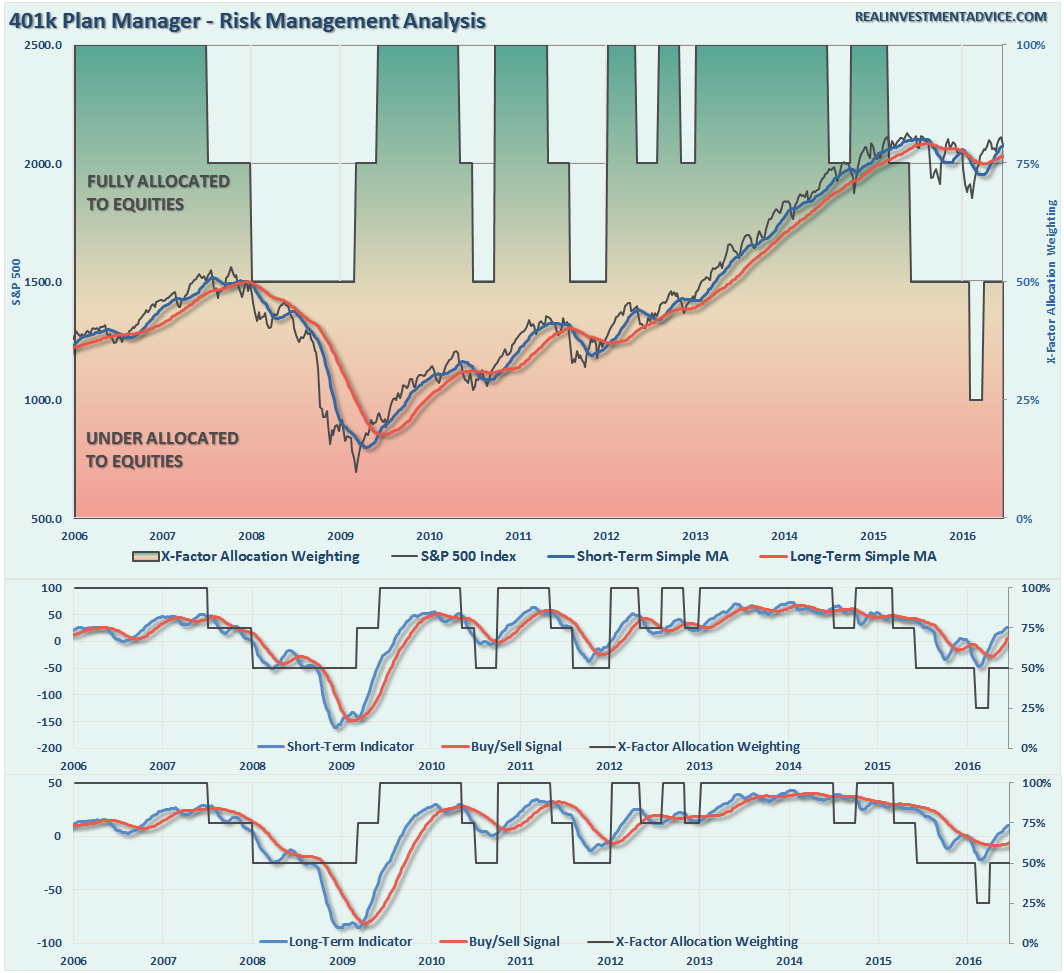
NOTE: I have redesigned the 401k plan manager to accurately reflect the changes in the allocation model over time. I have overlaid the actual model changes on top of the indicators to reflect the timing of the changes relative to the signals.
There are 4-steps to allocation changes based on 25% reduction increments. As noted in the chart above a 100% allocation level is equal to 60% stocks. I never advocate being 100% out of the market as it is far too difficult to reverse course when the market changes from a negative to a positive trend. Emotions keep us from taking the correct action.

Back In Limbo
As discussed in the main section of the newsletter, while the technical underpinnings are still bullishly biased, the failure of the market to breakout about 2100 keeps allocation models on hold, again, this week. In other words, we remain in “limbo” and frustratingly so.
With technical buy signals currently in place, it suggests that allocations should be moved up to 75%. However, given the inability to rapidly change allocations in many 401k plans, due to trading limitations, I would rather wait for a clear breakout above resistance and a re-establishment of the “bullish trend” before taking on additional equity risk.
Also, as we head into the seasonally weak time of year, combined with what appears to be a rather volatile Presidential election, “Brexit,” and weakening economic underpinnings, some extra levels of precaution seem prudent.
Therefore, there are no changes to the 401k model this week as risk/reward is still not balanced enough to justify taking on additional model risk.
For longer-term investors, the markets have made virtually no progress since January of 2015. Therefore, there is little evidence to suggest stepping away from a more cautionary allocation…for now.
If you need help after reading the alert; don’t hesitate to contact me.
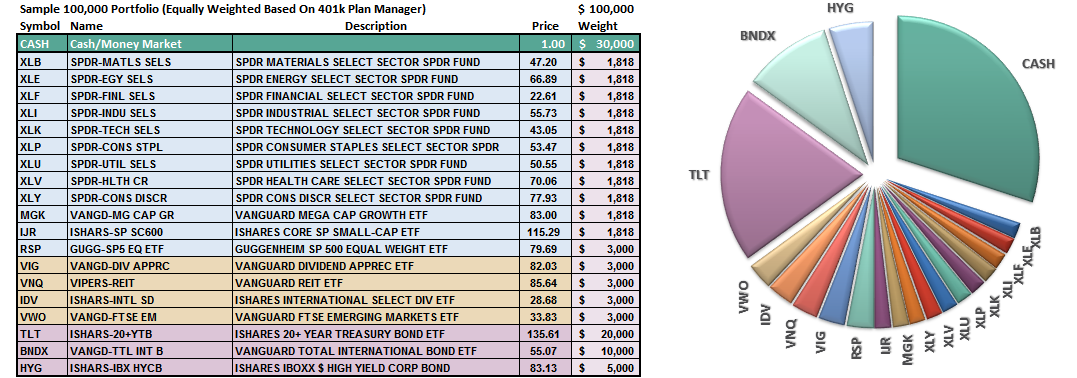
Current 401-k Allocation Model
The 401k plan allocation plan below follows the K.I.S.S. principal. By keeping the allocation extremely simplified it allows for better control of the allocation and a closer tracking to the benchmark objective over time. (If you want to make it more complicated you can, however, statistics show that simply adding more funds does not increase performance to any great degree.)

401k Choice Matching List
The list below shows sample 401k plan funds for each major category. In reality, the majority of funds all track their indices fairly closely. Therefore, if you don’t see your exact fund listed, look for a fund that is similar in nature.


