Written by Lance Roberts, Clarity Financial
Market Fails To Breakout
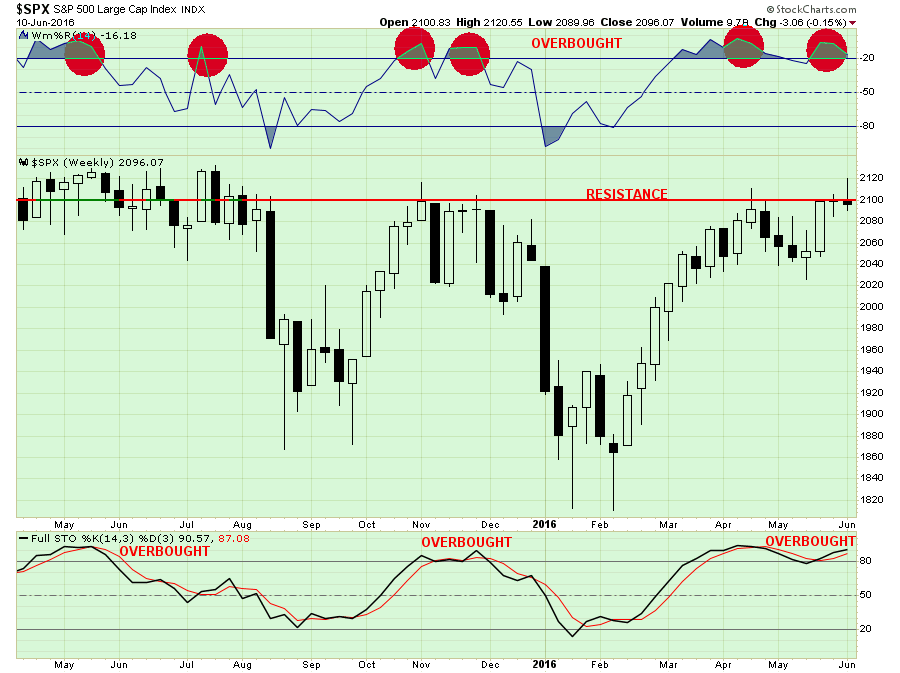
Okay, so let’s get to what you really want to know. On Friday, the market failed to hold its breakout of 2100, as stated our earlier post, which keeps the market confined to its longer-term bearish trend.

As I stated last week:
“With the market now overbought on a WEEKLY basis, there is little “fuel in the tank” effectively to substantially drive prices higher in the short-term. Therefore, with risk outweighing reward at the moment, a more cautious stance to portfolio management should be considered.”
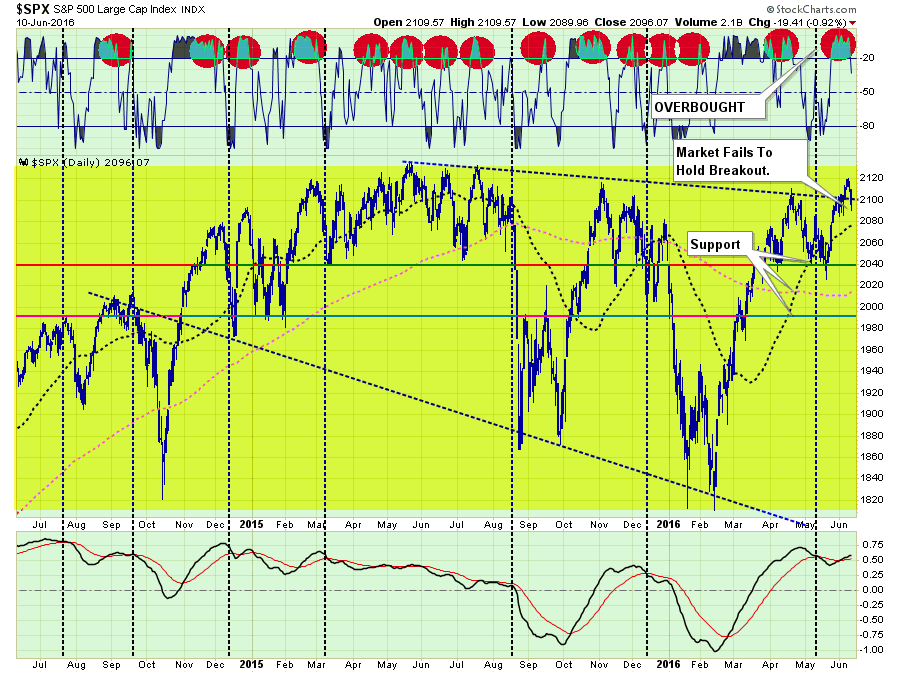
That overbought condition, and downtrend resistance, remains this week and is confirmed by the daily price chart as well
As shown in the top part of the chart above, when the markets are as overbought as they are now, it has generally been at, or near, a short-term peak in the market.
The short-term outlook suggests more vulnerability to selling. Importantly, the markets must hold support at 2080, the short-term moving average, or 2040 which is the recent bottoms of what currently appears to be a potential topping process.
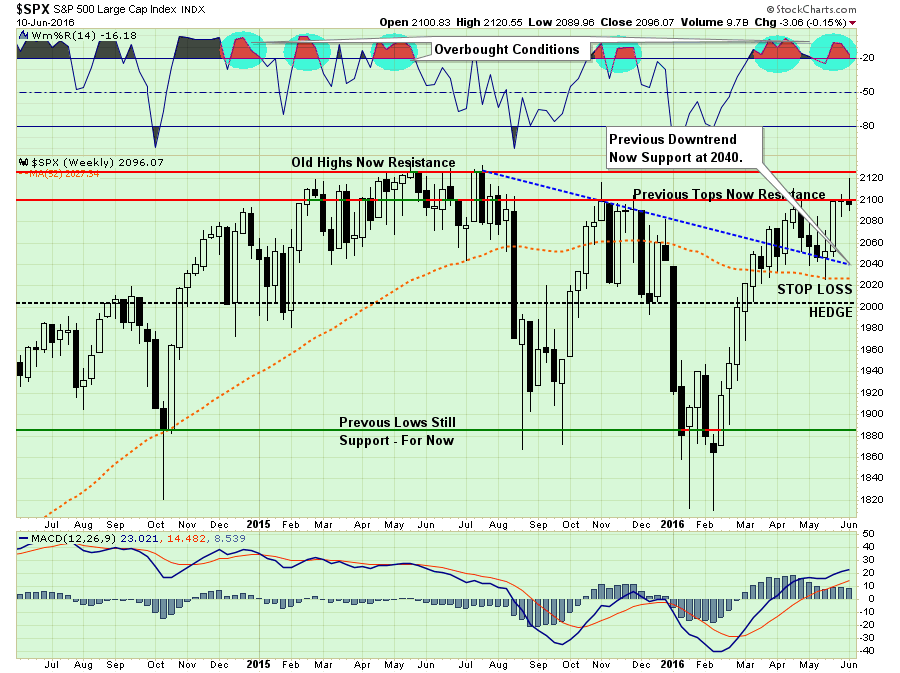
The failure of the markets this week to break, and hold, above 2100 keeps portfolio allocations at current levels. As shown below, the downtrend resistance, on a weekly basis, also coincides with 2040 reinforcing the importance of that support level. Stop loss levels are current set at 2020, and portfolio hedges will be added with a subsequent break of 2000.
Portfolio Management Rules
It is important to understand that as a portfolio manager, I am truly neither bullish or bearish. I follow a very simple set of rules which are the core of my portfolio management philosophy which focus on capital preservation and long-term returns.
The fundamental, economic and price analysis forms the backdrop of overall risk exposure and asset allocation. However, the following rules are the “control boundaries” for all specific actions.
Cut losers short and let winner’s run. (Be a scale-up buyer into strength.)
Set goals and be actionable. (Without specific goals, trades become arbitrary and increase overall portfolio risk.)
Emotionally driven decisions void the investment process. (Buy high/sell low)
Follow the trend. (80% of portfolio performance is determined by the long-term, monthly, trend. While a “rising tide lifts all boats,” the opposite is also true.)
Never let a “trading opportunity” turn into a long-term investment. (I will just hold it until it comes back.)
An investment discipline does not work if it is not followed.
“Losing money” is part of the investment process. (If you are not prepared to take losses when they occur, you should not be investing.)
The odds of success improve greatly when the fundamental analysis is confirmed by the technical price action. (This applies to both bull and bear markets)
Never, under any circumstances, add to a losing position. (As Paul Tudor Jones once quipped: “Only losers add to losers.”)
Market are either “bullish” or “bearish.” During a “bull market” be only long or neutral. During a “bear market” be only long or short. (Bull and Bear markets are determined by their long-term trend as shown in the chart below.)
When markets are trading at, or near, extremes do the opposite of the “herd.”
Do more of what works and less of what doesn’t. (Traditional rebalancing takes money from winners and adds it to losers. Rebalance by reducing winners and adding to winners.)
“Buy” and “Sell” signals are only useful if they are implemented. (Managing a portfolio without a “buy/sell” discipline is designed to fail.)
Strive to be a .700 “at bat” player. (No strategy works 100% of the time. However, being consistent, controlling errors, and capitalizing on opportunity is what wins games.)
Manage risk and volatility. (Controlling the variables that lead to investment mistakes is what generates returns as a byproduct.)
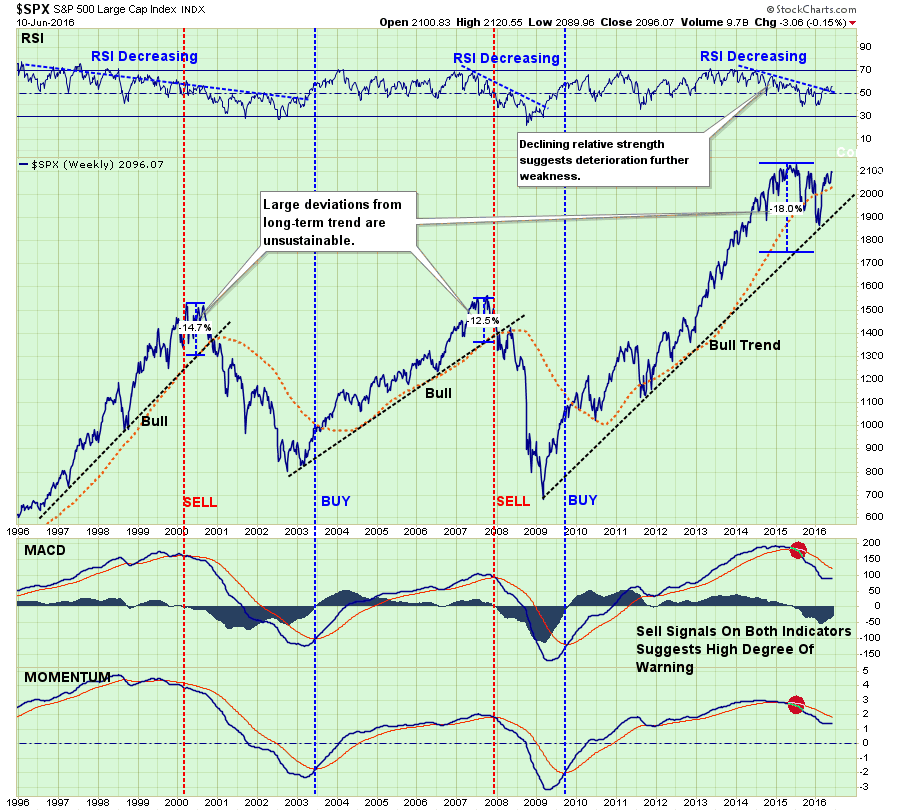
As stated above, the long-term price trends determine a bulk of portfolio actions. Currently, the bullish trend from 2009 remains intact. However, a violation of 2000 will negate that bullish trend and require portfolios to be either “neutral or short.” Importantly, until that violation occurs, portfolios can, and should be, either long or neutral.
This is why currently, portfolio allocations remain long 50% equity, which is where they have primarily been since May, 2015 when I reduced allocations from a 100% allocation to risk. Since that time, reduced allocations have not impeded portfolio returns but has significantly reduced overall portfolio volatility.
Furthermore, as stated above, by focusing on “risk controls” in the short-term, and avoiding subsequent major drawdowns, long-term returns tend to take care of themselves.
It is through following these basic rules that, with the markets overbought, underlying fundamentals and economics deteriorating, and profits still weak, some portfolio actions should be taken to reduce, not eliminate, overall risk.
Tighten up stop-loss levels to current support levels for each position.
Hedge portfolios against major market declines.
Take profits in positions that have been big winners
Sell laggards and losers
Raise cash and rebalance portfolios to target weightings.
Of course, everyone approaches money management differently. I am simply sharing my process and I hope you find something useful in it.
S.A.R.M. Model Allocation
The Sector Allocation Rotation Model (SARM) is an example of a basic well-diversified portfolio. The purpose of the model is to look “under the hood” of a portfolio to see what parts of the engine are driving returns versus detracting from it. From this analysis, we can then determine where to overweight sectors which are leading performance, reduce in areas lagging, and eliminate those areas that are dragging.
Over the last several weeks I have been discussing the move of RISK based sectors which have outpaced performance relative to SAFETY. Starting three weeks ago, that level of outperformance began to fade rather significantly suggesting the risk-based rally was coming to its inevitable conclusion.
This past week saw a continuation of that relative rotation from RISK to SAFETY as performance improved in bonds and areas that benefit from lower rates.
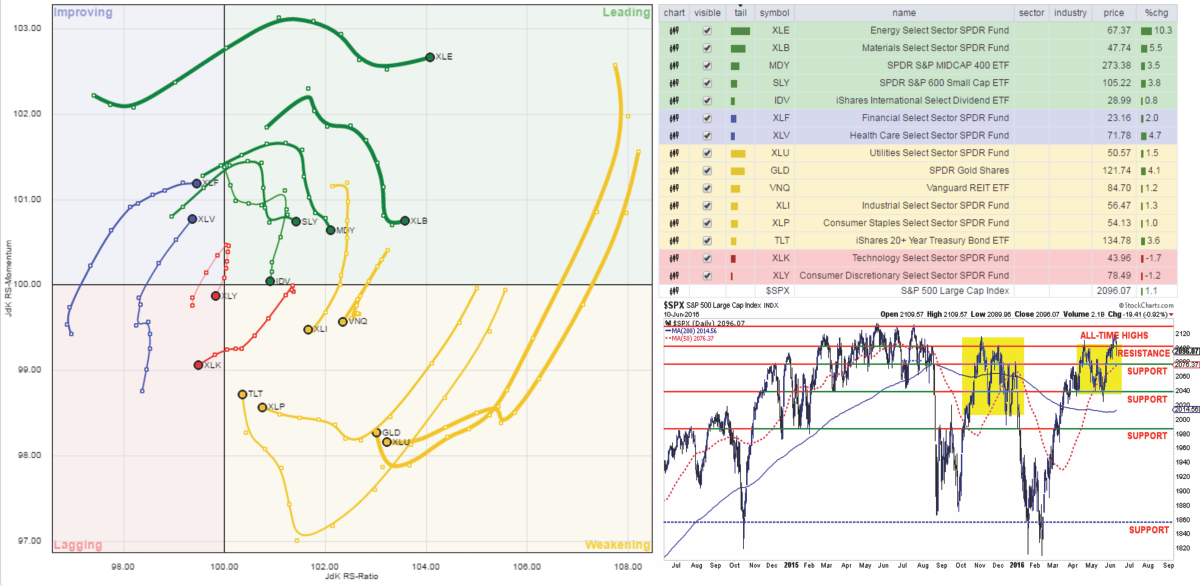
Health Care and Financials continued their relative improvement last week, but Discretionary lost footing and has slipped very quickly from its previously leading position. While Energy, Basic Materials, Mid-Cap, Small-Cap and International continue to provide leadership, relative outperformance has weakened markedly.
LEADING: Energy, Materials, Mid-cap, Small-cap, and International
IMPROVING: Financials and Health Care
LAGGING BUT SHOWING IMPROVEMENT: Utilities, Gold, Bonds, Staples,
LAGGING & WEAKENING: Discretionary, Technology, Industrials, & REITs
The sector comparison chart below shows the 9-major sectors of the S&P 500.
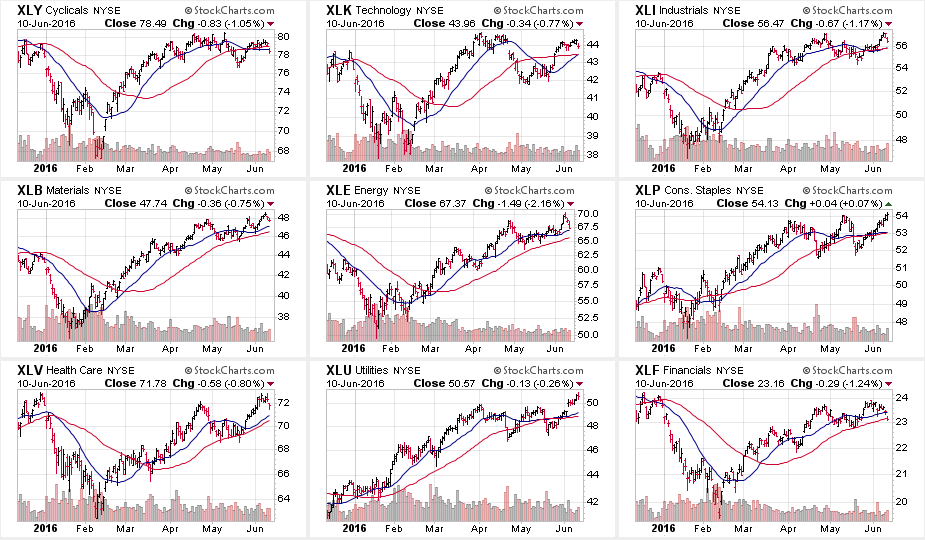
The sell-off on Friday was most clearly seen in Discretionary, Health Care, Energy and Financial sectors. However, the one-day reversal was not enough to severely change the short-term dynamics of the market, but the failure to close above 2100 is enough to raise warning flags.
Staples, Healthcare, Industrials, and Utilities are pushing extreme overbought which suggests some profit taking would be wise. As I stated last week:
“Furthermore, the large advance in Health Care is likely complete for now which suggests some profit taking and rebalancing in the sector.”
The same can be seen in Small-Cap and Mid-Cap stocks where the advance has gone too far too fast in a catch-up rotation move. Bonds also paced a tremendous move last week, as money rotated from equity risk to safety.
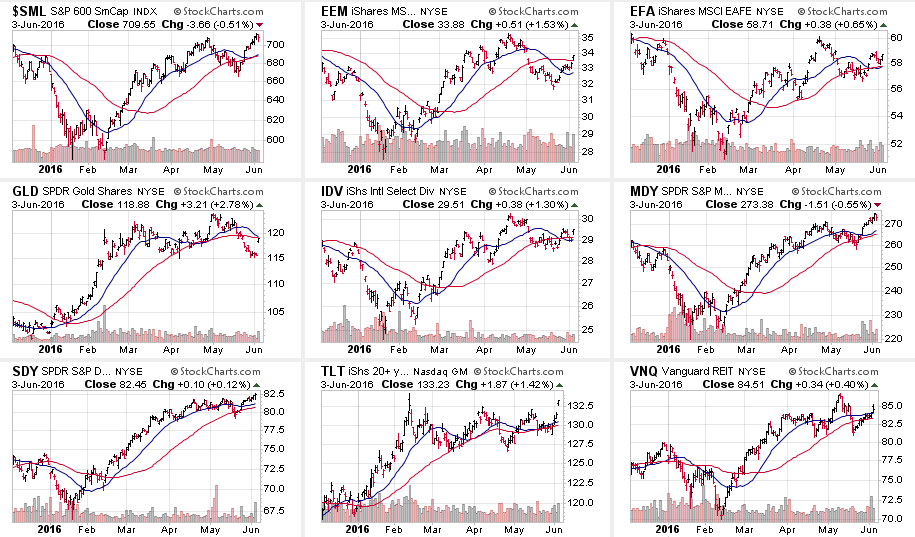
Gold is the clear loser for now as the “reflation trade” is still currently alive and well.
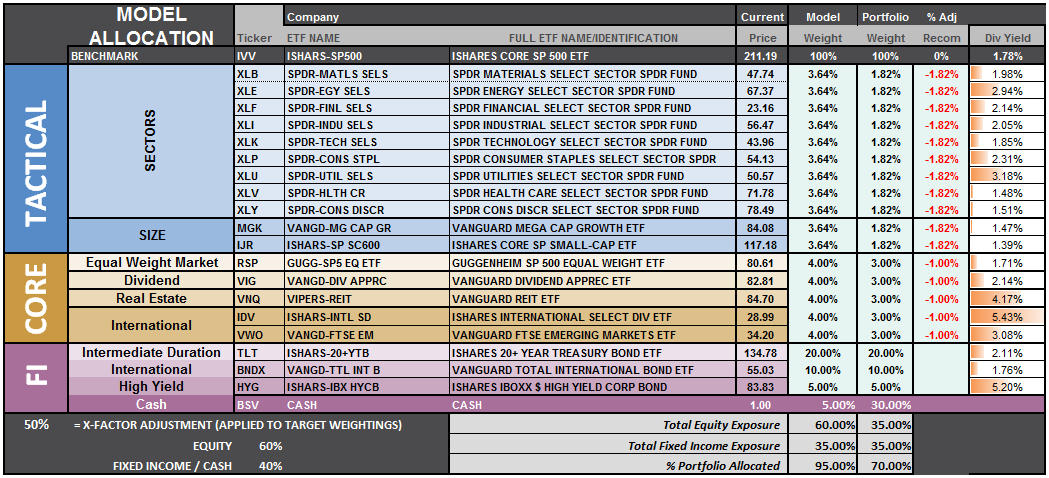
S.A.R.M. Sector Analysis & Weighting
The current risk weighting remains at 50% this week. The failure to maintain the breakout above 2100 holds allocation changes for now. With technical underpinnings still “bullishly biased,” we want to give the markets the benefit of the doubt for now.
It will require a move to new all-time highs in order to safely increase model allocations further at this juncture.
Relative performance of each sector of the model as compared to the S&P 500 is shown below. The table compares each position in the model relative to the benchmark over a 1, 4, 12, 24 and 52-week basis.
Historically speaking, sectors that are leading the markets higher continue to do so in the short-term and vice-versa. The relative improvement or weakness of each sector relative to index over time can show where money is flowing into and out of. Normally, these performance changes signal a change that last several weeks.
As stated above, Bonds, Staples & Utilities had the biggest performance improvements last week.
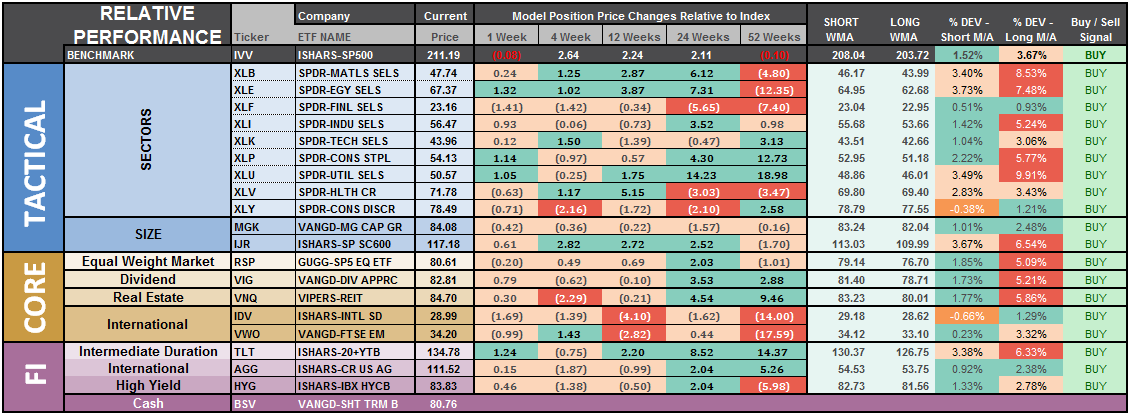
The last column is a sector specific “buy/sell” signal which is simply when the short-term weekly moving average has crossed above or below the long-term weekly average. The number of sectors on “buy signals” has improved from just 2 a few weeks ago to 19 this past week.
It is worth noting that ALL 19-sectors are now on bullish buy signals. As stated above, the technical underpinnings are bullish and should not be lightly dismissed. It is just highly unusual for such to be the case at a time where economic and fundamental weakness is so prevalent. In other words, this is a clear sign of market exuberance in the making.
The risk-adjusted equally weighted model remains from last week. No changes this week.
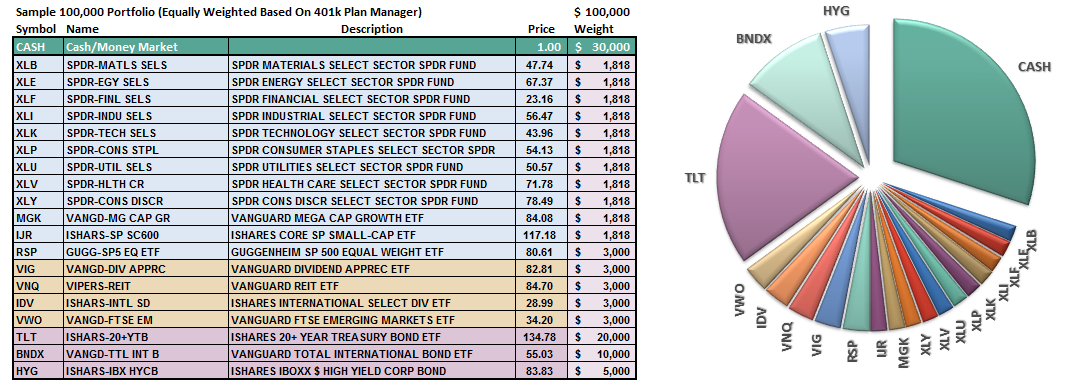
The portfolio model remains at 35% Cash, 35% Bonds, and 30% in Equities.
As always, this is just a guide, not a recommendation. It is completely OKAY if your current allocation to cash is different based on your personal risk tolerance, time frames, and goals.
For longer-term investors, we need to see an improvement in the fundamental and economic backdrop to support a resumption of the bullish trend. Currently, there is no evidence of that occurring.


