Written by Lance Roberts, Clarity Financial
After the recent rally how should we be trading this week? We take a hard look at historical comparisons and risk in this week’s Monday Morning Call.

The chart below shows the short-term view of the market beginning in April of last year. This chart coincides with the time frames of the subsequent analysis.
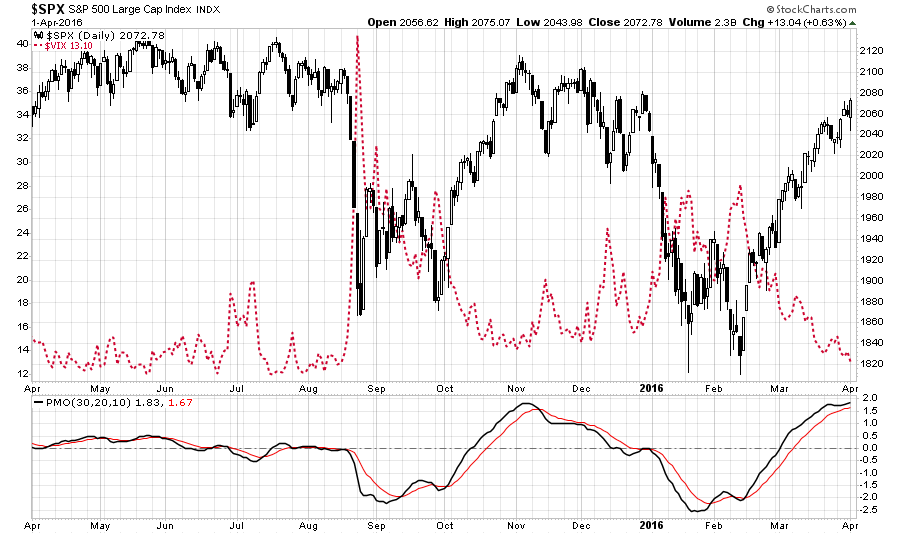
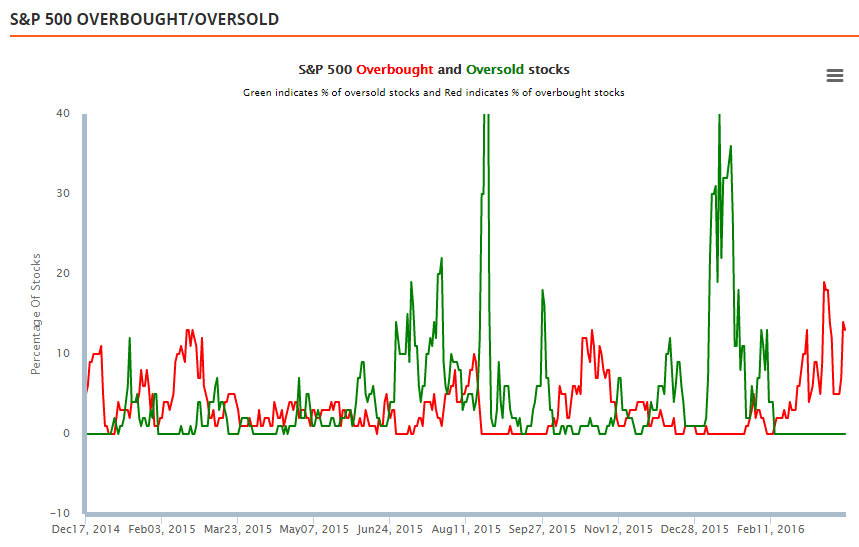
The rather brutal August and January declines see an increase in market volatility from extremely low levels and a decline in price momentum. The rallies subsequently took stocks to overbought levels which coincided with short-term market peaks.
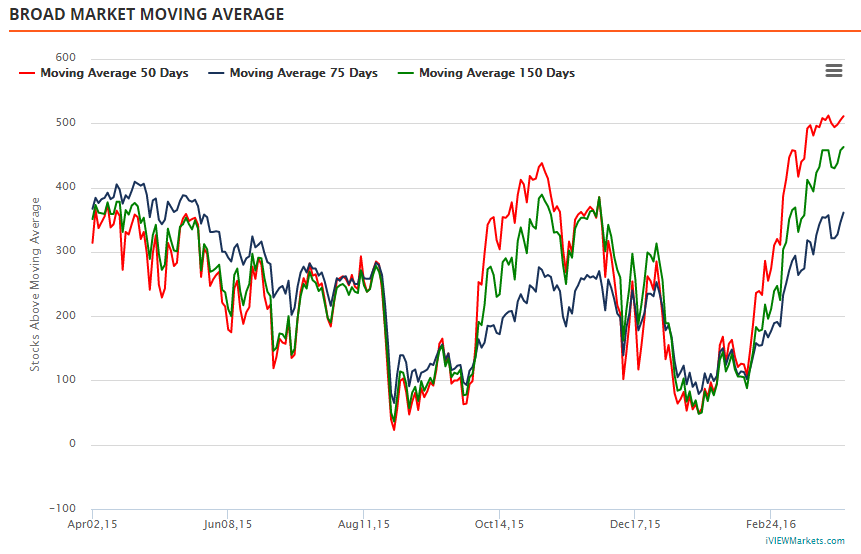
The same is currently seen with the number of stocks trading above their respective moving averages. Note that current levels exceed those seen during the October/November advance last year.
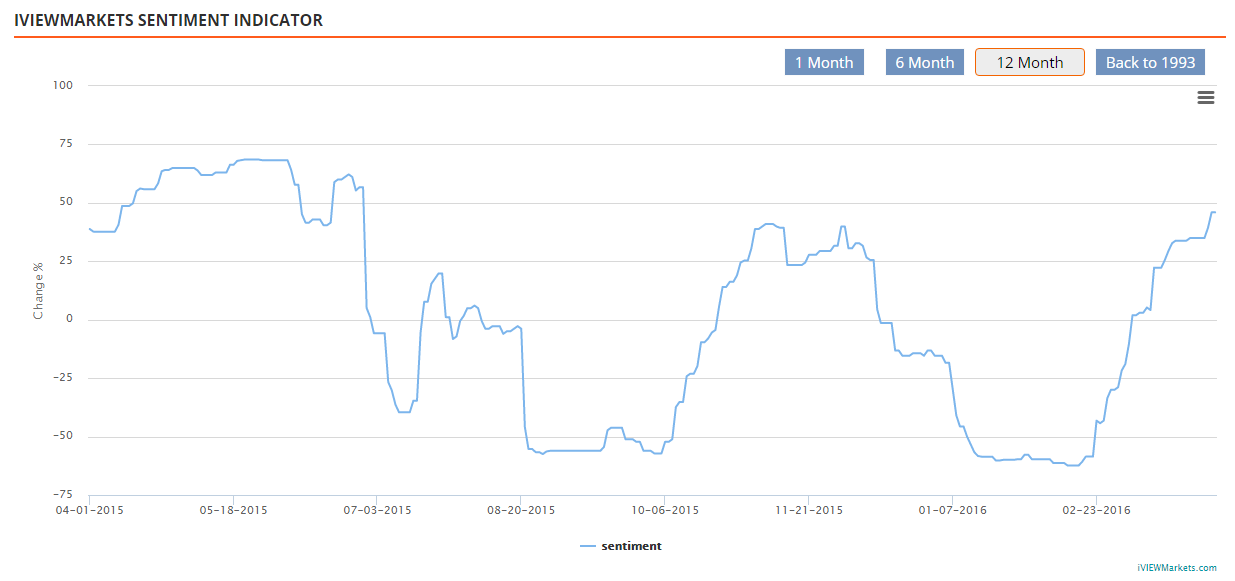
Investor sentiment has also reached levels that have normally been associated with short-term peaks in market advances.
While the technical underpinnings of the market have improved short-term, the risk of increasing equity exposure this coming week is not favorable. However, on a pullback to support, currently 2000-2020 on the S&P 500, a tactical increase to equity exposure in the strongest sectors of the market may be viable.

Currently, Utilities, Staples, Industrial Goods, Discretionary, Technology & Materials are the most viable options. There is still too much short-term risk within the Energy, Healthcare, and Financial sectors to be aggressively allocated in these areas.
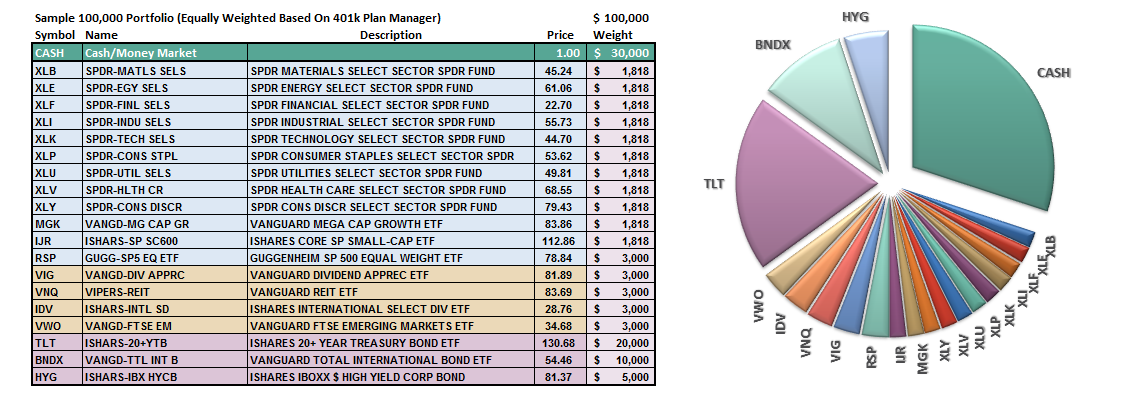
S.A.R.M. Model Allocation
The Sector Allocation Rotation Model (SARM) is an example of a basic well-diversified portfolio. The purpose of the model is to look “under the hood” of a portfolio to see what parts of the engine are driving returns versus detracting from it. From this analysis, we can then determine where to overweight sectors which are leading performance, reduce in areas lagging, and eliminate those areas that are dragging.
Over the last couple of weeks, RISK based sectors have improved somewhat while SAFETY sectors have weakened. This is something I suggested had to occur previously as defensive sectors were extremely extended in terms of relative performance measures.
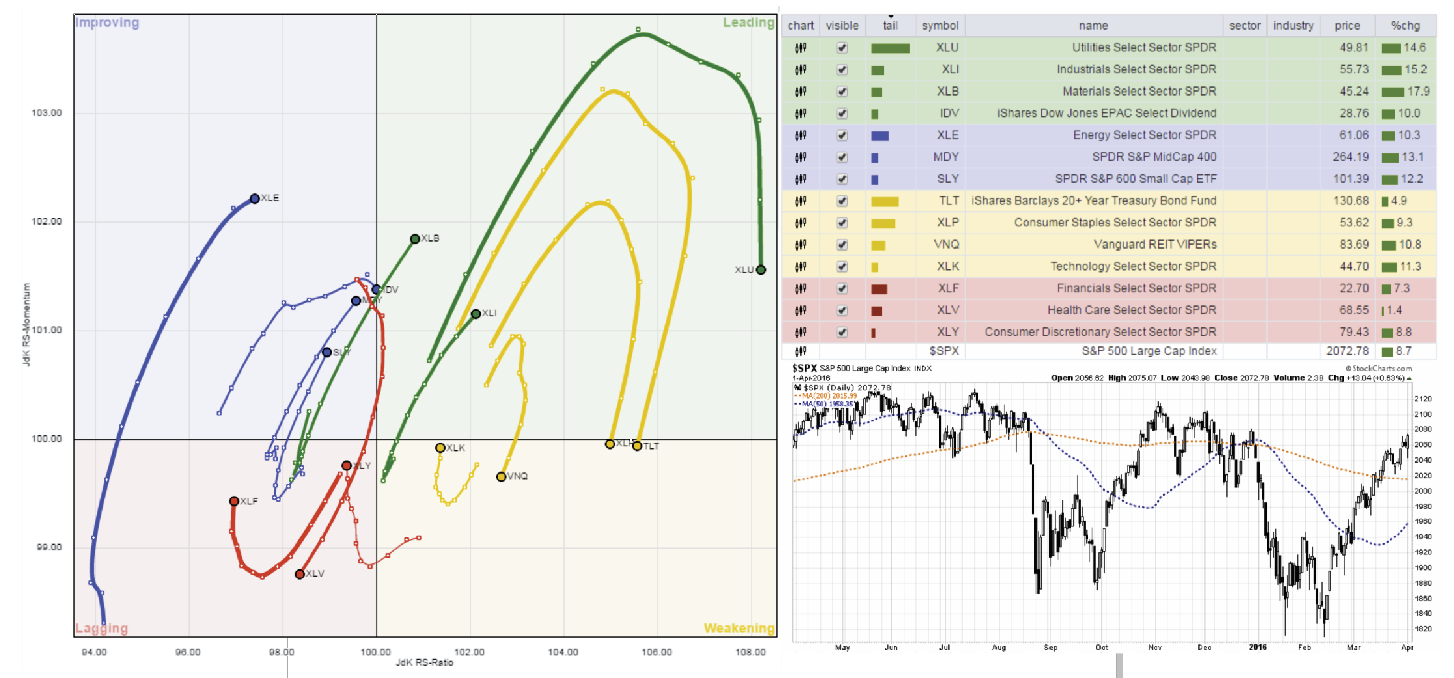
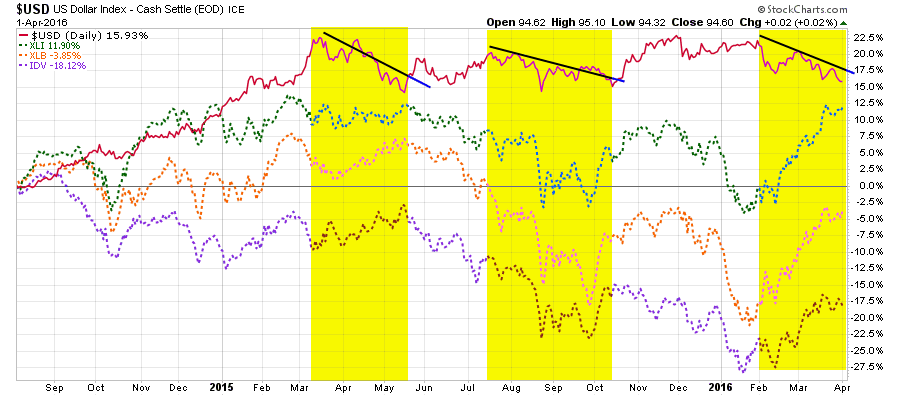
Industrials, Materials, and International sectors have been leading the charge over the last couple of weeks due to the decline in the US dollar. Interestingly, while the dollar has weakened somewhat, it is still well within the confines of its recent trading pattern. Furthermore, the recent advance in these sectors is out-sized relative to the previous declines in the dollar last year which suggests a short-covering squeeze in play.
Energy, Mid-Cap, and Small-Cap stocks have improved but are still lagging the S&P 500 index as a whole. Mid and Small-Cap sectors are also still well within a major downtrend. Furthermore, the companies that comprise the indices are most susceptible to economic weakness so caution is highly advised.
Not surprisingly, the SAFETY sectors have begun to lag the broader market with Bonds, Staples, REIT’s slowing their advance. I suggested adding bonds to portfolios several weeks ago when yields approached 2% and to date that has been a good call. I still suspect we will retest yield lows, or set new lows, by fall of this year.
Technology is trying to improve in the last week but is still lagging the S&P 500 as a whole.
Financial, Healthcare and Discretionary companies continue to lag at this point. While Discretionary stocks performance has improved in recent days, it is still too early to increase weightings to the sector currently.
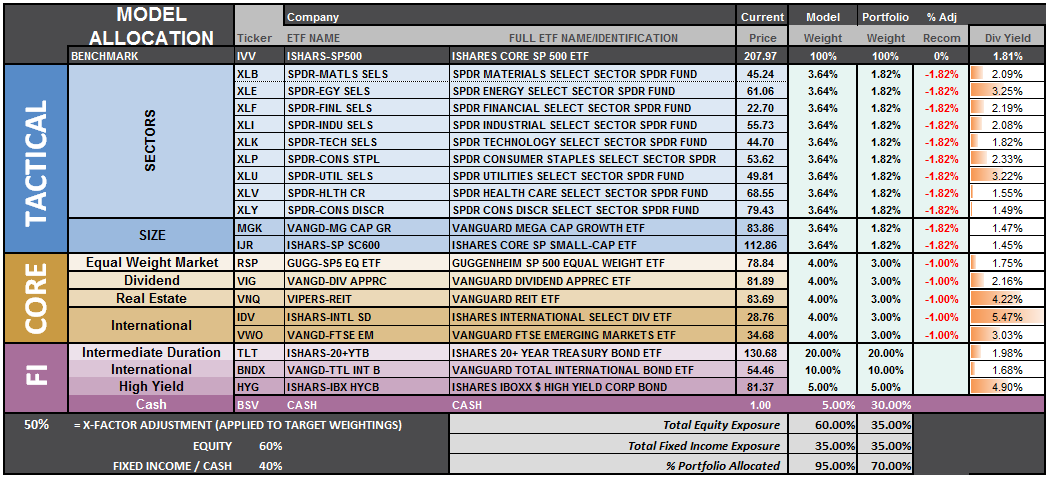
I am updating the S.A.R.M. model to reflect potential portfolio allocation changes provided the market takes a slight breather to reduce the extreme overbought conditions that currently exist. This would move the current model allocation exposure back to 50% of Target Weightings in an equally weighted portfolio.
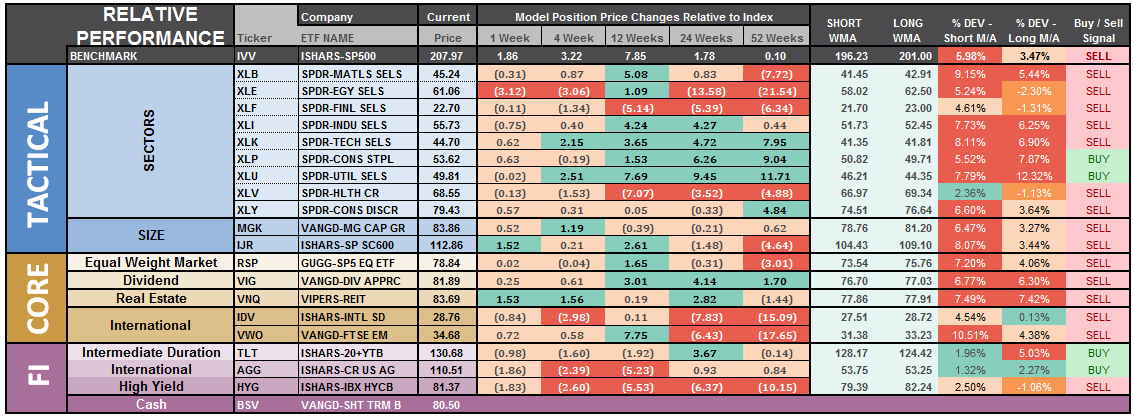
The relative performance of each section of the model is then compared to the S&P 500 for relative performance. Interestingly, despite a “strong March rally”, sectors that were strongly leading the S&P 500 have now begun to lag a bit suggesting weakness is creeping in. More importantly, most sectors are still on longer term “sell signals” as the weekly moving averages remain negatively crossed. A confirmation of a resumed bull market will be validated when the majority of “risk-based” sectors are positively biased.
However, if the market does allow for an increase in equity exposure through a consolidation process, an increase in the model allocation to 50% of target weights will take model allocations to the following:
However, as of this week, the portfolio model remains unchanged with CASH to 50%, 35% in bonds, and 15% in equities. Again, if the markets pull back to support, without violation of said support, I will suggest an increase in equity allocations.
This aligns with what I said in the previous newsletter:
“It is completely OKAY if your current allocation to cash is different based on your personal risk tolerance. This is just a guide.
If the market can pull back and establish a higher low AND simultaneously move the markets back into an oversold condition, such would likely provide a reasonable opportunity to increase short-term equity exposure.
However, for longer-term investors, we need to see an improvement in the fundamental and economic backdrop to support a resumption of the bullish trend. Currently, there is no evidence of that occurring.”
I am in the process of revamping both the Monday Morning Call (MMC) and 401k Plan Manager to provide better analysis for both more active traders and longer-term investors.
This week, I am excited to announce that www.iviewmarkets.com has been gracious enough to allow me to reproduce some of their excellent tools. I encourage you to check out their free site as it is rife with great analysis on everything from major markets to sector ETF’s and individual equities with a focus on providing analytical tools to better understand: Sector Rotation, Asset Class Analysis, Portfolio and Holding Analysis.


