Written by Lance Roberts, Clarity Financial
As I stated last week:
“I will readily admit that the recent rally over the last couple of weeks has certainly had me second guessing myself. I am human after all and am subject to the evils of emotional bias just as anyone is.”

This is where having a strict investment discipline is tested. When markets rally strongly, the inclination by most is to ignore their discipline and chase markets. During bullish trending markets, such lapses in discipline are forgiven by steadily rising markets. However, during bear markets, such deviations are often brutally punished.
Question:
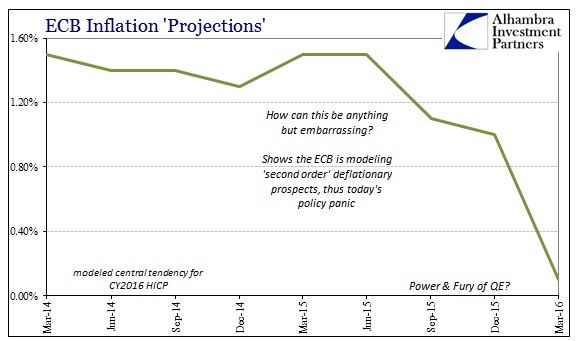
If bull markets are a function of earnings growth, increased optimism and strengthening economic trends, then why did the ECB feel the need to drop a nuclear liquidity bomb?
Jeffrey Snider via Alhambra Partners may have the answer:
“The ECB panicked. Not only did QE fail to ignite inflation, the second order indications, modeled or real, suggest the real economy is in much, much worse shape than thought just a few months ago. The timing is not coincidental, as again there was a palpable global change starting around mid-year last year, cemented by the events of August and now January. It’s bad enough in policy terms (in reality, the ECB’s ineptness is the bright side in the real economy as should be apparent by what the Bank of Japan did to the Japanese people) to see any calendar year at about zero “inflation” as 2015, but to suggest and model that to repeat for a second? Disaster.”
WAITING FOR CHANGE
As discussed throughout this weekend’s missive, there is ample evidence suggesting a more cautionary approach remains the correct course of action for now. Therefore, we continue to wait, watch and prepare.
As stated last week:
“There is now little for us to do except to wait, and watch patiently, for the market to either confirm a ‘bear market,’ OR stabilize and begin to rebuild the bullish supports necessary to allow equity risk to once again be increased.”
Neither situation will make itself apparent in short order, so relax as we let the market dictate what actions we take next. “Guessing” at the markets has not typically been a successful and repeatable strategy. As stated above, while very short-term indicators have improved, the longer-term signals have not.
BONDS LOOK ATTRACTIVE
While stocks have had a significant surge recently, that short-covering and momentum push has shifted money out of bonds (safety) and back into equities (risk). This is something I specifically noted in last week’s missive “Is It Time To Buy Bonds?”
“This analysis also suggests that the current correction in stocks is likely not over as of yet in the longer term. However, in the very short-term, the current oversold condition in rates suggests that the current “bear market rally”could last through the month of March. Such would not be surprising following a rather brutal first two months of the year.
However, as we approach summer, the seasonal weakness of the markets will likely resurface and bonds will once again become a safe haven for investors against further market declines.”
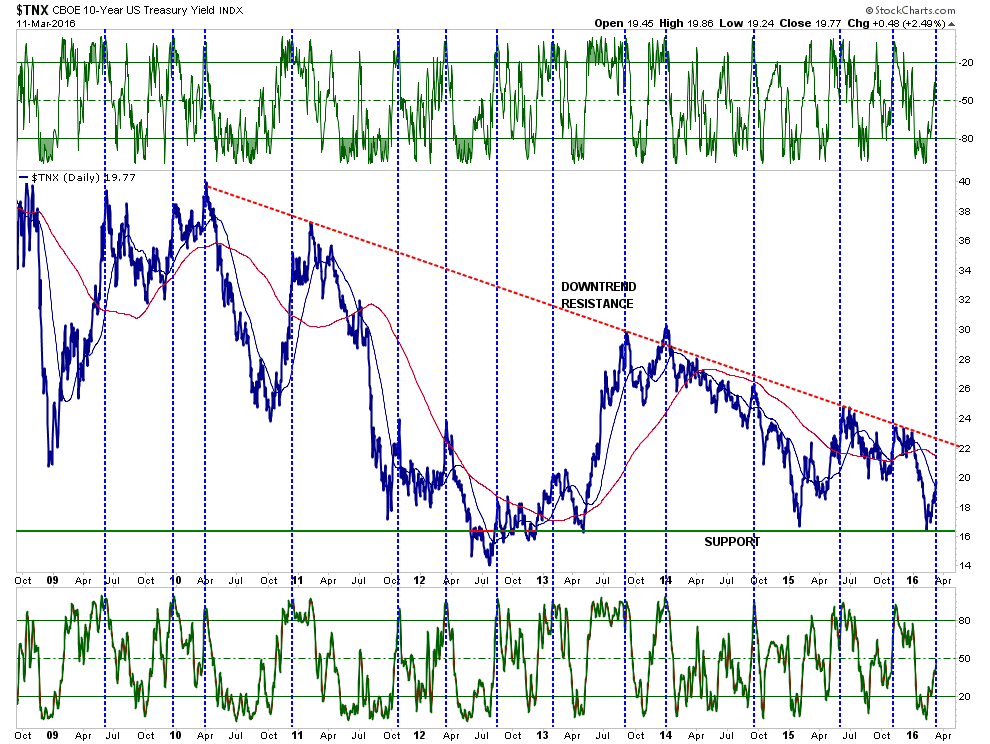
With interest rates back into overbought territory temporarily, the flight from “safety” to “risk” may be nearing its end. While rates could very conceivably push from Friday’s close of 1.98% to somewhere between 2.1% and 2.2%, such is not much room to play with.
Therefore, I am beginning to scale into short and intermediate duration bonds over the next couple of weeks as rates continue to push slightly higher. I expect that I will be well rewarded by the end of this year as rates reflect the current underlying economic fundamentals and retest recent lows or lower.
Like every Mom in the world has said at one time or another:
“Before you turn your nose up at those, try them first. You might just like them.”
S.A.R.M. Model Allocation
Working With A Model Allocation
NOTE: The following is for example purposes ONLY. It is in no way a suggestion, recommendation, or implication as to any portfolio allocation model currently in use. It is simply an illustration of how to overweight or underweight a model allocation structure.
Again, this is just for educational purposes, and I am not making any specific recommendations. This is simply a guide to assist you in thinking about your own personal positioning, how much risk you are willing to take and what your expectations are. The closer you want to track the S&P 500 Index, the less fixed income, real estate and cash your portfolio should have. For a more conservative allocation reduce allocations to equities and add more to cash and fixed income.
S.A.R.M. Current
The Sector Allocation Rotation Model (SARM) is an example of a basic well-diversified portfolio. The purpose of the model is to look “under the hood” of a portfolio to see what parts of the engine are driving returns versus detracting from it. From this analysis, we can then determine where to overweight sectors which are leading performance, reduce in areas lagging, and eliminate those areas that are dragging.
First, let me show you where we were at the end of January just prior to the February trouncing. As I stated then:
“The Sector Allocation Rotation Model continues to deteriorate suggesting that markets are significantly weaker than they appear. As suggested all through this missive, any bounce, or a break of the lower support, should be SOLD into immediately.”
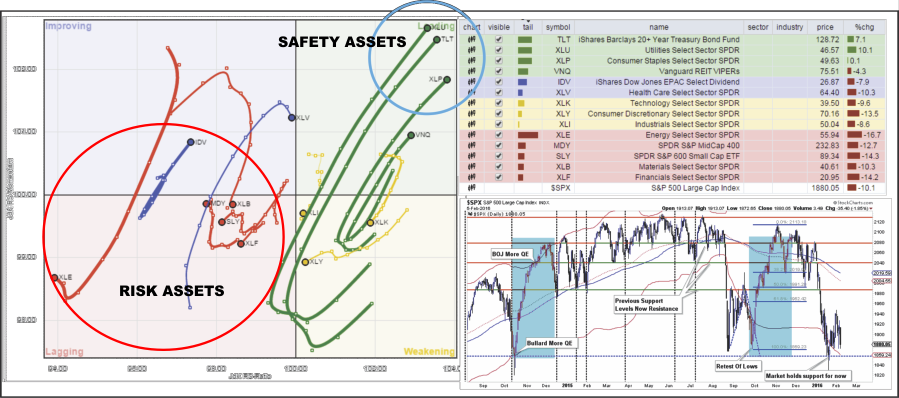
With risk assets primarily in the lagging and improving quadrants, the weak underpinnings of the market were clearly evident. Importantly, I stated then:
“Not surprisingly interest rate sensitive sectors, along with the more defensive sector of the market, Staples, surged last week as the 10-year Treasury plunged below 2%…again. The search for safe haven investments such as Utilities, Bonds, and Staples has become a more crowded trade as capital leaves the previous leaders of Technology, Industrial and Discretionary sectors.
As noted by the BLUE circle above, the current level of outperformance by Utilities, Bonds & Staples is unsustainable. You should take profits in these sectors immediately and reduce overweighted positions back to normal levels. (This is the essence of profit taking.)”
As noted above, I am now recommending beginning to scale back into “bonds” as the recent uptick in rates has reduced that overbought condition and have taken bonds to an underweight position in portfolios by reducing prices.
Here is the updated SARM model.
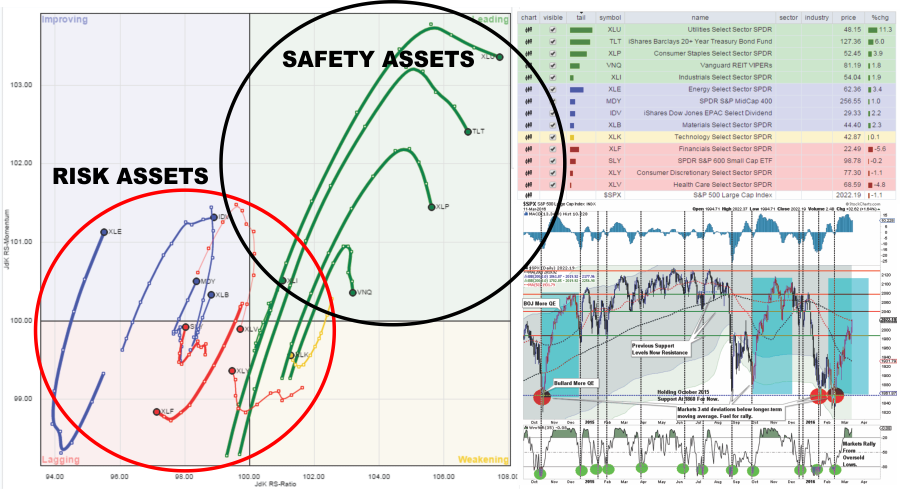
You will note that despite the recent rally, not much has changed since the end of January. Yes, risk assets have improved against safety assets, but not as significantly as one might expect given the sizable rally over the last several weeks.
With markets once again back to extremely overbought conditions, and fighting a declining 200-dma, the advantage of adding significantly to risk assets at this juncture is likely not advisable.
Therefore, there have been no changes to S.A.R.M. model in the past week.
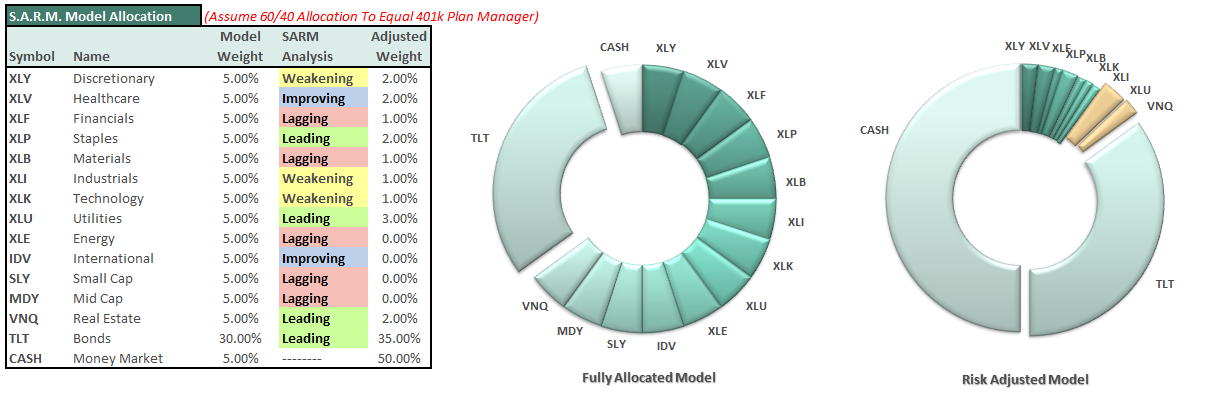
The portfolio model remains unchanged this week with CASH to 50%, 35% in bonds, and 15% in equities.
It is completely OKAY if your current allocation to cash is different based on your personal risk tolerance. This is just a guide.
If the market can pull back and form a bottom at the 50-dma (establishing a higher low) and move the markets back into an oversold condition in the process, such would likely provide a reasonable opportunity to increase short-term equity exposure.
However, for longer-term investors, we need to see an improvement in the fundamental and economic backdrop to support a resumption of the bullish trend. Currently, there is no evidence of that occurring. Such is critically important as economic growth is directly related to P/E growth and stock market returns. This is because earnings/profit growth is directly linked to economic growth. Therefore, over the course of a full-market cycle, corporate profits cannot indefinitely grow faster than the economy.
“Money follows earnings.” – David Dreman


