by Lance Roberts, Clarity Financial
Finally A Bounce
As discussed last weekend at length, the markets are currently exhibiting all the traits of a “correction action.” During these discussions, I have reiterated that you should not “panic sell” into the decline but instead take a disciplined approach to exiting the markets.

To wit:
“I know as I write this, that come Monday morning my inbox will be flooded with emails asking if it’s time to go to ‘all cash.’
No. I NEVER suggest being in ‘all cash.’ From a management standpoint, this is never a good idea. Trying to ‘time the market’ is impossible over the long-term and leads to very poor emotionally based decision making. However, as I regularly write, it is our job to reduce portfolio risk to manageable levels to preserve capital over time. We can do that by increasing and reducing our exposure to equity-related risk by paying attention to the price trends of the market.
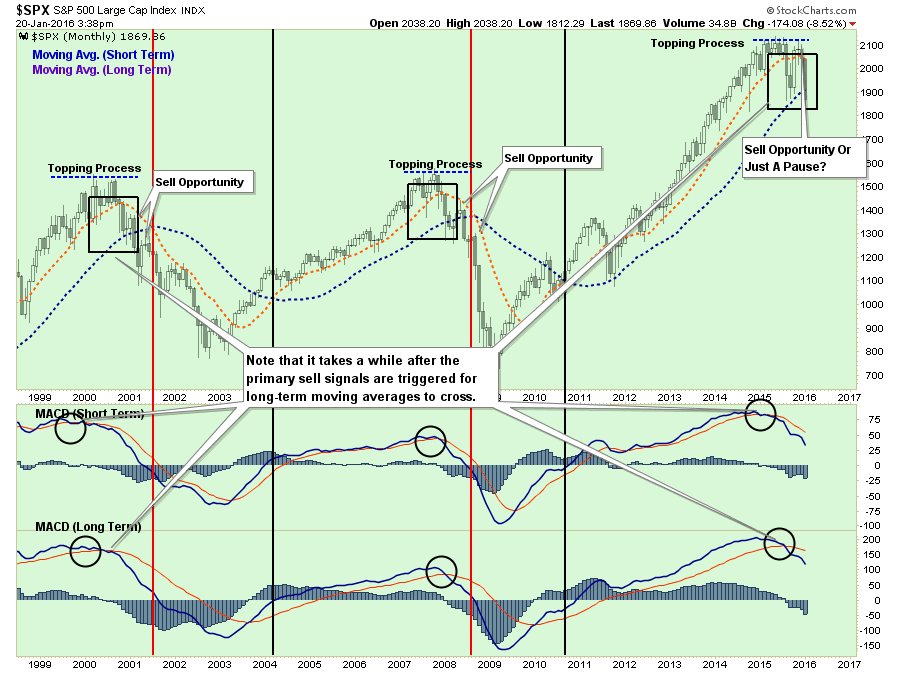
By the time the markets register important “sell signals” denoting a change from the bullish to bearish trend, the markets are generally oversold from the previous selling. This is, as shown in the chart below, always the case.”
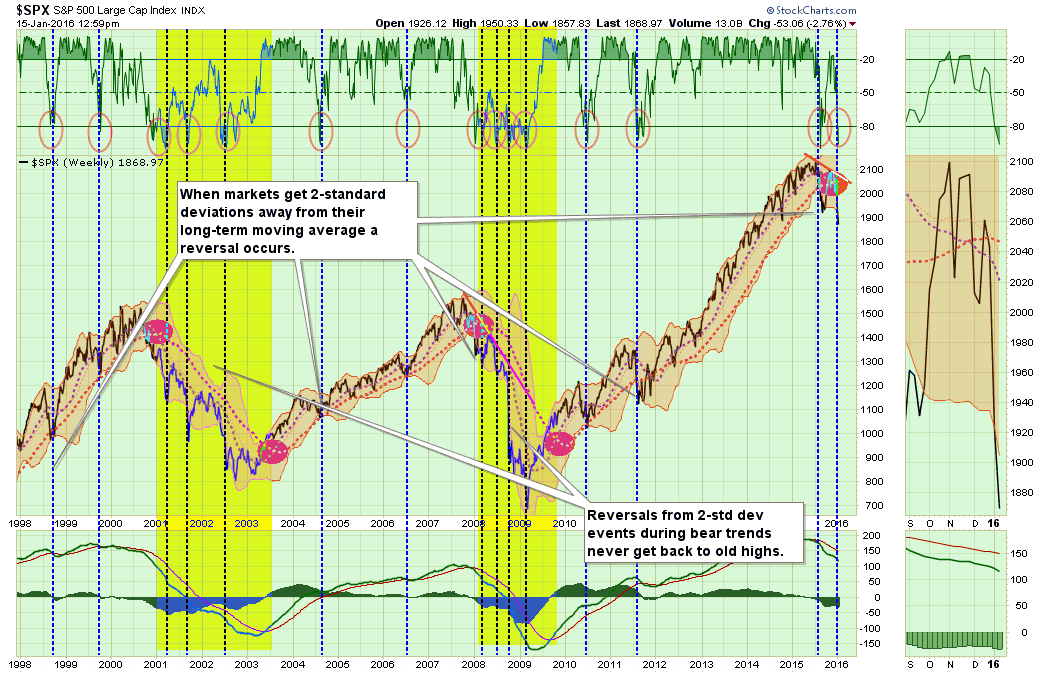
“The top section of the chart is a basic “overbought / oversold” indicator with extreme levels of “oversold” conditions circled. The shaded area on the main part of the chart represents 2-standard deviations of price movement above and below the short-term moving average.
There a couple of very important things to take away from this chart. When markets begin a “bear market” cycle [which is identified by a moving average crossover (red circles) combined with a MACD sell-signal (lower part of chart)], the market remains in an oversold condition for extended periods (yellow highlighted areas.)
More importantly, during these corrective cycles, market rallies fail to reach higher levels than the previous rally as the negative trend is reinforced. All of these conditions currently exist.
Does this mean that the markets will go straight down 20% without a bounce? Anything is possible. However, history suggests that even during bear market cycles investors should be patient and allow rallies to occur before making adjustments to portfolio risk. More often than not, it will keep you from panic selling a short-term market bottom.
Good News – Support Holds
While the markets were certainly volatile mid-week, with the Dow Jones Industrial Average plunging nearly 600 points on Wednesday, the recovery from those intra-day lows into the end of the week erased those losses.
This intra-week volatility is specifically why I focus on WEEKLY data when managing portfolios. If you are a very short-term trader, using very short time-frames are useful for swing trading markets. However, if you are truly a longer-term investor, slowing price trends down by using weekly or monthly time frames reduces the volatility that tends to lead to “emotionally driven decisions.”
Let me show you an example:
Using DAILY price analysis would have clearly told you to sell last week when the markets broke their support going back to the 2014 October lows.
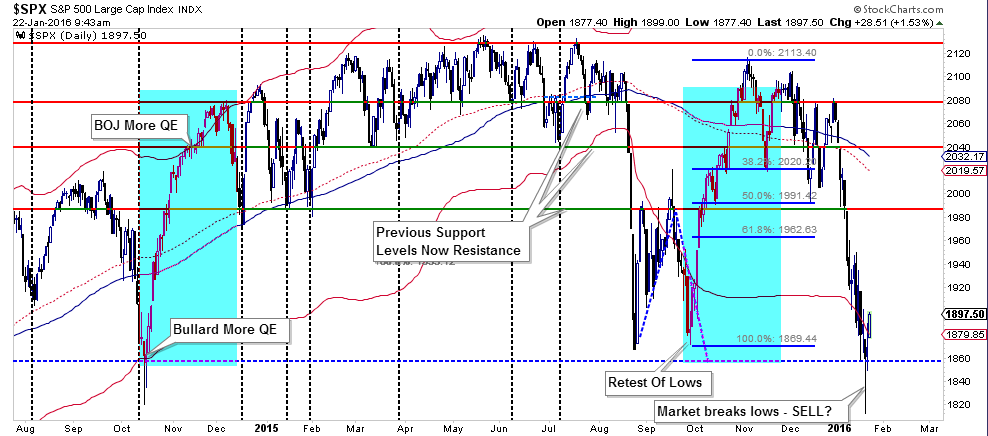
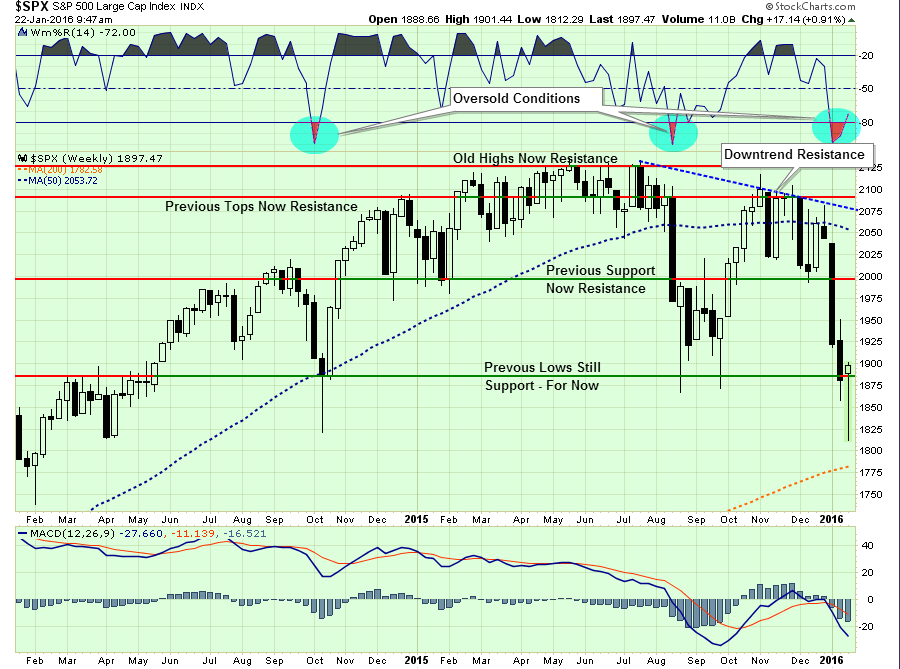
However, if we step back and look at WEEKLY price analysis, the reversal in the market shows that support has indeed held. Furthermore, with the markets VERY oversold currently, the expected bounce is likely starting now.
So, the next obvious question is:
“How big of a bounce should we expect to sell into?”
Measuring Retracements
The chart below is the daily overbought/sold status of the market. I wrote last week:
“In particular note the top and bottom portions of the chart. These two indicators measure the ‘over bought’ and ‘over sold’ conditions of the market. You will notice that when these indicators get stretched to the downside, there is an effective ‘snap back’ in fairly short order.”
It is that very oversold condition that has continually suggested that something would happen to elicit a short-term retracement in the market. Not to be disappointed it was the promise of more liquidity by the ECB and Mario Draghi that elicited a massive short-covering rally on Friday.
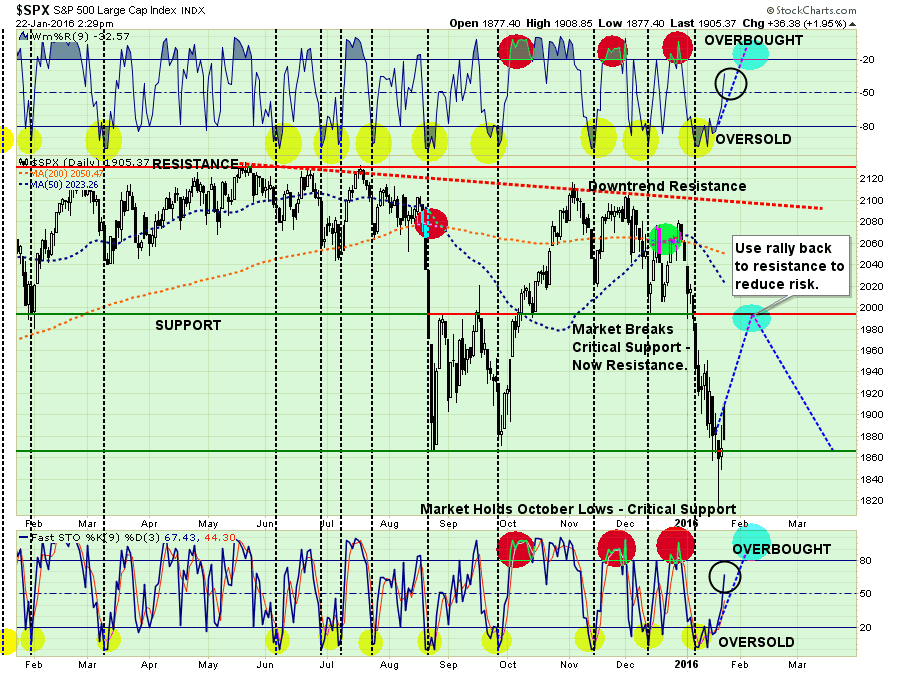
That is the good news. The bad news is, as shown by the hollow black circles, this small market recovery has already resolved more than half of the previous overbought condition.
The chart below lays out three potential targets for the current reflexive rally. IMPORTANTLY, there is no guarantee that these mathematical retracement levels will be precise. Therefore, it is better to use these levels as a general AREA to begin reducing equity risk exposure accordingly.
1970ish – Sell laggards and losers in portfolios.
(You know the one’s, the one’s you secretly keep hoping will come back.)
2000ish – Trim back winners to target levels
2030ish – Final position cleanup.
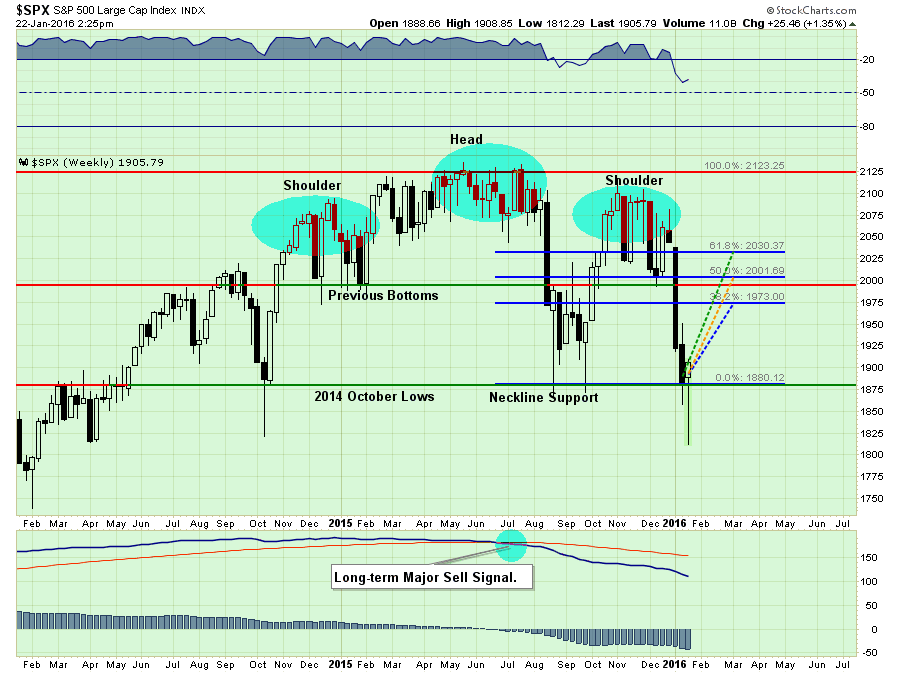
NOTE: For conservative investors it is currently unlikely the market will rise much more than between 1970-1990 during this rally. I would do the majority of your portfolio rebalancing and risk reduction in this range.
Notice also, that the market has now traced out a fairly definitive “head and shoulder’s” technical pattern similar to that seen in 2008. If this rally fails, and breaks neckline support, the market will be in a confirmed bear market.
This Looks A Whole Lot Like 2008
For the last several months I have repeatedly discussed the topping process in the markets and warned against dismissing the current market action lightly. To wit:
“Typically bubbles have an asymmetric shape. The boom is long and slow to start. It accelerates gradually until it flattens out again during the twilight period. The bust is short and steep because it involves the forced liquidation of unsound positions.
The chart below is an example of asymmetric bubbles.
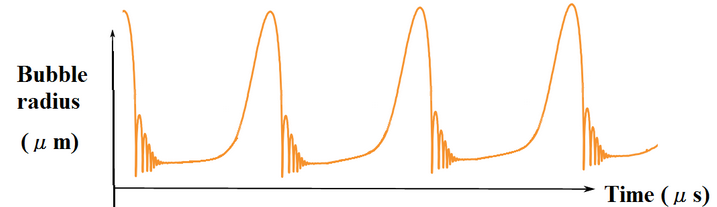
The pattern of bubbles is interesting because it changes the argument from a fundamental view to a technical view. Prices reflect the psychology of the market which can create a feedback loop between the markets and fundamentals.
This pattern of bubbles can be clearly seen at every bull market peak in history.“
Take a look at the graphic above, and the one below. See any similarities?
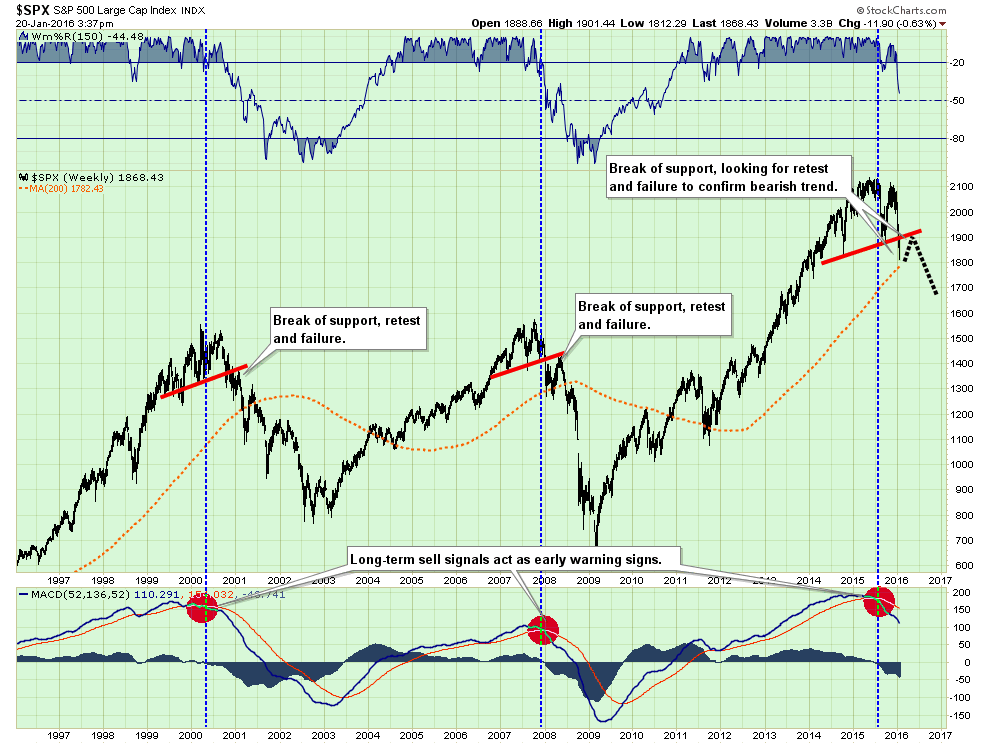
As you will notice, the previous two bull-market cycles ended when the topping process ended by breaking the rising support levels (red line). The confirmation of the onset of the “bear market” was marked by a failed rally back to the previous rising support level. Currently, that has not occurred as of yet.
The next chart is another variation of the above showing the break-down of the rising bullish trend in the market. In all cases, investors were given minor opportunities to reduce equity risk in portfolios well before the onset of the bear market decline.
Importantly, as I discussed above, the current “relief rally” will most likely be short-lived and will likely fail to get investors “back to where they were previously.”
It is not advisable to try and “game the rally.” The risk to the downside has risen markedly in recent weeks as the technical, fundamental and economic deterioration escalates. This is not a time to be complacent with your investments.
How you personally manage your investments is up to you, and I am only suggesting a few guidelines to rebalance portfolio risk accordingly. However, the risk of being long a tremendous amount of equity risk is no longer as advantageous as it once was.
This could all change, of course, if the Federal Reserve leaps into action with a rate cut, another liquidity program or direct market intervention.
If I am wrong and the market does revert back to a bullish trend, it is simply a matter of adding equity exposure back into portfolio allocations. However, the more important concern for long-term investors is what if I am right?


