by Lance Roberts, Clarity Financial
From last week:
“Over the last couple of months, I have repeatedly discussed the deterioration of market breadth, momentum and the fundamental backdrop of the markets.

Read the following posts to catch up:
Along with these warnings, I have continually suggested a health regimen of portfolio rebalancing, profit taking and risk controls in this weekly missive: To wit:
Trim back winning positions to original portfolio weights: Investment Rule: Let Winners Run
Sell positions that simply are not working (if the position was not working in a rising market, it likely won’t in a declining market.) Investment Rule: Cut Losers Short
Hold the cash raised from these activities until the next buying opportunity occurs. Investment Rule: Buy Low
As I have discussed many times in the past, the trend of the market is still positive and there is no reason to become extremely defensive as of yet. However, this does not mean to become complacent in your portfolio management practices either.”
It is that last paragraph that I want to focus on with you today.
No Bull, No Bear
Let me clarify something before I go further into this week’s missive.
In the media, and on Wall Street, there is an overwhelming push to classify views as either bullish or bearish. This is a VERY dangerous thing for investors.
The reason I say this is that since, in the words of Bob Farrell, “bull markets are more fun than bear markets,” investors tend to seek out “bullish” commentary to support their “hopes” of a continually rising bull market. The danger, as I have addressed in the past, is that individuals become “willfully blinded” to data that does not conform to their personal biases. This bias of seeking out only “confirming data,” known as confirmation bias, leads to decision making that is ultimately prone to error.
While I am personally tagged as a “bear” because I discuss not so optimistic views of the market and point out inherent risk, I assure you I am NOT a bear. I am also NOT a bull. I simply look at the relevant data and make determinations of risk based on historical precedents and statistical data.
As a portfolio manager of OTHER PEOPLE’S money, my biggest concern is not how much money I can make during market advances, but rather how much I keep from losing during market declines. While this seems counter-intuitive, it reality it is where long-term gains are actually generated. As William Lippman once quipped:
“Better to preserve capital on the downside rather than outperform on the upside”
However, it is this focus on capital conservation and risk management that gets me habitually tagged as a “bear.” If that is the case, so be it – I will gladly wear that moniker if that leads to better outcomes for those I work for.
The reason, I say this is because it simply comes down to the math. As I wrote last week:
“The reason that portfolio risk management is so crucial is that it is not “missing the 10-best days” that is important, it is “missing the 10-worst days.” The chart below shows the comparison of $100,000 invested in the S&P 500 Index (log scale base 2) and the return when adjusted for missing the 10 best and worst days.”
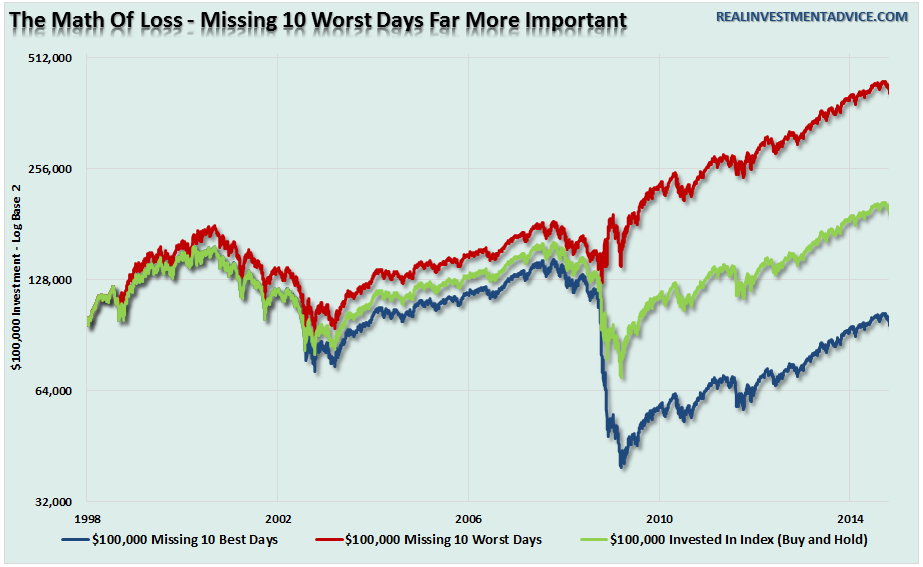
“Clearly, avoiding major draw-downs in the market is key to long-term investment success. If I am not spending the bulk of my time making up previous losses in my portfolio, I spend more time compounding my invested dollars towards my long-term goals.”
Let me reiterate this point. A strict discipline of portfolio risk management will NOT eliminate all losses in portfolios. However, it will minimize the capital destruction to a level that can be dealt with logically, rather than emotionally.
In the end, it does not matter IF you are “bullish” or “bearish.” The reality is that both “bulls” and “bears” will be owned by the full-market cycle. However, what is grossly important in achieving long-term investment success is not necessarily being “right” during the first half of the cycle, but by not being “wrong” during the second half.
The Bullish Trend Is Broken
Investing is really pretty basic and defined by two simple rules as defined by Dennis Gartman:
“In bull markets we can only be long or neutral, and in bear markets, we can only be short or neutral. That may seem self-evident; it is not, however.”
This is critically important to understand considering that the markets have very likely broken the bullish trend that begin in 2009. Take a look at the first chart below.
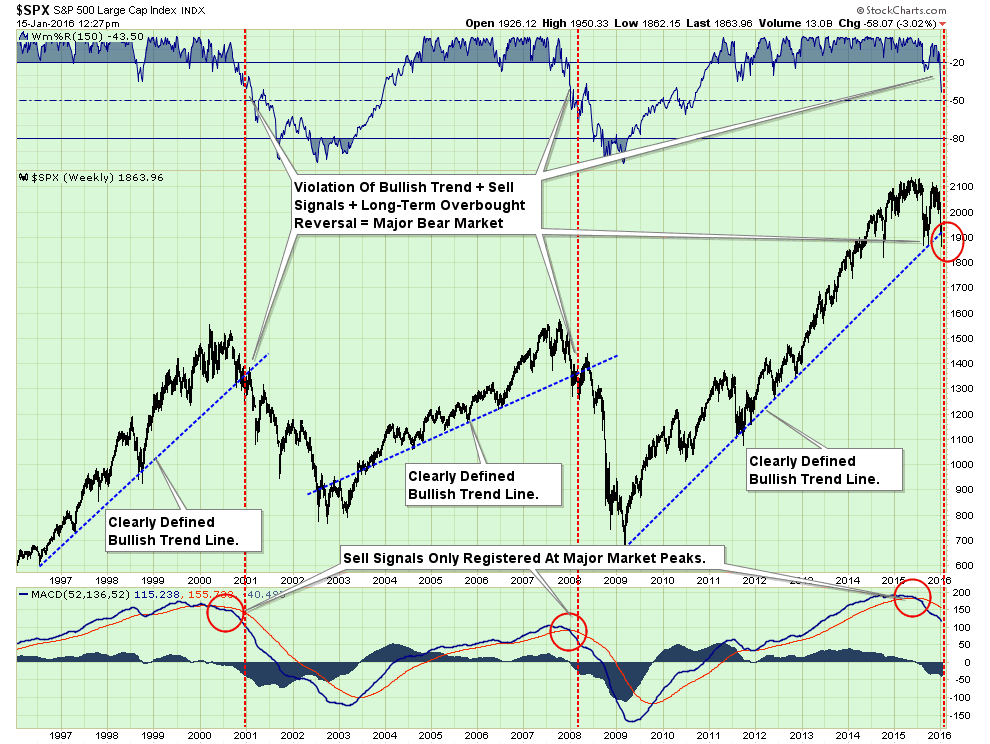
This “weekly” chart of the S&P 500 shows the bullish trends which were clearly defined during their advances in the late 1990’s, 2003-2007 and 2009-present. Each of these bullish advances, despite ongoing bullish calls to the contrary, ended rather badly with extremely similar circumstances: technical breakdowns, weakening economics, and deteriorating earnings.
As I have shown in the chart above, when the markets broke the bullish trends (blue dashed lines), the subsequent bear market occurred rather rapidly. The conversion from the bull market to the bear market was marked by a breakdown in prices and the issues of a very long-term “sell signal” as noted in the bottom of the chart.
We can look at this same analysis a little differently and see much of the same evidence.
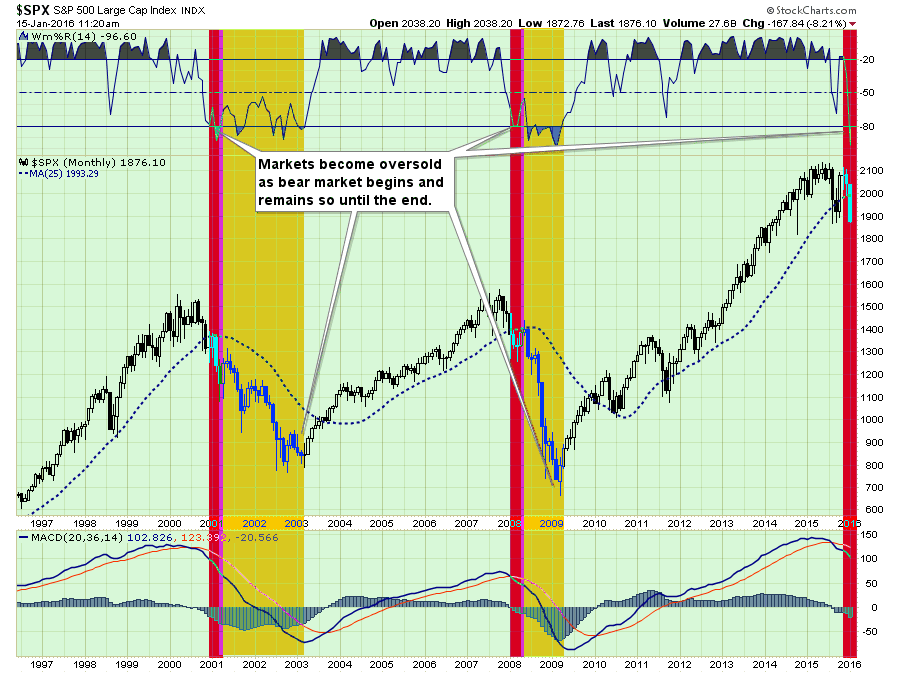
The chart above shows something I discussed this past week:
“Markets crash when they’re oversold.”
When markets break their long-term bullish trend supports combined with important long-term sell signals and a sharp decline in momentum, it has historically denoted the start of a “bearish market trend.” The red highlight denotes the start of the bear market and the yellow highlight shows the ensuing bear market completion. They are swift and brutal.
The next chart, which is the same as above, completes the analysis by pointing out the important signals showing the change in trend.

Don’t Panic, Walk To The Exits
I know as I write this, that come Monday morning my inbox will be flooded with emails asking if its time to go to “all cash.”
No. I NEVER suggest being in “all cash.” From a management standpoint, this is never a good idea. Trying to “time the market” is impossible over the long-term and leads to very poor emotionally based decision making. However, as I regularly write, it is our job to reduce portfolio risk to manageable levels to preserve capital over time. We can do that by increasing and reducing our exposure to equity-related risk by paying attention to the price trends of the market.
By the time the markets register important “sell signals” denoting a change from the bullish to bearish trend, the markets are generally oversold from the previous selling. This is, as shown in the chart below, always the case.
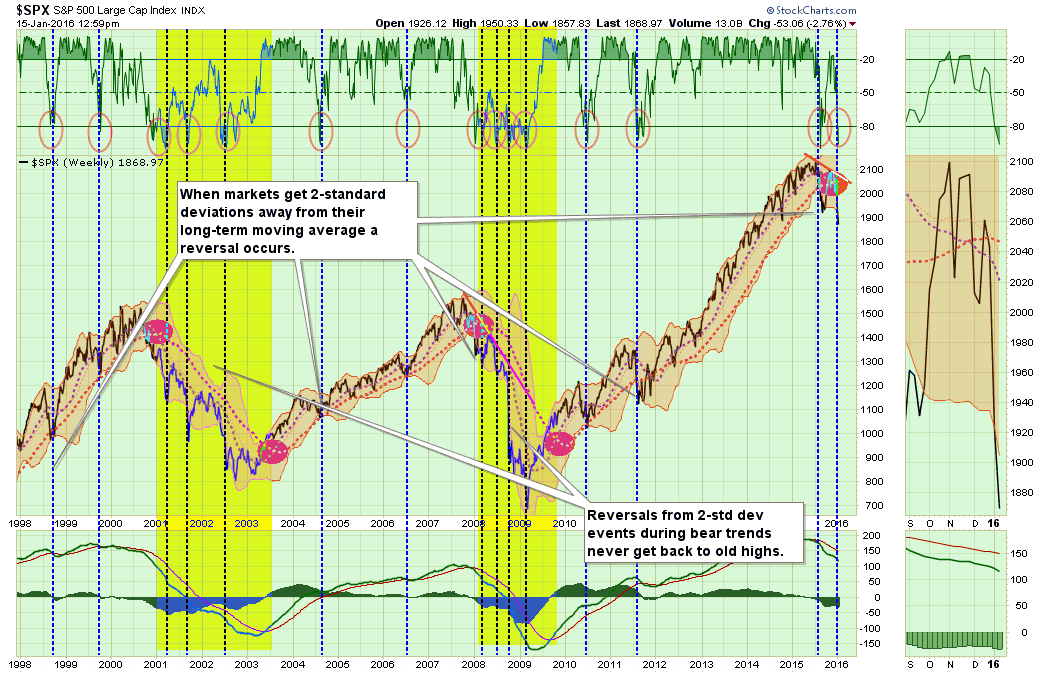
(Note: I am using weekly data to smooth volatility)
The top section of the chart is a basic “overbought / oversold” indicator with extreme levels of “oversold” conditions circled. The shaded area on the main part of the chart represents 2-standard deviations of price movement above and below the short-term moving average.
There a couple of very important things to take away from this chart. When markets begin a “bear market” cycle [which is identified by a moving average crossover (red circles) combined with a MACD sell-signal (lower part of chart)], the market remains in an oversold condition for extended periods (yellow highlighted areas.)
More importantly, during these corrective cycles, market rallies fail to reach higher levels than the previous rally as the negative trend is reinforced. All of these conditions currently exist.
Does this mean that the markets will go straight down 20% without a bounce? Anything is possible. However, history suggests that even during bear market cycles investors should be patient and allow rallies to occur before making adjustments to portfolio risk. More often than not, it will keep you from panic selling a short-term market bottom.
THE MONDAY MORNING CALL
Markets At Support
As noted above, the markets are registering the first confirmed set of monthly SELL signals since the peak of the market in late 2007. As I have stated repeatedly: Don’t Panic Sell
Take a look at the chart below.
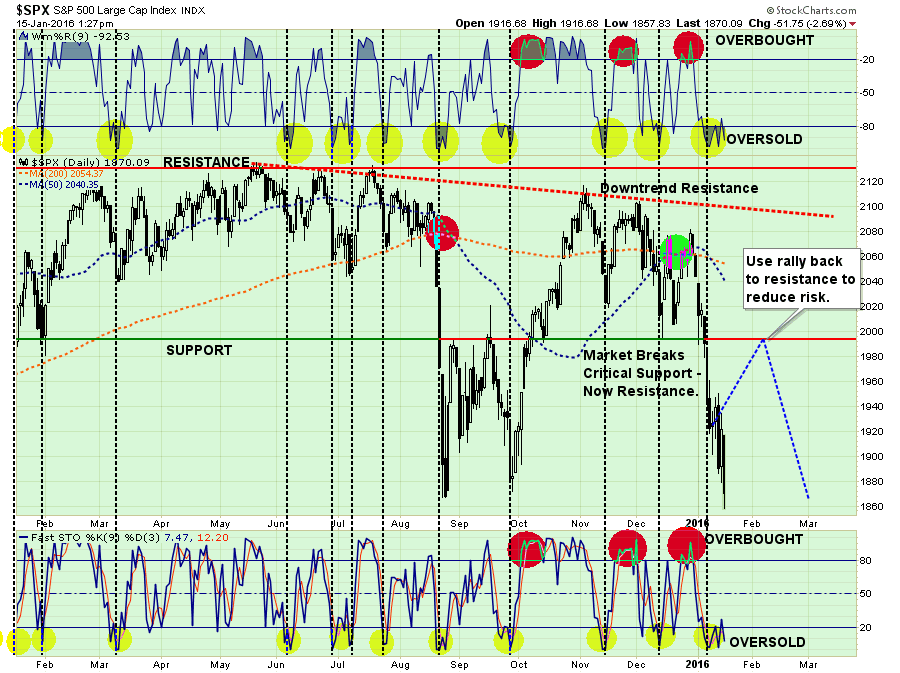
In particular note the top and bottom portions of the chart. These two indicators measure the “over bought” and “over sold” conditions of the market. You will notice that when these indicators get stretched to the downside, there is an effective “snap back” in fairly short order.
As I stated last week, chart updated from then:
“With the markets having issued multiple sell signals, broken very important support and both technical and fundamental deterioration in progress, it is suggested that investors use these “snap back” rallies to reduce equity risk in portfolios.
Let me provide you again with the rebalancing rules that I reiterated through the majority of last years newsletters as markets deteriorated from the May-June highs. That period also marks the point where I reduced equity risk in portfolios by 50% (which is where it remains currently.)
1) Trim positions that are big winners in your portfolio back to their original portfolio weightings. (ie. Take profits)
2) Positions that performed with the market should also be reduced back to original portfolio weights.
3) Move trailing stop losses up to new levels.
4) Review your portfolio allocation relative to your risk tolerance. If you are aggressively weighted in equities at this point of the market cycle, you may want to try and recall how you felt during 2008. Raise cash levels and increase fixed income accordingly to reduce relative market exposure.”
How you personally manage your investments is up to you, and I am only suggesting a few guidelines to rebalance portfolio risk accordingly. However, the risk of being long a tremendous amount of equity risk is no longer as advantageous as it once was.
This could all change, of course, if the Federal Reserve leaps into action with a rate cut, another liquidity program or direct market intervention. However, until that happens, it is better to be safe than sorry.


