by Lance Roberts, Clarity Financial
Time To Reduce Risk
The chart below is a VERY long-term look at the S&P 500 going back to 1965. It is a monthly analysis of changes in price momentum and long-term moving average support.


The vertical orange lines are when SELL signals were issued as both momentum turned negative and prices violated the long-term moving average. Conversely, the vertical blue lines are BUY signals when market dynamics reversed to the positive.
Currently, the markets are registering the first confirmed set of monthly SELL signals since the peak of the market in late 2007.
Important Note: Don’t Panic Sell
With all of the alarm bells currently triggering, the initial “emotionally” driven response is most likely an urge to go look at your portfolio statement and start pushing the “sell” button. Don’t Do It!
When working with technical analysis, particularly long-term views, by the time a “signal” is triggered, the short-term market move is already well advanced.
On a short-term basis, prices oscillate back and forth like a rubber band be pulled and let loose. Physics state that a rubber band stretched in one direction, will initially travel an equal distance in the opposite direction when released.
Take a look at the chart below.
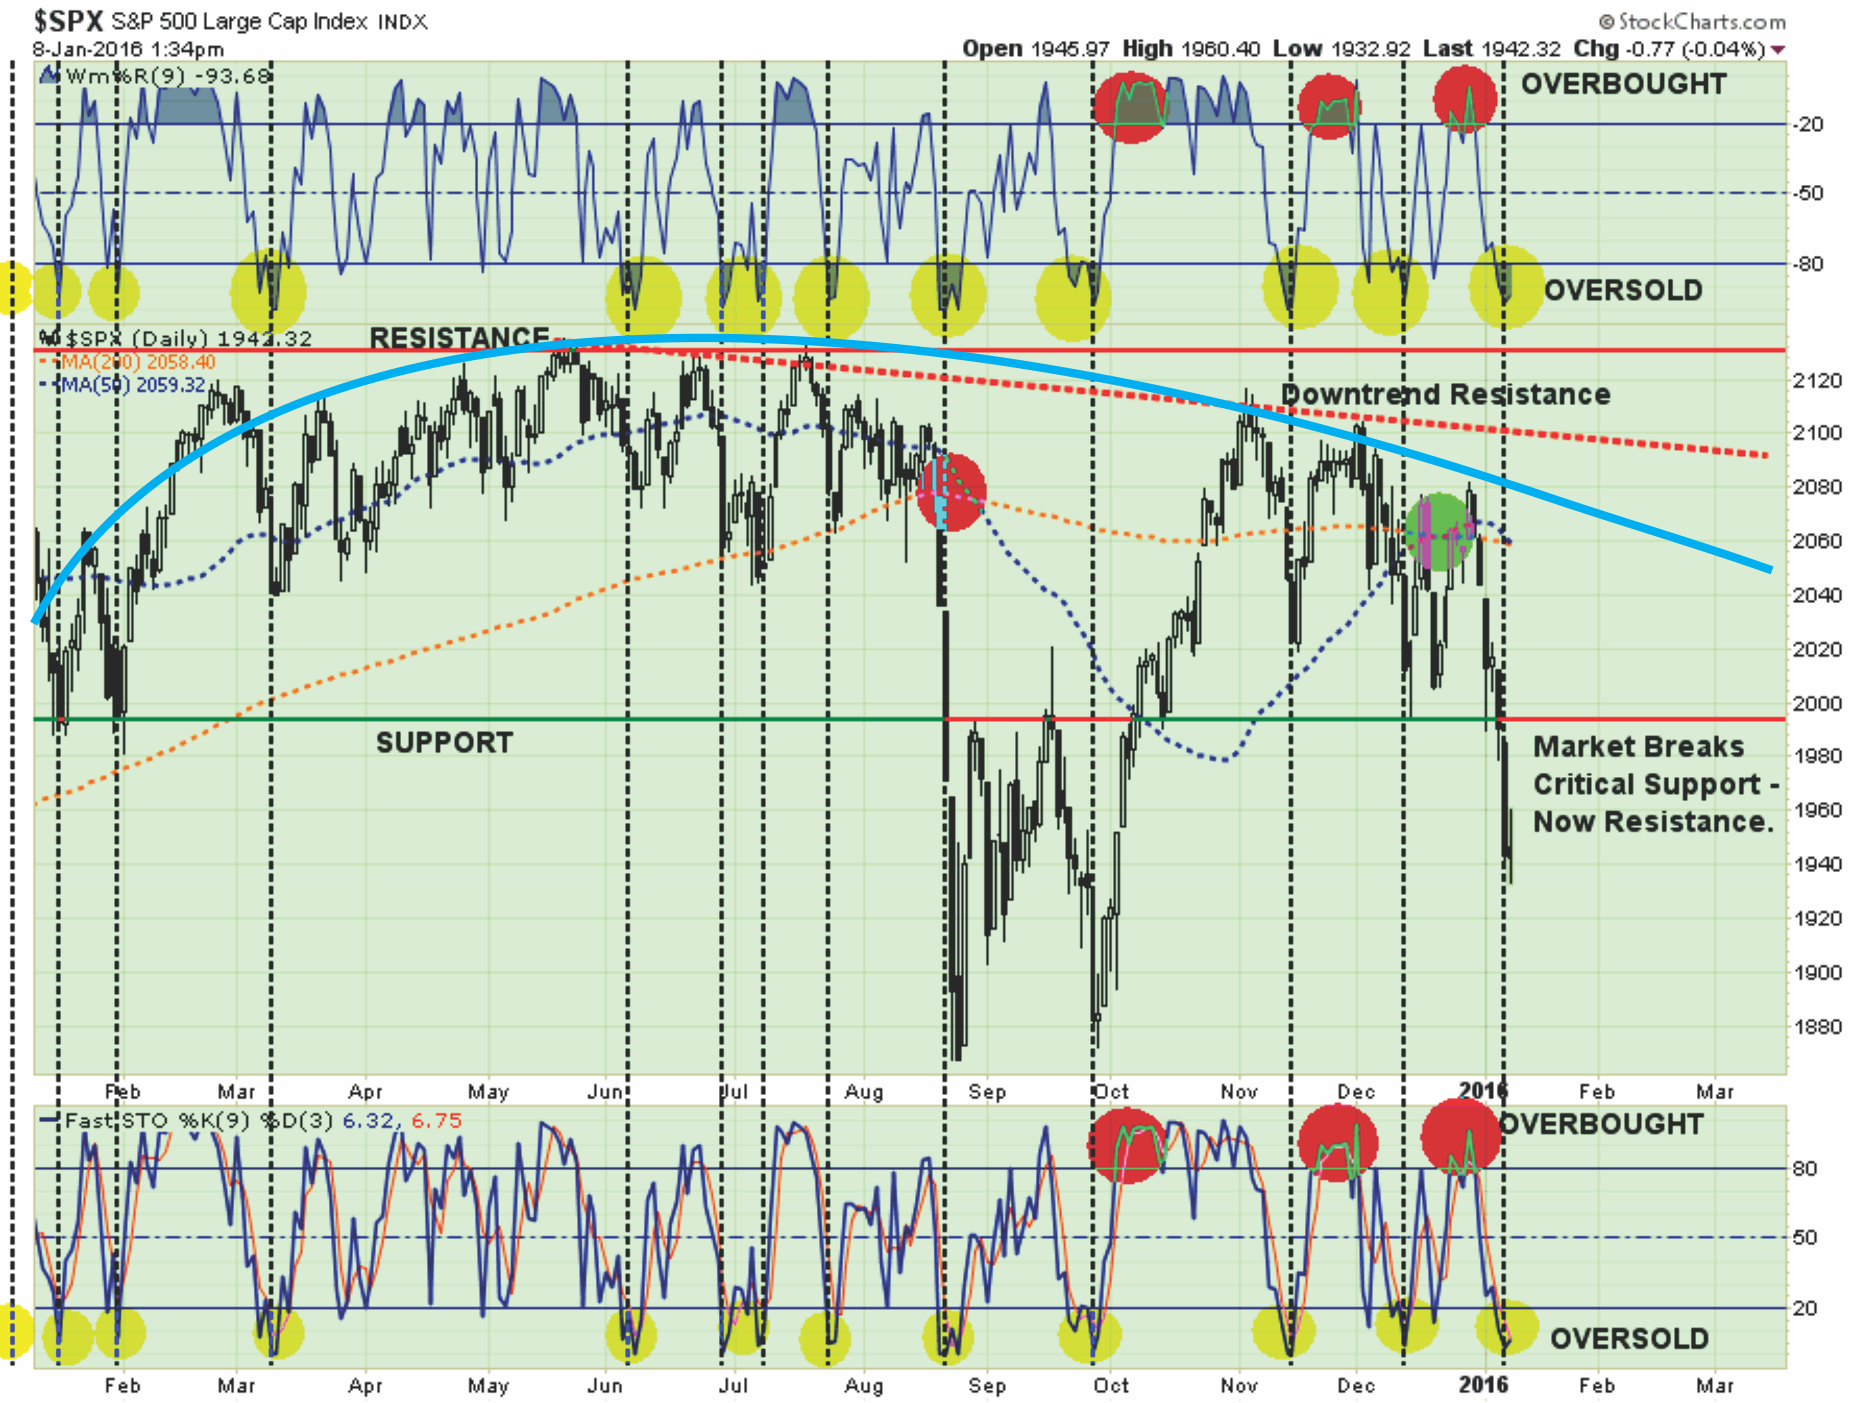
In particular note the top and bottom portions of the chart. These two indicators measure the “over bought” and “over sold” conditions of the market. As with the rubber band example above, you will notice that when these indicators get stretched to the downside, there is an effective “snap back” in fairly short order.
With the markets having issued multiple sell signals, broken very important support and both technical and fundamental deterioration in progress, it is suggested that investors use these “snap back” rallies to reduce equity risk in portfolios.
Rebalancing Rules
Let me provide you again with the rebalancing rules that I reiterated through the majority of last years newsletters as markets deteriorated from the May-June highs. That period also marks the point where I reduced equity risk in portfolios by 50% (which is where it remains currently.)
1) Trim positions that are big winners in your portfolio back to their original portfolio weightings. (ie. Take profits)
2) Positions that performed with the market should also be reduced back to original portfolio weights.
3) Move trailing stop losses up to new levels.
4) Review your portfolio allocation relative to your risk tolerance. If you are aggressively weighted in equities at this point of the market cycle, you may want to try and recall how you felt during 2008. Raise cash levels and increase fixed income accordingly to reduce relative market exposure.
How you personally manage your investments is up to you. I am only suggesting a few guidelines to rebalance portfolio risk accordingly. Therefore, use this information at your own discretion.
Working With A Model Allocation
Let’s review the model.
NOTE: The following is for example purposes ONLY. It is in no way a suggestion, recommendation, or implication as to any portfolio allocation model currently in use. It is simply an illustration of how to overweight or underweight a model allocation structure.
Again, this is just for educational purposes, and I am not making any specific recommendations. This is simply a guide to assist you in thinking about your own personal position, how much risk you are willing to take and what your expectations are. From that starting point design a base allocation model and weight it accordingly. The closer you want to track the S&P 500 Index, the less fixed income, real estate and cash your portfolio should have. For a more conservative allocation reduce allocations to equities.
Got it? Okay.
S.A.R.M. Current
The Sector Allocation Rotation Model (SARM) is an example of a basic well-diversified portfolio. The purpose of the model is to look “beneath the hood” of a portfolio to see what parts of the engine are driving returns versus detracting from it. From this analysis, we can then determine where to overweight sectors which are leading performance, reduce in areas lagging, and eliminate those areas that are dragging.
The Sector Allocation Rotation Model continues to deteriorate suggesting that markets are significantly weaker than they appear. As suggested all through this missive, a reflexive bounce in the market should be SOLD into currently.
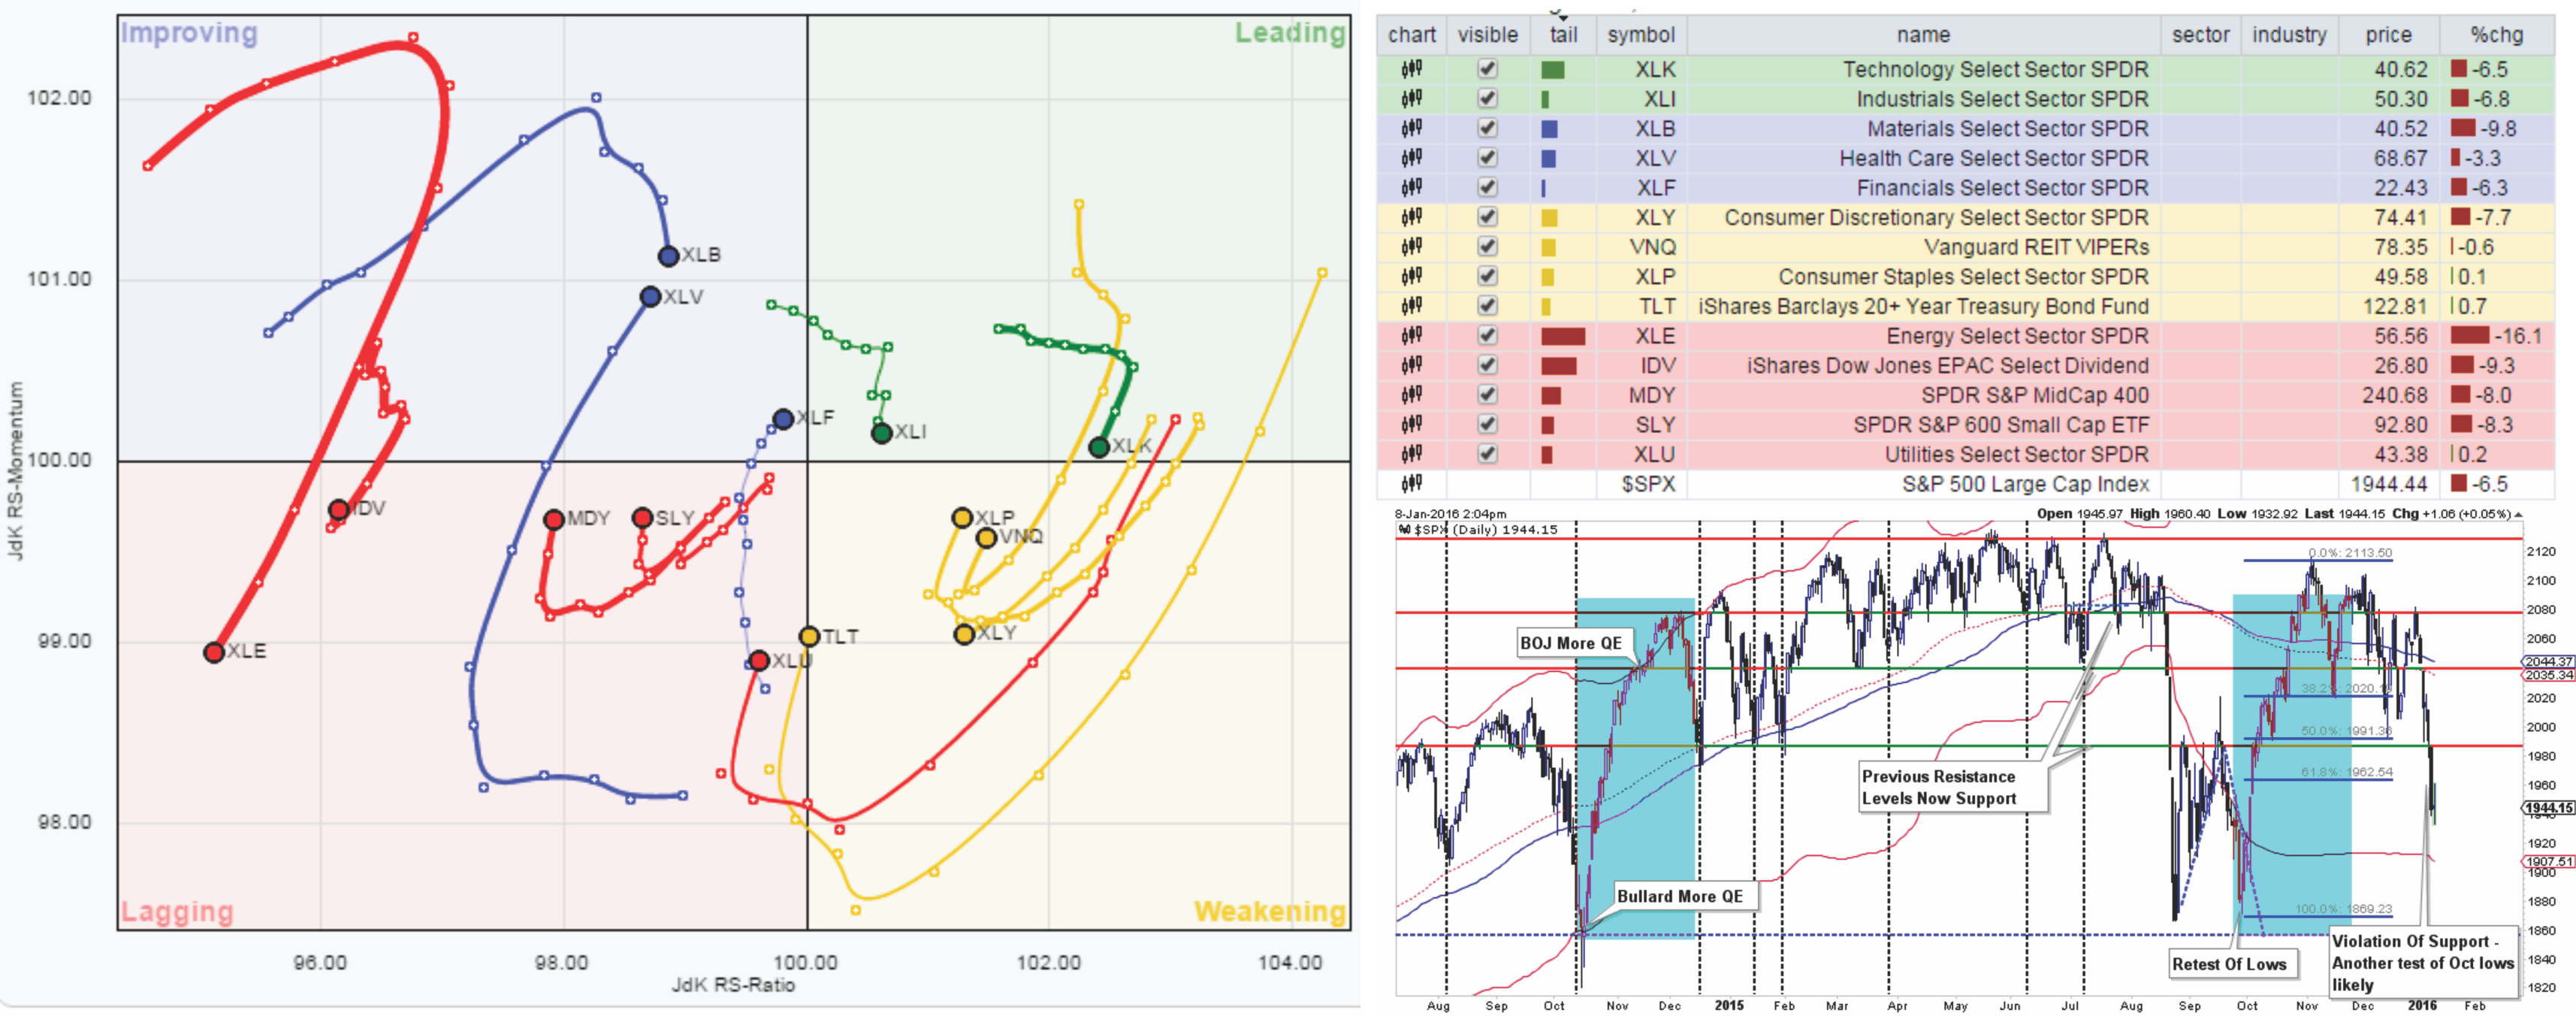
While Technology, Industrials, Financials, Basic Materials, and HealthCare stocks have shown better performance than the index as a whole, these sectors are only winning by not losing as much.
Small and Mid-capitalization stocks continue to struggle and should be avoided for now. Volatility risk is substantially higher in these areas and are better used during a firm growth cycle versus a weak one.
Adding to fixed income, not high-yield bonds, is advisable here as markets continue to see a flight to safety. Hold current allocations for now and add to positions when the equity market bounces.
The recommendations for “pruning and trimming” exposure over the past couple of months has already done much of the risk mitigation needed to navigate the current markets. Therefore, there should be only relatively minor changes needed currently.
S.A.R.M. Model Allocation
As we enter the New Year, I have set the SARM Model to reflect the allocation model discussed above and below.
Hold Materials
Hold Industrials
Hold Discretionary
Hold Energy
Hold Technology
Hold Utilities
Hold Staples
Hold Healthcare
Hold Financials
Hold REITs
Hold Bonds
The example portfolio looks as follows:
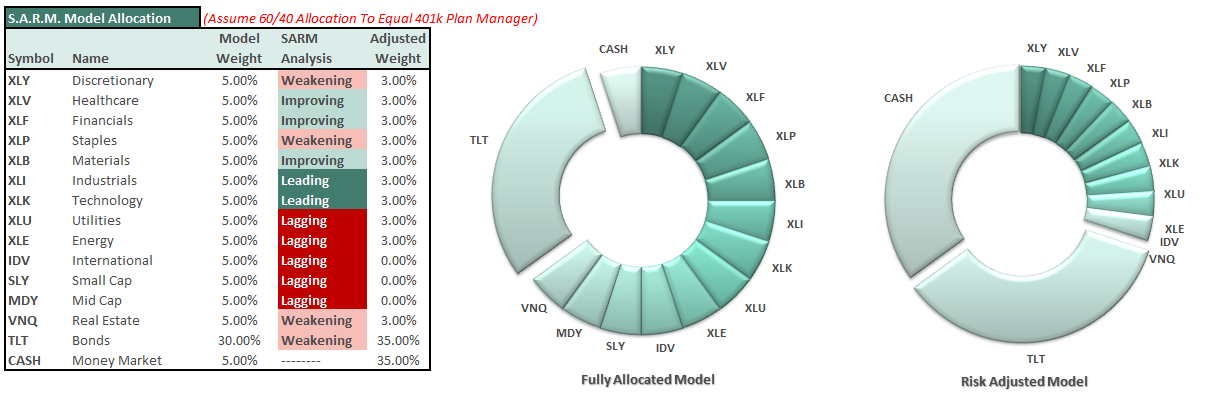
With the pullback this week, the markets are oversold enough once again to elicit a short-term rally over the next week or so. As you will notice, the model is currently carrying 35% cash in the portfolio. Any rally in the markets should be used to reduce cash and increase fixed holdings accordingly.
It is completely OKAY if your current allocation to cash is different based on your personal risk tolerance.
As you can see, there are not DRASTIC movements being made. Just incremental changes to reducing overall portfolio volatility risks. However, if the expected bounce fails at resistance, then further reductions will be required in accordance with the risk reduction modeling.
Remember, as investors, our job is not to try and capture every single relative point gain of the market as it rises. While we certainly want to participate in the rise, our JOB is to protect our capital against substantial losses in the future. A methodology that regularly harvests gains, reduces risk and keeps the portfolio focused on longer-term goals will lead to a more successful outcome.


