Today’s infographic uses data from the National Corn Growers Association to break down U.S. corn use by segment in 2020, and the products that a bushel of corn can produce.

Source: https://www.visualcapitalist.com/visualizing-the-uses-of-corn/
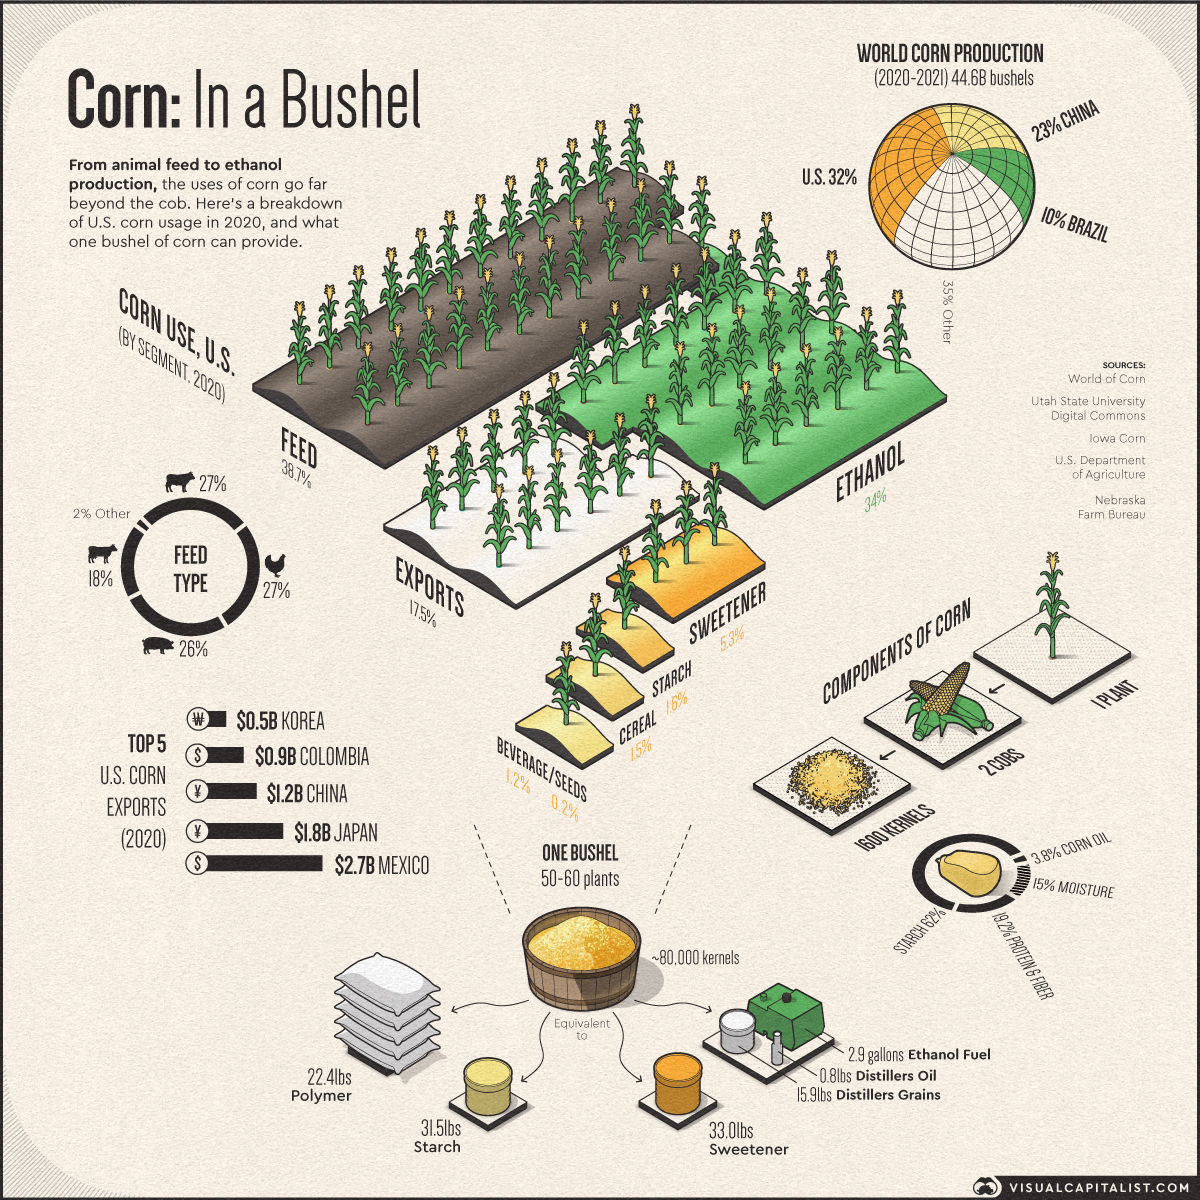
Today’s infographic uses data from the National Corn Growers Association to break down U.S. corn use by segment in 2020, and the products that a bushel of corn can produce.
Source: https://www.visualcapitalist.com/visualizing-the-uses-of-corn/


