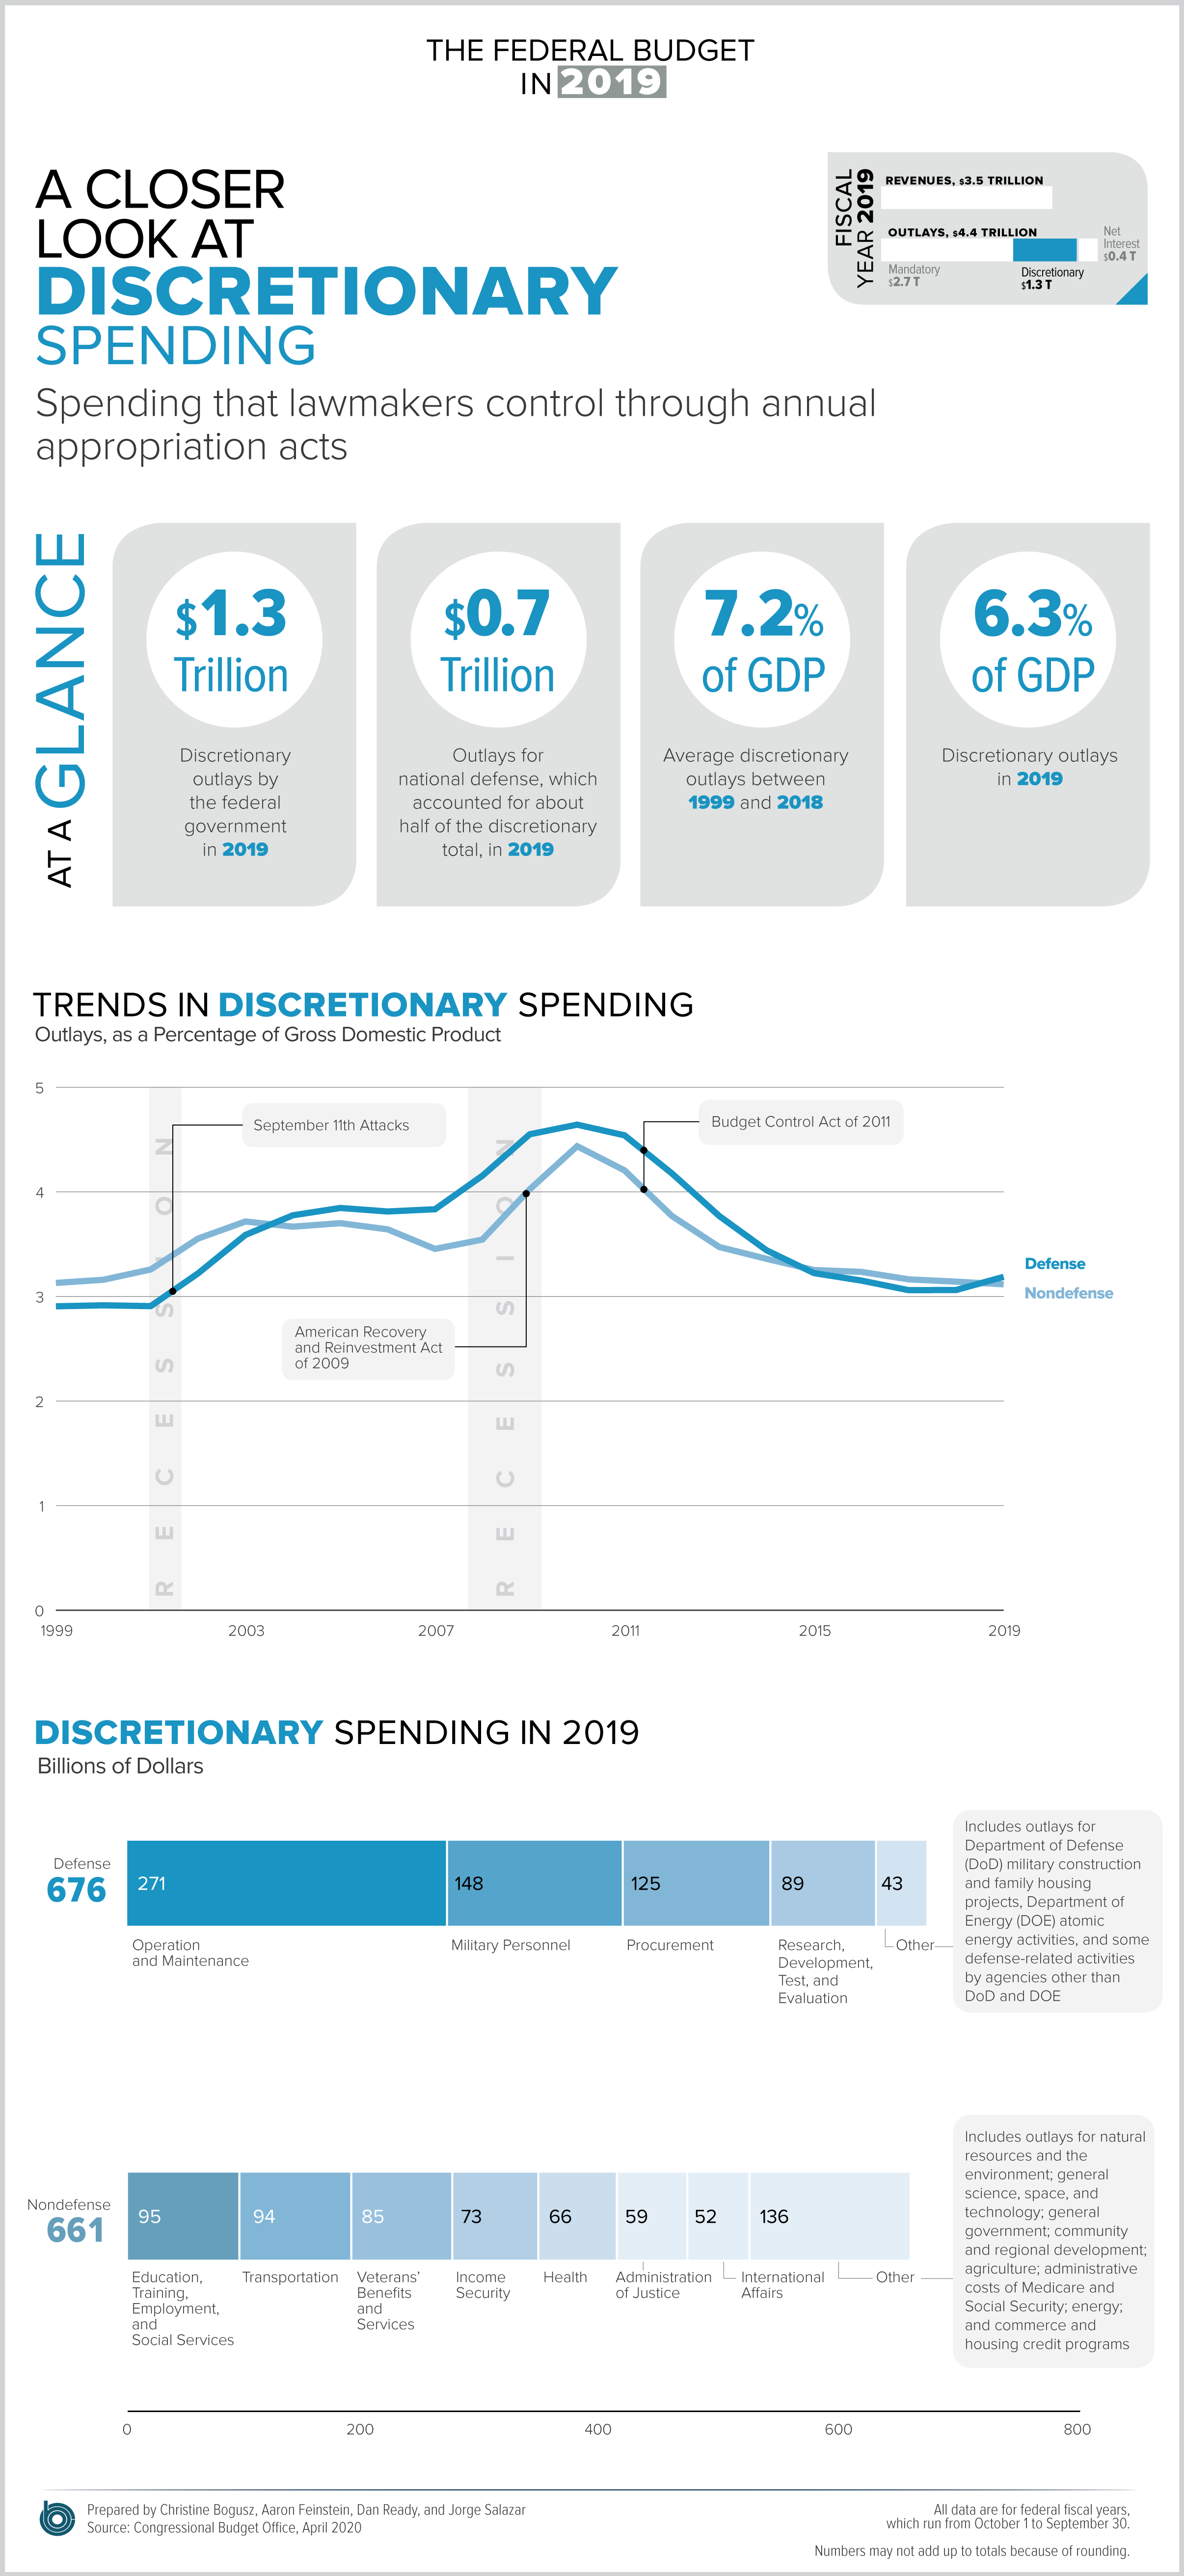
Each year, CBO releases a set of four budget infographics that provide a detailed look at the past fiscal year as well as broader trends over the past few decades. These infographics help people understand how much the government spends and takes in each year and what programs and revenue sources account for the largest portions of those budgetary flows.