from the St Louis Fed
— this post authored by Lowell R. Ricketts, Data Scientist, Institute for Economic Equity
The Great Recession, which occurred from December 2007 to June 2009, was marked by widespread wealth destruction, especially corporate equities and home equity – the latter marked by pronounced inequities by race and ethnicity. In stark contrast, average wealth outcomes among white, Black and Hispanic households hit record highs during the recovery from the COVID-19 recession, which occurred from February to April 2020.

It is important to note that these averages are more responsive to the high wealth holdings of the very rich, so these results may not characterize the typical household’s experience. Indeed, given that Black and Hispanic families have borne the brunt of pandemic hardship in many ways, these average outcomes may obscure declining wealth for a relatively large share of families. While average wealth grew across these racial and ethnic groups, the source and magnitude of that growth varied.
While the gains shown here are positive developments, questions remain about how we can achieve a more equitable recovery. The economic recovery has thus far been characterized by divergent outcomes; as a result, financial hardship, such as job loss and other forms of financial insecurity, has been concentrated in the population, usually those least able to bear it.
Without addressing this inequitable recovery, we risk failing to achieve the full potential of our economy and communities, a point that Federal Reserve Chair Jerome Powell shared in a recent speech, saying, “We will only reach our full potential when everyone can contribute to, and share in, the benefits of prosperity.”
Growth in Assets Is Driving Wealth Gains, instead of Paying Down or Shedding Debt
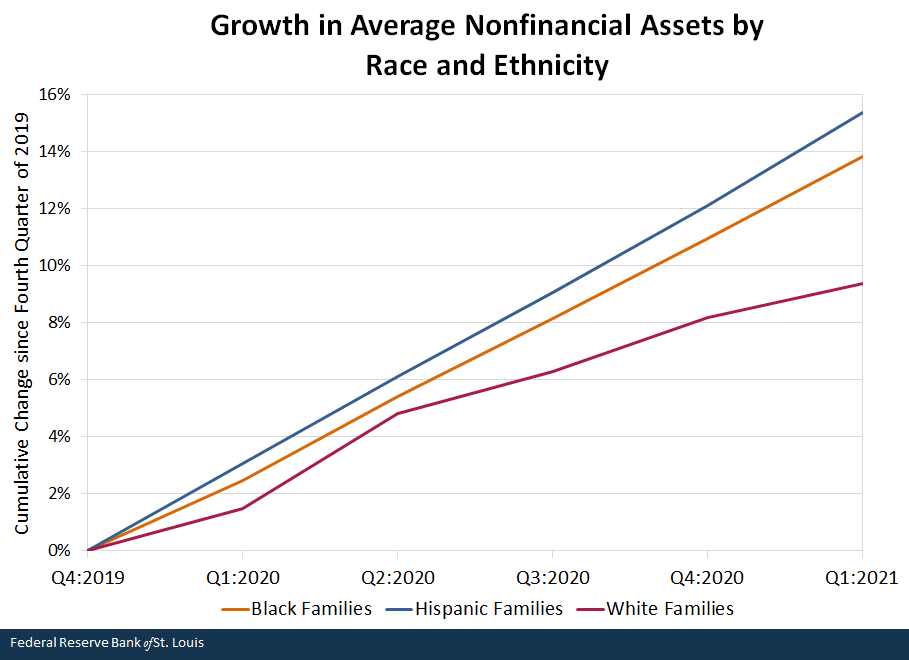
The historic growth in wealth has been driven primarily by strong gains in both nonfinancial and financial assets, while debt loads have been mostly stable. The figure below breaks growth into financial assets (e.g., stocks, checking accounts, retirement accounts) and nonfinancial assets (e.g., value of a home or car). On the other side of net worth, liabilities comprise mortgage, consumer (e.g., credit cards, student loans) and other debts.
Growth comparisons are done within each respective racial or ethnic group, which, importantly, have vastly different levels of wealth and asset holdings. As compared with their value at the end of 2019, real nonfinancial assets were 13.8%, 15.4% and 9.4% higher for Black, Hispanic and white families, respectively, by the end of the first quarter of 2021. That growth has been remarkably steady during the pandemic.
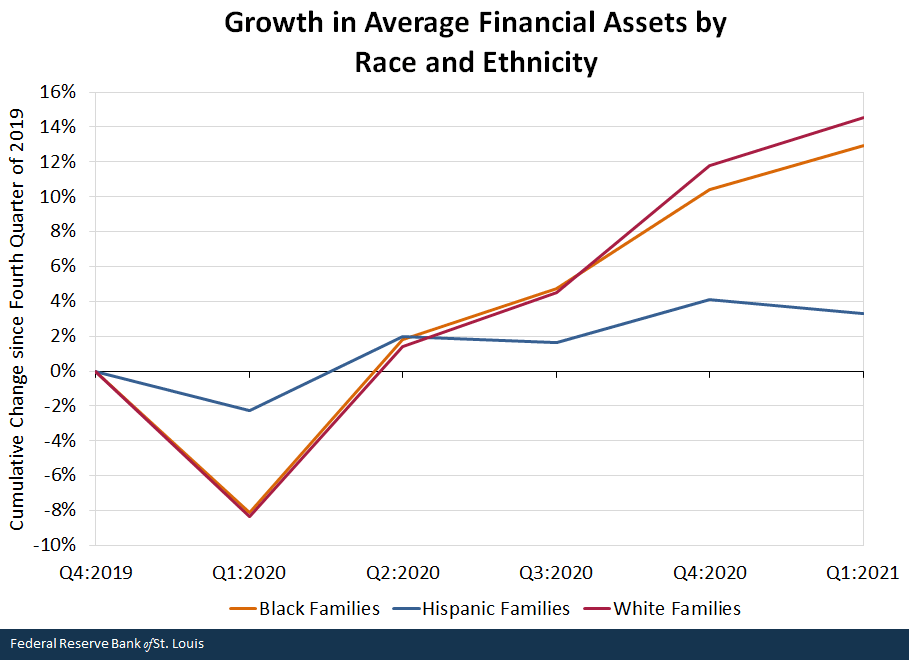
In contrast, average financial assets plunged at the end of first quarter of 2020, reflecting the market volatility at the time. Shortly thereafter, the value of these assets surged for Black and white families, while growth was positive but more volatile and subdued for Hispanic families. Taking stock as of in the first quarter of 2021, the values of real financial assets were up by 12.9%, 3.3% and 14.5% for Black, Hispanic and white families, respectively.
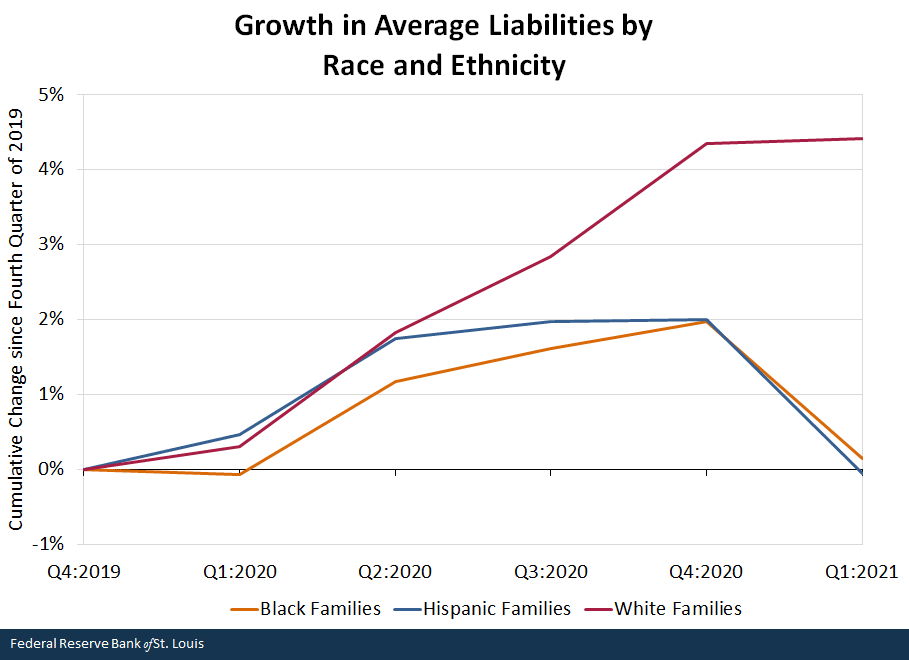
Meanwhile, the average debt load was roughly unchanged for Black and Hispanic families, while it was up 4.4% for whites. This is a notable difference compared with the deleveraging (paying or shedding debt) that households did during and after the Great Recession.
SOURCES FOR THREE FIGURES ABOVE: Federal Reserve Board’s Distributional Financial Accounts and author’s calculations.
NOTES FOR THREE FIGURES ABOVE: Adjusted for inflation using the consumer price index research series using current methods (CPI-U-RS). White represents households headed by someone who identifies primarily as white, non-Hispanic. Similarly identified, Black represents Black, non-Hispanic households, and Hispanic represents Hispanic households of any race.
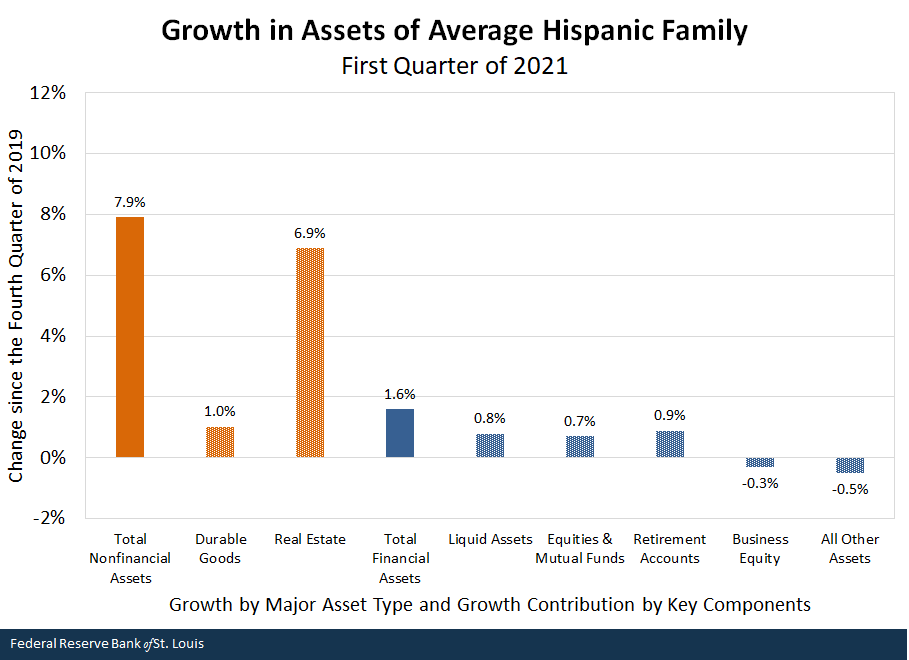
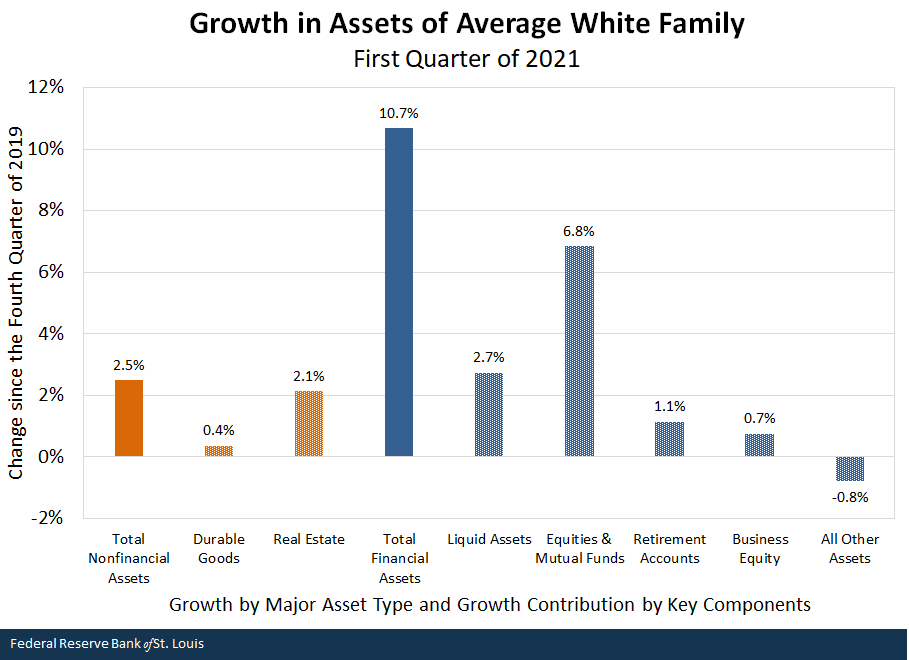
Investments Drove More of Black and White Wealth Higher; Real Estate Lifted Hispanic Wealth
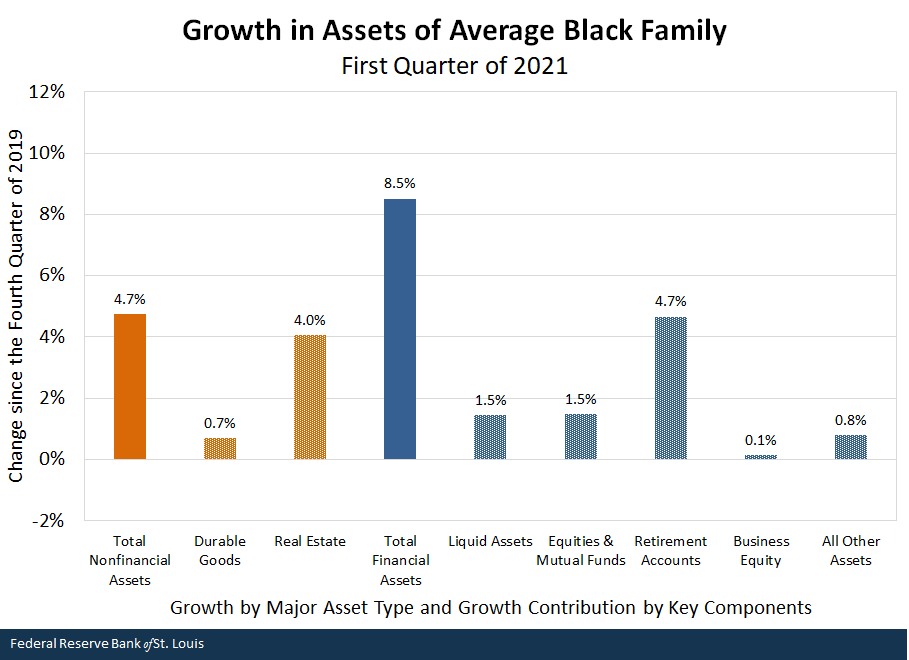
The Federal Reserve Board’s Distributional Financial Accounts allow us to further break the growth in wealth into individual categories of assets and liabilities. The figure below shows the contribution of each asset category to the overall growth in total assets for each group. Much of the growth in average wealth among white families came from directly held stocks and mutual funds. In contrast, gains in real estate drove the lion’s share of wealth growth for the average Hispanic family. The average Black family saw strong wealth accumulation from real estate but also from retirement accounts. These accounts include both balances in defined-contribution pension plans [e.g., 401(k) and 403(b) plans] and accrued benefits to be paid in the future from defined-benefit plans.
Relative to the Great Recession during which home values plunged, the pandemic has seen the strength of real estate assets helping to drive more equitable wealth gains for those families that owned these assets.
SOURCES FOR THE THREE FIGURES ABOVE: Federal Reserve Board’s Distributional Financial Accounts and author’s calculations.
NOTES FOR THE THREE FIGURES ABOVE: Adjusted for inflation using the CPI-U-RS. Black and white households are non-Hispanic; Hispanic households are of any race.
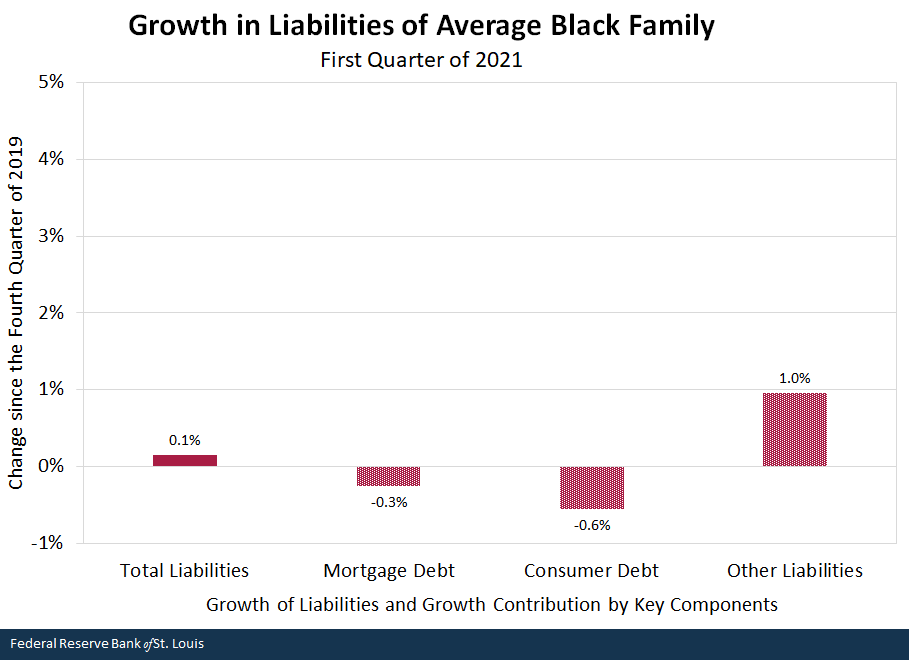
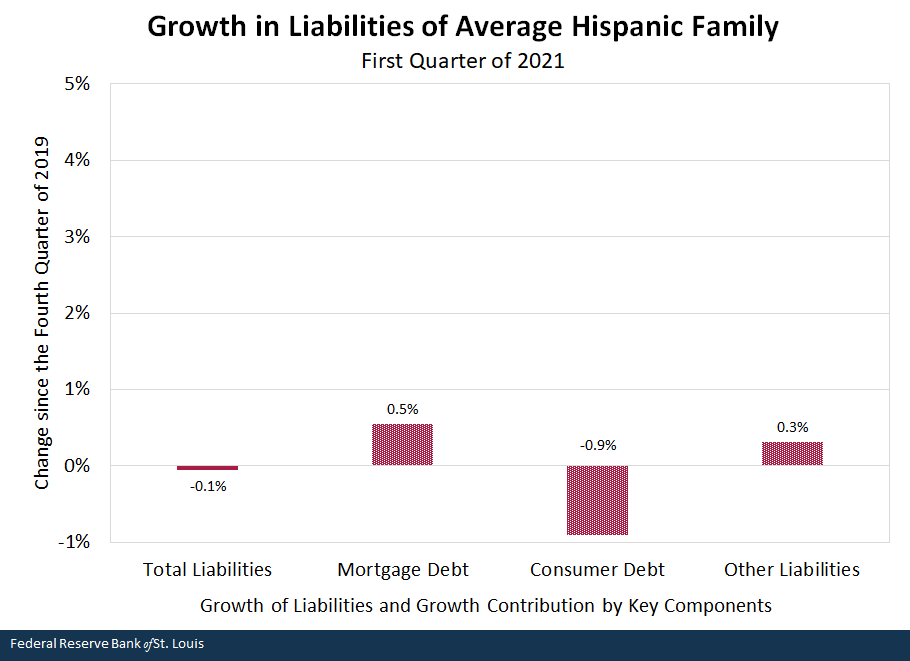
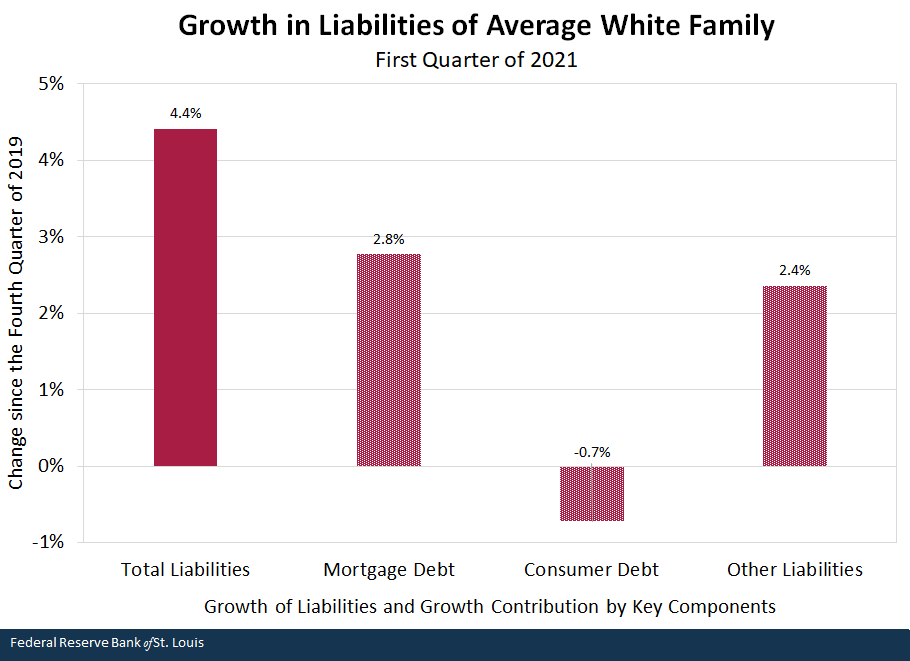
Debt Unchanged for Black and Hispanic Families; White Families Take On Mortgage and Investment Debt
The figure below shows a similar decomposition for the growth in average liabilities across groups. All these racial and ethnic groups paid down or shed one of the components, consumer debt, during the pandemic. This category includes credit cards, student loans and vehicle loans, as well as other loans extended to consumers. Credit bureau data separately show a significant deleveraging of credit card debt, especially during the spring of 2020. Three rounds of stimulus checks passed by Congress appear to have supported some of this deleveraging and asset growth shown earlier.
Growth in liabilities was concentrated in both mortgage debt and the “other liabilities” component; the latter encompasses a diverse but small share of total liabilities. White families appear to have driven most of a historic year in mortgage originations. Within the other liabilities category, the balances grew notably for margin accounts offered by financial asset brokers and dealers. (For those unfamiliar with these accounts, they allow individuals to borrow money against investments in their accounts to purchase stocks or other financial assets.) These accounts grew for both the average white and Black families during the pandemic. These accounts likely enabled families to take further advantage of historic returns in the financial markets.
SOURCES FOR THE THREE FIGURES ABOVE: Federal Reserve Board’s Distributional Financial Accounts.
NOTES FOR THE THREE FIGURES ABOVE: Adjusted for inflation using the CPI-U-RS. Black and white households are non-Hispanic; Hispanic households are of any race.
The View from the Top of the K-Shaped Recovery Looks Pretty Good
It’s important to reemphasize that these averages are moved heavily by families at the top of the wealth distribution. Understandably, these sizable wealth gains may seem out of step with reports of hardship during the pandemic; this divergence characterizes the popularly termed K-shaped recovery. Many families did experience economic upheaval, representing the bottom of the “K.” In contrast, others saw little disruption to their financial stability and have been able to leverage booming housing and financial markets to amass sizable wealth gains. Unless a more equitable recovery is achieved, many families may be left behind in dire financial straits. The economy will fail to achieve its full potential until all Americans can enjoy financial security and the prosperity represented by this historic wealth accumulation.
Additional Resources
- The Real State of Family Wealth
- On the Economy: Wealth Gaps between White, Black and Hispanic Families in 2019
- On the Economy: The Real State of Family Wealth: Will COVID-19 Worsen Racial, Educational and Generational Gaps in the U.S.?
Source
https://www.stlouisfed.org/on-the-economy/2021/august/asset-values-surged-k-shaped-recovery
Disclaimer
Views expressed are not necessarily those of the Federal Reserve Bank of St. Louis or of the Federal Reserve System.


