from the St Louis Fed
Analyzing immigration data is one thing, but is it possible to glean how much immigrants contribute to the economy based on their educational attainment?

Federal Reserve Bank of St. Louis Research Officer and economist Subhayu Bandyopadhyay and Research Associate Praew Grittayaphong explored this question in the Regional Economist article, “Educational Attainment of Immigrants at the National and Eighth District Levels.” In it, they reasoned that immigrants with higher educational levels are more likely to earn more – and pay more in taxes – while being less likely to become a fiscal burden.
The authors analyzed the foreign-born population in the U.S. and compared it with the native-born population. They looked at the data for the nation, the states of the Eighth Federal Reserve District [1] and the District’s four largest metropolitan statistical areas (MSAs): Little Rock, Ark.; Louisville, Ky.; Memphis, Tenn.; and St. Louis.
Educational Attainment
In the figure below, the first four sets of bars show striking differences in the education of U.S. natives and immigrants. At the national and District levels, the shares of foreign-born people without a high school degree are much larger. Among those with high school degrees, the native shares are much greater than those of the foreign born.
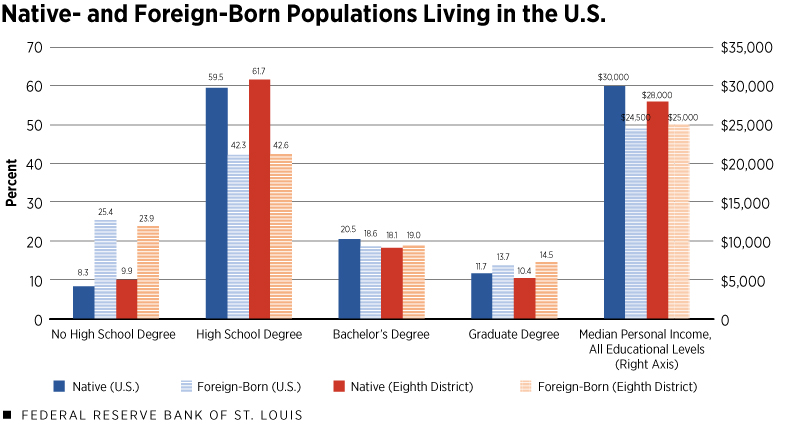
SOURCE: 2018 American Community Survey, accessed via IPUMS USA.
The age makeup of the native-born population differs sharply from that of the foreign born, because most people who migrate internationally are of working age.
“The same age distribution trend is reflected in our data,” the authors wrote. “While around 30% of the U.S. native-born population is younger than 22, only about 10% of the foreign-born population is in the same age group. To account for this, our calculations include only individuals who are 22 years old or older.”
What’s in the Data
For the U.S., the differences between the “no high school” and “high school” categories of natives and immigrants largely offset each other, according to the authors. Meanwhile, educational attainment above a high school degree for immigrants and natives is similar at around 32%. But slightly higher proportions of the foreign born hold graduate degrees nationwide and in District states.
The data also suggest that the proportion of the foreign born at the lowest educational level is relatively high, likely lowering their average income compared with that of the native born, they added.
“This is perhaps why we find that, at the national level, the native-born population earns a much higher median personal income ($30,000) relative to that of the foreign-born ($24,500),” the authors wrote. “This difference persists, albeit at a lower magnitude, in the District.”
MSA-Level Findings
The table below focuses on the four largest Eighth District MSAs and the Chicago MSA, which is outside the District. (Chicago is included to serve as an external frame of reference.)
| Highest Educational Attainment | Median Personal Income | |||||||||
|---|---|---|---|---|---|---|---|---|---|---|
| No High School Degree | High School Degree | Bachelor’s Degree | Graduate Degree | |||||||
| Native-Born | Foreign-Born | Native-Born | Foreign-Born | Native-Born | Foreign-Born | Native-Born | Foreign-Born | Native-Born | Foreign-Born | |
| Chicago | 6% | 25% | 53% | 43% | 25% | 19% | 15% | 13% | $35,000 | $26,000 |
| Little Rock | 8% | 19% | 61% | 50% | 19% | 15% | 11% | 15% | $30,000 | $22,000 |
| Louisville | 9% | 23% | 61% | 40% | 19% | 20% | 11% | 17% | $30,100 | $25,000 |
| Memphis | 10% | 30% | 62% | 33% | 18% | 20% | 10% | 18% | $26,100 | $23,300 |
| St. Louis | 8% | 10% | 59% | 38% | 20% | 27% | 13% | 24% | $32,000 | $32,000 |
| SOURCE: 2018 American Community Survey, accessed via IPUMS USA. | ||||||||||
Compared with the foreign-born population, a higher share of U.S. natives in the Eighth District have attained at least a high school diploma. But in the St. Louis MSA, the proportion of the foreign born without a high school diploma is similar to that of natives.
The St. Louis MSA is unique because it’s the only MSA in the table that shows the foreign born earning just as much as U.S. natives. The foreign born in the St. Louis MSA also have the highest median personal income among all the foreign-born populations shown in the table, they pointed out.
“While the Eighth District largely mirrors the nation, important differences are visible at the more granular level of District MSAs, most notably in the St. Louis MSA, where immigrants display relatively high educational attainment and income levels,” the authors wrote.
Notes and References
- Headquartered in St. Louis, the Eighth Federal Reserve District includes all of Arkansas and parts of Illinois, Indiana, Kentucky, Mississippi, Missouri and Tennessee. However, given data limitations, the authors looked at data for the entirety of all seven states.
Additional Resources
- Regional Economist: Educational Attainment of Immigrants at the National and Eighth District Levels
- On the Economy: STEM Skills among Foreign-born Workers in the U.S.
- Regional Economist: How College Attainment Differs by Birthplace
Source
https://www.stlouisfed.org/on-the-economy/2021/may/immigrants-educational-attainment-may-indicate-economic-contributions
Disclaimer
Views expressed are not necessarily those of the Federal Reserve Bank of St. Louis or of the Federal Reserve System.
include(“/home/aleta/public_html/files/ad_openx.htm”); ?>


