from the St Louis Fed
— this post authored by William R. Emmons, Lead Economist in Supervision
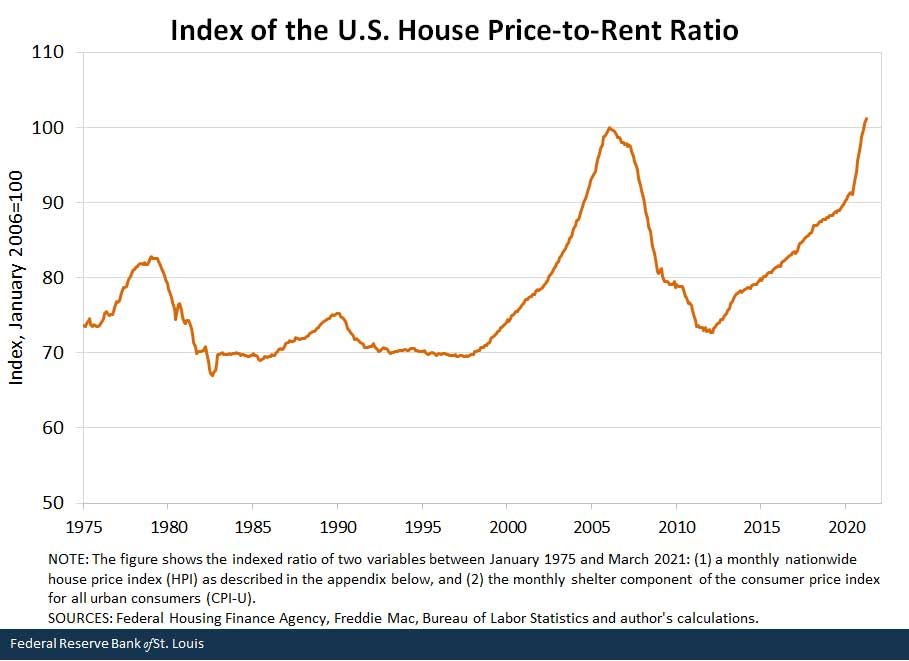
The nationwide house price-to-rent ratio, a widely used measure of housing valuation that is analogous to the price-to-dividend ratio for the stock market, is at its highest level since at least 1975, as shown in the figure below. Rapid house price appreciation since last May, combined with a slowdown in rent growth, resulted in a surge in this ratio.

By February 2021, the national house price-to-rent ratio had surpassed the previous peak reached in January 2006; in March 2021, the ratio was 1% higher than its level at the peak of the housing bubble. This suggests the average house now sells for quite a bit more than its “fair value,” as explained below.
What Is the “Fair Value” of a House?
The First Step in Analyzing Value: Rented Housing
How does one judge whether a house selling at a given price (or the housing market generally) is “expensive” or “cheap,” “overvalued” or “undervalued”? One approach economists use is to compare the price to a measure of the housing unit’s “fundamental value.”1
If all housing services were bought by one party from another – that is, if everyone rented from a landlord – this would be relatively easy. Applying a few standard assumptions to this analysis – that the average person’s housing preferences change little over time; that the relevant “discount rate” investors apply to a housing investment is relatively constant over decades; and that most investors expect house prices to be related in a stable way to household or national incomes – an economist would expect the house price-to-rent ratio to fluctuate somewhat but to show no persistent increase or decrease. A sustained upward movement of the ratio would imply increasing overvaluation – that is, the likelihood that the ratio eventually would head back down toward its historical average – and a persistent downward movement would suggest the opposite.
Thus, fair value is the price at which the price-to-rent ratio approximates its historical average under the assumptions noted above.
The Valuation Problem of Owner-Occupied Houses
How can we estimate the fundamental value of a house owned and occupied by the same person or family? They pay no explicit rent, so how do we measure the value they derive from it? This is important because most housing units in the U.S. are occupied by their owners.
The solution is an estimate of the rent that a particular house would command if it were rented to someone else, rather than being occupied by the owner. The Bureau of Labor Statistics (BLS) estimates “imputed rent” for owner-occupied housing each month in a large number of metropolitan areas and for the nation’s entire housing stock. In practice, this involves observing rents paid for housing units that actually are being rented and then imputing this amount of rent to comparable owner-occupied houses.2
The National House Price-to-Rent Ratio Using Imputed Rent
Even though imputed rent goes a long way toward solving the problem of determining the fundamental value of owner-occupied housing, a simple comparison of market price to fundamental value is not the end of the story. How can we measure the market prices of housing and housing services for the entire country in the first place? And how do we judge whether a particular ratio of house prices to rents signals over- or undervaluation or, instead, simply changes in how people value housing, the discount rates they apply or a disconnect between house prices and incomes?
Measuring House Prices …
There are many different house price indexes for the nation as a whole as well as for particular regions, states, counties and metropolitan areas.3 There is no perfect house price index, so I constructed one for this article by combining two high-quality indexes: (1) the Federal Housing Finance Agency (FHFA) Purchase-Only House Price Index for the United States, and (2) the Freddie Mac House Price Index. The FHFA index is methodologically superior to many other indexes but it has a relatively short history of about 30 years. The Freddie Mac index is similar methodologically but draws from a smaller sample each month. Its primary advantage is a longer data history (about 46 years). More details on the indexes are in the appendix.
… and Rents
I used the shelter component of the consumer price index for all urban consumers (CPI-U) to measure the imputed rent paid for owner-occupied housing. Owners’-equivalent rent of residences (OER), a subcomponent of the shelter index, is a closer match to what I want to measure, but its data history is not as long as that of the shelter index. As detailed in the appendix, the shelter and OER indexes produce nearly identical conclusions, so I used the longer data series.
With these data, we can calculate a ratio of house prices to rent; with the earlier assumptions, we can also point to a ratio indicative of fair value for housing. During the entire 46-year period shown in the earlier figure, the average value of the ratio is about 78. As of March, the nationwide house price index was about 30% higher than the estimate of fair value produced by this approach.
And about Those Assumptions
If an analyst considers unreasonable any of the assumptions I made above – namely, constant housing preferences, discount rates and connection to income – she will reject the conclusion of overvaluation that I draw from the figure. Indeed, these assumptions remain somewhat controversial among economists.4
Will This Time Be Different?
Are we experiencing another housing bubble? Should we expect housing to play an important role in the next downturn? The risks facing households, the financial system and the economy appear less serious now than they were in 2006. Most importantly, homeowners today have greater home equity and less mortgage debt, on average, than they did then. But the elevated level of the house price-to-rent ratio surely merits caution and further study.
Notes and References
- For example, see Charles Himmelberg, Christopher Mayer and Todd Sinai, “Assessing High House Prices: Bubbles, Fundamentals and Misperceptions,” Journal of Economic Perspectives, 2005, Vol. 19, No. 4, pp. 67-92; Carlos Garriga, Rodolfo Manuelli and Adrian Peralta-Alva, “A Macroeconomic Model of Price Swings in the Housing Market,” American Economic Review, 2019, Vol. 109, No. 6, pp. 2036-72; and Jack Favilukis, Sydney C. Ludvigson and Stijn van Nieuwerburgh, “The Macroeconomic Effects of Housing Wealth, Housing Finance and Limited Risk Sharing in General Equilibrium,” Journal of Political Economy, 2017, Vol. 125, No. 1, pp. 140-223.
- The BLS reports its estimates of owner’s-equivalent rent of residences (OER) every month as a component of the consumer price index for all urban Consumers (CPI-U).
- The St. Louis Fed’s FRED database contains 672 house price indexes.
- The articles mentioned in the first note contain extensive discussions of these assumptions.
Additional Resources
- On the Economy: Racial and Ethnic Disparities in Housing Distress during the Pandemic
- On the Economy: How Many Mortgage Foreclosures Is Forbearance Preventing?
- Regional Economist: The Impact of COVID-19 on the Residential Real Estate Market
Appendix
[back to text]The house price index: The house price index I created consists, first, of all available values of the FHFA Purchase-Only House Price Index for the United States. This data series runs from January 1991 to February 2021. It is a repeat-sales index that uses data from only actual sales of existing homes – that is, appraised values (such as those used in a refinance transaction) are excluded because they can be unreliable estimates of market values. This is especially true when market-based house prices are changing rapidly.
To extend the series backward in time, I used the Freddie Mac House Price Index from its origin in January 1975 through January 1991, where I spliced it to the FHFA series. The Freddie Mac index also uses a repeat-sales methodology and contains many of the same transactions (although fewer) that are included in the FHFA index. The Freddie Mac index is likely to be a good substitute for the FHFA index in periods when the latter is unavailable. This is shown by their similar comovements: The correlation between overlapping monthly percent changes in the FHFA Purchase-Only index and the Freddie Mac index (both seasonally adjusted) is 0.87; at a quarterly frequency, it is 0.96; and at an annual frequency, it is 0.98.
The March 2021 observation is estimated by applying the monthly seasonally adjusted percent change in the Freddie Mac index from February to March (0.8%) to the February 2021 FHFA index level.
The rent index: I used the shelter component of the CPI-U for all observations (January 1975 through March 2021). The owners’-equivalent rent of residences series (OER) – a subcomponent of the shelter index – would be preferable but is available only from January 1983 to the present. (The house price-to-rent ratio calculated using the FHFA house price index and the OER index – available only between January 1991 and February 2021 – also reached an all-time high in February 2021.)
The correlation between overlapping monthly percent changes in the CPI-U shelter index and the OER index (both seasonally adjusted) is 0.84; at a quarterly frequency, it is 0.95; and at an annual frequency, it is 0.98.
Source
https://www.stlouisfed.org/on-the-economy/2021/may/housing-prices-surpass-bubble-peak-measure-value
Disclaimer
Views expressed are not necessarily those of the Federal Reserve Bank of St. Louis or of the Federal Reserve System.


