
Written by rjs, MarketWatch 666
News posted last week about economic effects related to the coronavirus 2019-nCoV (aka SARS-CoV-2), which produces COVID-19 disease, has been surveyed and some articles are summarized here. We cover the latest economic data, especially the prospects for an infrastructure bill, stimulus checks, government funding, the Fed, the latest employment data, housing market reports, mortgage delinquencies & forbearance, layoffs, lockdowns, and schools, as well as GDP. The bulk of the news is from the U.S., with a few more articles from overseas at the end. (Picture below is morning rush hour in downtown Chicago, 20 March 2020.) News items about epidemiology and other medical news for the virus are reported in a companion article.

Please share this article – Go to very top of page, right hand side, for social media buttons.
This week the news associated with the pandemic includes Biden’s budget and housing market items. There are a few articles from around the world at the end:
Fed policies spark concerns over dollar’s global role – Questions are beginning to be raised in financial circles about the long-term status of the US dollar as the world’s reserve currency as the Fed continues to pour money into the financial system, effectively financing the growing debt of the US government, while fuelling an asset bubble. On Tuesday, the Financial Times published a major article by long-time financial commentator John Plender entitled “The demise of the dollar? Reserve currencies in the era of ‘going big’.” The Federal Reserve in Washington [Credit: AP Photo/Patrick Semansky, File] Plender began with a reference to what he called an “apocalyptic warning” by the billionaire US hedge fund chief Stanley Druckenmiller that the dollar could cease to be the predominant global reserve currency within 15 years. The warning was made in an interview with Druckenmiller on the business channel CBNC on May 11, where he elaborated on an op-ed piece he had written for the Wall Street Journal that day headlined “The Fed is playing with fire.” The central criticism advanced by Druckemiller was that, while he agreed with the Fed’s initial actions, its continuation of the ultra-low interest rate regime and asset purchases, under conditions where the US economy was undergoing a significant recovery, was now creating major risks. “I can’t find any period in history where monetary and fiscal policy were this out of step with the economic circumstances, not one,” he stated in the CNBC interview. Druckemiller said in the long term the Fed’s policies and the rising government debts and deficits they support threatened the dollar’s international standing. “If they want to do all this and risk our reserve currency status, risk an asset bubble blowing up, so be it. But I think we ought to at least have a conversation about it. “If we are going to monetize our debt and we’re going to enable more and more of this spending, that’s why I am worried now, for the first time, that within 15 years we lose our reserve currency status and of course all the unbelievable benefits that have accrued with it,” he said. While not fully endorsing Druckenmiller’s warnings, Plender pointed out that “even before the coronavirus pandemic and the extraordinary economic conditions it has generated, there were signs that the dollar’s dominance was slipping.” Plender noted that in its most recent survey, covering the last quarter of 2020, the International Monetary Fund had found that dollar reserves held by central banks had fallen to 59 percent, their lowest levels in 25 years, and well below the 71 percent when the euro was launched in 1999. Plender drew attention to the extraordinary developments that took place in the market for US Treasury bonds when the pandemic began to make its economic and financial effects felt in March 2020 which raised “important questions about the market’s liquidity.” The usual response to financial turbulence is a rush to purchase Treasury bonds as a “safe haven.” In early March there was a typical and orderly flight to safety in US Treasuries. But from March 9 on “there was a disorderly flight from Treasury paper into cash” resulting from forced selling by hedge funds that had borrowed heavily to try to profit from differences in the yield on Treasuries and the yields in futures markets. The plunge in the market threatened the solvency of highly leveraged funds, forcing them to sell, promoting a feedback loop in which those sales prompted further declines and further sales. “That should not have happened in what is usually termed the world’s deepest, most liquid government bond market,” Plender wrote.
Fed Alert: Reverse Repo Usage Nears Record As Repo Market Set To Blow –Ahead of today’s 1:15pm overnight Reverse Repo deadline we asked if today is the day the repo market finallys crack, pushing the amount of reserves parked at the Fed to a new record above $500 billion.We were off, but not by too much: on Monday, the Fed revealed that the amount of overnight reserves parked at the Fed rose by another $26BN to $394.9BN (with 54 counteparties) from $369BN (52 counteparties) on Friday, which was the 5th highest in history, up a whopping $186 billion in one week and the highest non-quarter end reverse repo usage ever! Why does this matter? Three reasons, all of which we explained in extensive detail in “Fed Alert: Overnight Reverse Repo Usage Soars Above Covid Crisis Highs“, Repo Crisis Looms: Fed’s Reverse Repo Usage Soars To $351BN, Fifth Highest Ever, and Zoltan On The Coming QE Endgame: “Banks Have No More Space For Reserves“,
- The Fed is taking Treasurys out of the market through QE purchases and putting them right back in via the RRP
- The heavy use of the o/n RRP facility tells us that foreign banks too are now chock-full of reserves.
- Banks don’t have the balance sheet to warehouse any more reserves at current spread levels.
As for the immediate market implications they are even more ominous: either the Fed will have to hike the IOER or rates will soon go negative. Worse, with the Fed still planning to do at least $1 trillion in QE even assuming a December taper, and potentially as much as $2 trillion based on the latest just released Fed “forecast”, there is simply no place to park all of these reserves. And while Powell & Co pretend that they can continue business as usual for years to come, the repo market is not only cracking but banks, full to the gills with inert reserves and which increase by $30 billion every week, are on the verge of pulling a Mr Creosote… … and balking at even a penny of additional liquidity. How the Fed will continue to monetize debt then, when the repo system is now out of collateral, is anyone’s guess.
Half a trillion dollars is sitting at the Fed earning nothing – There’s so much spare cash sloshing around U.S. funding markets that investors are choosing to park almost half a trillion dollars at the central bank – earning absolutely nothing. Usage of the Federal Reserve’s reverse repo facility – a mechanism that’s part of the central bank’s arsenal for helping to steer short-term interest rates – surged on Thursday to an unprecedented $485.3 billion. And with the forces driving the dollar glut still some way from abating, that figure could climb further, adding fuel to an increasingly complex debate about what the Fed should do with its various tools to keep a rein on policy. While the offering rate on the Fed reverse repo facility is 0%, there is a lack of alternative places to safely stash money for very short periods. On top of that, some of those – like Treasury bills and market-based repurchase agreements – have seen their rates fall at times to negative levels, meaning investors are essentially paying for the privilege of putting their money somewhere. Compared to that, 0% doesn’t seem so bad. The RRP facility, as it’s commonly called, is “the only safety valve” for the pressure that’s been building up in money markets, according to Gennadiy Goldberg, a senior rates strategist at TD Securities in New York. “It’s really just holding back the flood of cash coming.” The massive buildup of dollars in the funding market is in part related to the Fed’s huge monthly bond-buying program, and is therefore providing fodder for the debate about just when and how quickly the Federal Reserve ought to begin dialing back its asset purchases. But the connection between the purchases and short-end dislocations is not straightforward. Many observers doubt that this as an issue that will substantially move the Fed’s position on tapering, and it is the prospects of sustained inflation and interest-rate hikes that are seen as the key drivers of that discussion. “I don’t think tapering is going to solve this,” said Subadra Rajappa, a strategist at Societe Generale. “Tapering is only going to add to the confusion. If they taper asset purchases, it’s going to roil global markets.” The enormous amount of fiscal stimulus being pumped into the economy is also playing a role in the glut, as is the need for the Treasury to curtail the amount of money it has on hand so it can meet a looming legal requirement on cash levels that is linked to the reinstatement of the federal debt ceiling. This drawdown in the Treasury general account is not only boosting the amount of cash reserves in the system in search of a home, but the speed at which it’s happening also means there are fewer instruments for short-end investors to buy. That’s because one of the easiest ways to reduce the cash balance is to not issue as many Treasury bills – the government’s shortest-term instruments – when the old ones mature. Simply putting the cash to work in a bank account is also not a ready solution, with regulatory constraints spurring some banks to turn away deposits, which instead flow toward money-market funds and feed the abundance. Usage of the Fed’s RRP facility has now exceeded levels typically only seen at key dates in the funding calendar – even though the current period is not typically a major crunch point. The previous record volume of $474.6 billion took place on Dec. 31, 2015, while the next biggest day was also on the final day of a year. Month-and quarter-end periods have also been known to show some signs of stress, so it’s a distinct possibility that usage will climb again on Friday, the final trading day of this month, although many observers doubt that it will stop there. Results of the next operation are set to be published around 1:15 p.m. Friday afternoon New York time.
Larry Summers Doubles Down On His Inflation Prediction – But somehow becomes vaguer about exactly how this is going to happen and show up, but he wants the Fed to stop it in its track, goshdarnit. This is in a column appearing in the Washington Post, May 25, “The inflation risk is real.”Well, he does start out by saying that the economic recovery from the pandemic is a good thing, as is of course the the receeding of the pandemic itself, with the US doing well compared to “other industrial countries.” . But now we must change course, especially the Fed, which Summers is still ticked off about not being appointed Chair of instead of Janet Yellen back when (both of his parents worked for the Philadelphia Fed, so, obviously he should have been put in charge of it, goshdarnit, quite aside from having Paul Samuelson and Kenneth Arrow as uncles!). It is not just ongoing easy monetary and fiscal policies involved here, but the “pentup demand” now roaring out that supposedly is going to race against supply responses for some long time into the future.Oh, he does have some evidence. Indeed the rate of inflation has risen and to a level, 7.5% annual rate in the first quarter, and can quote various others who agree with him that inflation is in danger of getting seriously out of control, such as Warren Buffett, and can quote Jason Furman that the fiscal stimulus is “too big for the moment.” This all supposedly means that the Fed needs to step forward by “explicitly recognizing that that overheating and, not excessive slack, is the predominant near-term risk for the economy.” Furthermore, “policies toward workers should be aimed at the labor shortage that is our current reality” by ending extra unemployment benefits in September. Oh, while he is worried about too much fiscal stimulus, he nevertheless does recognize that expanding infrastructure would help expand future supply capability, so he does reasonably argue states should not use federal aid to cut taxes.Getting back to the Fed, regarding which Summers thinks “Tightening is likely to be necessary,” it must be noted that the Fed from the beginning of the year, if not earlier (along with Treasury Secretary Yellen) has forecast an increase in the rate of inflation this year. It must be admitted that indeed the most recent price spike exceeds what was forecast, so this is the opening for Summers and those who agree with him to argue that inflation is indeed a real risk that calls for a change of policy, or at least of rhetoric in preparation to change policy. Here is where Summers seems to fall down. The people at the Fed, led as near as I can tell by the astute Jim Bullard, have argued that nearly all price increases we would see are temporary surges associated with pandemic-induced supply chain problems, with the global shipping issue at the top of the list with its now tripling of costs. A sign of this is the most dramatic price increases one hears about, such as for copper, have been overwhelmingly among raw materials and commodities rather than final consumer goods, although there certainly has been some passthrough for many of those. But even with those, some appear to have perhaps stopped rising, notably that headline maker, gasoline prices, which seem to have stopped rising after the freakout following the Colonial Pipeline shutdown that set off people waiting in lines a la 1979 (and getting on Fox News screaming about hyperinflation and blaming it on Biden).
Chicago Fed: “Index suggests economic growth moderated in April” – “Index suggests economic growth moderated in April.” This is the headline for this morning’s release of the Chicago Fed’s National Activity Index, and here is the opening paragraph from the report: The Chicago Fed National Activity Index (CFNAI) declined to +0.24 in April from +1.71 in March. Three of the four broad categories of indicators used to construct the index made positive contributions in April, but three categories deteriorated from March. The index’s three-month moving average, CFNAI-MA3, decreased to +0.07 in April from +0.35 in March. [Download report] The Chicago Fed’s National Activity Index (CFNAI) is a monthly indicator designed to gauge overall economic activity and related inflationary pressure. It is a composite of 85 monthly indicators as explained in this background PDF file on the Chicago Fed’s website. The index is constructed so a zero value for the index indicates that the national economy is expanding at its historical trend rate of growth. Negative values indicate below-average growth, and positive values indicate above-average growth. The first chart below shows the recent behavior of the index since 2007. The red dots show the indicator itself, which is quite noisy, together with the 3-month moving average (CFNAI-MA3), which is more useful as an indicator of the actual trend for coincident economic activity.
Q1 GDP Growth Unchanged at 6.4% Annual Rate — From the BEA: Gross Domestic Product, 1st Quarter 2021 (Second Estimate); Corporate Profits, 1st Quarter 2021 (Preliminary Estimate) Real gross domestic product (GDP) increased at an annual rate of 6.4 percent in the first quarter of 2021 , according to the “second” estimate released by the Bureau of Economic Analysis. In the fourth quarter of 2020, real GDP increased 4.3 percent. The GDP estimate released today is based on more complete source data than were available for the “advance” estimate issued last month. In the advance estimate, the increase in real GDP was also 6.4 percent. Upward revisions to consumer spending and nonresidential fixed investment were offset by downward revisions to exports and private inventory investment. Imports, which are a subtraction in the calculation of GDP, were revised up Here is a Comparison of Second and Advance Estimates. PCE growth was revised up from 10.7% to 11.3%. Residential investment was revised up from 10.8% to 12.7%. This was slightly below the consensus forecast.
Q1 Real GDP Per Capita: 6.4% Versus the 6.1% Headline Real GDP -The Second Estimate for Q1 GDP came in at 6.4% (6.40% to two decimals), up from 4.3% (4.33% to two decimals) in Q4 2020. With a per-capita adjustment, the headline number is lower at 6.15% to two decimal points.Here is a chart of real GDP per capita growth since 1960. For this analysis, we’ve chained in today’s dollar for the inflation adjustment. The per-capita calculation is based on quarterly aggregates of mid-month population estimates by the Bureau of Economic Analysis, which date from 1959 (hence our 1960 starting date for this chart, even though quarterly GDP has is available since 1947). The population data is available in the FRED series POPTHM. The logarithmic vertical axis ensures that the highlighted contractions have the same relative scale.The chart includes an exponential regression through the data using the Excel GROWTH function to give us a sense of the historical trend. The regression illustrates the fact that the trend since the Great Recession has a visibly lower slope than the long-term trend. In fact, the current GDP per-capita is 9.8% below the pre-recession trend (2008). The real per-capita series gives us a better understanding of the depth and duration of GDP contractions. As we can see, since our 1960 starting point, the recession that began in December 2007 is associated with a deeper trough than previous contractions, which perhaps justifies its nickname as the Great Recession.The standard measure of GDP in the US is expressed as the compounded annual rate of change from one quarter to the next. The current real GDP is 6.4%. But with a per-capita adjustment, the data series is lower at 6.1%. The 10-year moving average illustrates that US economic growth has slowed dramatically since the last recession and dropped significantly at the start of the COVID-19 recession, only to bounce back soon after.
Seven High Frequency Indicators for the Economy –These indicators are mostly for travel and entertainment. It will interesting to watch these sectors recover as the vaccine is distributed. The TSA is providing daily travel numbers.This data shows the seven day average of daily total traveler throughput from the TSA for 2019 (Light Blue), 2020 (Blue) and 2021 (Red). The dashed line is the percent of 2019 for the seven day average. This data is as of May 23rd. The seven day average is down 32.0% from the same day in 2019 (68.0% of 2019). (Dashed line) The second graph shows the 7 day average of the year-over-year change in diners as tabulated by OpenTable for the US and several selected cities. OpenTable notes: “we’ve updated the data including downloadable dataset from January 1, 2021 onward to compare seated diners from 2021 to 2019, as opposed to year over year.” This data is updated through May 22, 2021. Note that this data is for “only the restaurants that have chosen to reopen in a given market”. Since some restaurants have not reopened, the actual year-over-year decline is worse than shown. Dining picked up during the holidays, then slumped with the huge winter surge in cases. Dining was picking up again. Florida and Texas are above 2019 levels. This data shows domestic box office for each week and the median for the years 2016 through 2019 (dashed light blue). The data is from BoxOfficeMojo through May 20th. Movie ticket sales were at $32 million last week, down about 83% from the median for the week. This graph shows the seasonal pattern for the hotel occupancy rate using the four week average. Occupancy is now slightly above the horrible 2009 levels. This data is through May 15th. Hotel occupancy is currently down 16% compared to same week in 2019). Note: Occupancy was up year-over-year, since occupancy declined sharply at the onset of the pandemic. However, occupancy is still down significantly from normal levels. This graph, based on weekly data from the U.S. Energy Information Administration (EIA), shows gasoline supplied compared to the same week of 2019. As of May 14th, gasoline supplied was off about 2.2% (about 97.8% of the same week in 2019). Gasoline supplied was up year-over-year, since at one point, gasoline supplied was off almost 50% YoY in 2020. This graph is from Apple mobility. From Apple: “This data is generated by counting the number of requests made to Apple Maps for directions in select countries/regions, sub-regions, and cities.” This is just a general guide – people that regularly commute probably don’t ask for directions. There is also some great data on mobility from the Dallas Fed Mobility and Engagement Index. ![]() This data is through May 22nd for the United States and several selected cities. The graph is the running 7 day average to remove the impact of weekends. According to the Apple data directions requests, public transit in the 7 day average for the US is at 78% of the January 2020 level and moving up. Here is some interesting data on New York subway usage. This graph is from Todd W Schneider. This is weekly data since 2015. Most weeks are between 30 and 35 million entries, and currently there more than 11 million subway turnstile entries per week – and increasing. This data is through Friday, May 21st.
This data is through May 22nd for the United States and several selected cities. The graph is the running 7 day average to remove the impact of weekends. According to the Apple data directions requests, public transit in the 7 day average for the US is at 78% of the January 2020 level and moving up. Here is some interesting data on New York subway usage. This graph is from Todd W Schneider. This is weekly data since 2015. Most weeks are between 30 and 35 million entries, and currently there more than 11 million subway turnstile entries per week – and increasing. This data is through Friday, May 21st.
Biden Unveils $6 Trillion Spending Plan – WSJ – President Biden’s $6 trillion budget proposal unveiled Friday charts his vision of an expansive federal government role in the economy and the lives of Americans, with big increases in spending on infrastructure, public health and education along with tax hikes on corporations and the wealthy.The Biden administration is seeking $1.52 trillion for the military and domestic programs in fiscal year 2022, which begins Oct. 1, an 8.6% increase from the $1.4 trillion enacted last year, excluding emergency measures to combat the Covid-19 pandemic.The proposal would shift more federal resources from the military, which would see a 1.6% rise in spending next year, to domestic programs such as scientific research and renewable energy, which would get 16.5% more funding under the president’s plan in 2022. The White House detailed costs for its proposals to spend $4.5 trillion over the next decade on infrastructure and social programs, which the administration is hoping to advance through Congress this summer. The plan includes $17 billion next year for improvements such as repairs to roads, bridges and airports, $4.5 billion to replace lead water pipes across the country, and $13 billion to expand high-speed broadband.Plans to provide universal preschool and ensure teachers at those schools earn $15 an hour would cost $3.5 billion in 2022. The budget would also provide $8.8 billion next year on direct spending on families, including $6.7 billion for affordable child care and $750 million for paid leave. Those costs would rise substantially in 2023 and beyond.Mr. Biden’s budget blueprint serves to advance some of his administration’s most ambitious goals: Reducing disparities in incomes and wealth through the tax code, curbing greenhouse gas emissions and putting the U.S. on a stronger footing to compete with China in the global battle for economic and technological supremacy.”It’s a bold, aspirational, progressive budget, but it’s also problematic,” said G. William Hoagland, a senior vice president at the Bipartisan Policy Center and former Senate GOP budget aide, who said he was concerned about the shift away from containing federal deficits. “This really is something that’s equivalent to the Roosevelt years coming out of the Depression.”The president’s ability to enact his agenda will depend on Congress, where Democrats have slim majorities. Lawmakers routinely ignore the White House’s budget requests in favor of their own plans, and some Democratic lawmakers have expressed reservations about Mr. Biden’s proposals to raise taxes on businesses and high-income households.Passing a budget in Congress unlocks reconciliation, a process that allows lawmakers to pass legislation directly related to the budget with a simple Senate majority, instead of the usual 60 votes.Democrats used reconciliation to approve Mr. Biden’s $1.9 trillion Covid-19 relief bill earlier this year and are weighing whether to use it again to advance the rest of his economic agenda without Republican support.Democratic lawmakers said the plan would provide money for long overdue investments after years of spending constraints. Republicans assailed it as an unwarranted intrusion of the federal government in the economy that risks stoking inflation and adding to the federal debt.Sen. Jerry Moran (R., Kan.) called it “a budget that will raise taxes, cause prices to skyrocket and saddle future generations with burdensome levels of debt.”
Biden’s $6T Budget: Social Spending, Taxes on Business – (AP) – — President Joe Biden is proposing a $6 trillion budget for next year that’s piled high with new safety net programs for the poor and middle class, but his generosity depends on taxing corporations and the wealthy to keep the nation’s spiking debt from spiraling totally out of control. Biden inherited record pandemic-stoked spending and won a major victory on COVID-19 relief earlier this year. Friday’s rollout adds his recently announced infrastructure and social spending initiatives and fleshes out his earlier plans to sharply increase spending for annual Cabinet budgets. This year’s projected deficit would set a new record of $3.7 trillion that would drop to $1.8 trillion next year – still almost double pre-pandemic levels. The national debt will soon breach $30 trillion after more than $5 trillion in already approved COVID-19 relief. As a result, the government must borrow roughly 50 cents of every dollar it spends this year and next. With the deficit largely unchecked, Biden would use proposed tax hikes on businesses and high-earning people to power huge new social programs like universal prekindergarten, large subsidies for child care and guaranteed paid leave. “The best way to grow our economy is not from the top down, but from the bottom up and the middle out,” Biden said in his budget message. “Our prosperity comes from the people who get up every day, work hard, raise their family, pay their taxes, serve their Nation, and volunteer in their communities.” The budget incorporates the administration’s eight-year, $2.3 trillion infrastructure proposal and its $1.8 trillion American Families Plan and adds details on his $1.5 trillion request for annual operating expenditures for the Pentagon and domestic agencies. Acting White House budget chief Shalanda Young said the Biden plan “does exactly what the president told the country he would do. Grow the economy, create jobs and do so responsibly by requiring the wealthiest Americans and big corporations to pay their fair share.” Biden’s budget is sure to give Republicans fresh ammunition for their criticisms of the new Democratic administration as bent on a “tax and spend” agenda that would damage the economy and impose a crushing debt burden on younger Americans. Republicans also say he’s shorting the military.
Money is cheap, let’s spend it – White House $6 trillion budget message (Reuters) – The White House on Friday sent Congress a $6 trillion budget plan that would ramp up spending on infrastructure, education and combating climate change, arguing it makes good fiscal sense to invest now, when the cost of borrowing is cheap, and reduce deficits later.The first comprehensive budget offered by Democratic President Joe Biden faces strong opposition from Republican lawmakers, who want to tamp down U.S. government spending and reject his plans to hike taxes on the rich and big corporations. Biden’s plan for fiscal year 2022 calls for $6.01 trillion in spending and $4.17 trillion in revenues, a 36.6% increase from 2019 outlays, before the coronavirus pandemic bumped up spending. It projects a $1.84 trillion deficit, a sharp decrease from the past two years because of the COVID-19 pandemic, but up from 2019’s $984 billion.The blueprint builds on a partial “skinny budget” the White House released last month that mapped out $1.5 trillion in discretionary spending.The plan drew praise from Democrats, including House Speaker Nancy Pelosi, and criticism from Republicans – who blasted the proposed higher debt levels – and some progressive groups, who said it should have scaled back military spending. Senate Budget Committee Chairman Bernie Sanders called Biden’s budget “the most significant agenda for working families in the modern history of our country,” and said it would create millions of good-paying jobs, while reducing poverty.Senate Majority Leader Mitch McConnell heaped scorn on the plan, and warned Democrats to “move beyond the socialist daydream and the go-it-alone partisanship.””President Biden’s proposal would drown American families in debt, deficits, and inflation,” McConnell said in a tweet. White House officials said Biden’s $4 trillion plans to address historic U.S. inequality, climate chance and provide four more years of free public education would be completely paid for in 15 years, with tax increases starting to chip away at deficits after 2030. Cecilia Rouse, the chair of Biden’s Council of Economic Advisers, says Biden’s plan is front loaded and that the administration was willing to live with budget deficits amid low-interest rates to make significant investments in the nation’s economy. She projected a drop in deficits by over $2 trillion in the following years. “That is a sharp departure from unpaid tax cuts under the prior administration that seriously worsened our long-term fiscal problem,” she said. “The most important test of our fiscal health is real interest payments on the debt. That’s what tells us whether debt is burdening our economy and crowding out other investments.” While rates on U.S. Treasury securities have climbed off record lows seen at the height of the coronavirus crisis last year, the government’s borrowing costs are still the lowest they have been in years. Rouse said the economy was seeing short-term inflation spikes, fueled by the sharp growth in the economy, but projected it settling down to an annual rate of around 2% over time. Increased investment would boost U.S. economic growth, with the current conservative White House forecast calling for 2% gross domestic product growth in 2031, compared with the Federal Reserve’s estimate of 1.8%. Biden’s first full spending outline since taking office in January serves as the fiscal blueprint for his political priorities, and is likely to kick off months of difficult negotiations with Congress, which needs to approve most of the spending.
Takeaways from Biden’s budget: record debt, looming fight on taxes – The $6 trillion budget proposed by President Joe Biden on Friday gives a fuller fiscal picture than an April preview, in which he laid out his spending priorities. The plan details taxes and spending for the fiscal year that begins in October. But a 10-year outlook also incorporates the multi-year spending on infrastructure, education, child care and other domestic programs proposed through what Biden has called is American Jobs and American Families plans. It’s up to Congress, which is narrowly controlled by Democrats, to decide what gets implemented. The budget projects the federal debt would increase, relative to the size of the economy, to a higher level than during World War II.That will give Republicans more fodder for their attacks on Biden’s “tax and spend” agenda.During the World War II era, debt peaked at 106% of gross domestic product in 1946. Under Biden’s plan, debt is projected to rise to 117% of the size of the economy by 2031. Without changes, it’s expected to grow to 113% of GDP.The administration argues that the level of interest payments, rather than the size of the debt, is the most relevant benchmark for whether debt is burdening the economy. The government’s annual interest payments after adjusting for inflation would remain well below the historic average throughout the next decade, according to the White House.The government would spend $1.8 trillion more than it’s projected to take in next year.But by 2031, the deficit would decline, relative to the size of the economy, to a smaller share than it would be without Biden’s changes.That’s in part because Biden has proposed paying for some of his ambitious agenda through higher taxes on corporations and the wealthiest households.But the president’s plan does not address the structural deficit that existed before the pandemic. That imbalance is driven by an aging population, rising health care costs, compounding interest – and the lack of sufficient tax revenues to keep up. Biden’s budget assumes that reductions in taxes approved in 2017 under President Donald Trump will still expire in 2025, as is current law. If that happens, however, that would violate Biden’s campaign to not raise taxes on Americans making $400,000 or less.Although Biden campaigned on lowering the enrollment age for Medicare and creating a public insurance option, his plan does not include a way to do that. Instead, the proposal only calls on Congress to take action this year to lower prescription drug costs and expand and improve health coverage.The plan notes that the money saved from reducing the amount of money Medicare pays for prescription drugs could be used to pay for coverage expansion. But congressional Democrats are divided over how to address drug prices as well as how to spend the savings.
President Biden’s budget shows what true “fiscal responsibility” means: Pushing the economy closer to full employment, reducing inequality, and measuring the debt burden more accurately – EPI Blog by Josh Bivens – The Biden administration released the President’s budget today – a proposal for tax and spending policies they would like to see become law over the next year. It includes substantial investments in traditional infrastructure, child care and early education, higher education, and elder care. It also calls for recurring cash payments to families with children. It includes money for more generous subsidies through the Affordable Care Act (ACA), substantial increases in Medicare and Medicaid coverage, and calls on Congress to undertake permanent reforms to modernize the nation’s fragmented and inadequate unemployment insurance system. The proposal also calls on Congress to develop comprehensive legislation to strengthen and extend protections against the abusive practice of misclassifying employees as independent contractors and uses federal housing grants to incentivize inclusionary zoning practices to alleviate the nation’s housing shortage. On the tax side, it raises taxes on realized capital gains, on corporate income, and closes loopholes and tightens enforcement in an effort to raise revenue through greater tax complianceAbout 18 months ago, we at EPI released a blueprint for guiding fiscal policymakers. In this blueprint, we identified the main targets of fiscal policy as: ensuring high-pressure labor markets and low unemployment, reducing inequality, and then (and only then) reducing the economic obligations incurred by the public debt. The Biden administration’s budget (particularly given the passage of the American Rescue Plan earlier this year) scores extremely high on these marks. Specifically:
- The mix of spending and progressive tax increases would provide a large expansionary boost to aggregate demand in coming years. This provides a powerful backstop for efforts to push unemployment to very low levels and to generate high-pressure labor markets that boost wages, with the goal of eventually reaching full employment. For example, the budget forecasts an unemployment rate at 4.1% or below as soon as 2022 and persisting for the rest of the 10-year budget window.
- The budget would unambiguously reduce inequality, mostly through its taxes on capital income – income accruing to households simply by virtue of them owning wealth. However, the spending side of the budget also ensures a more equitable distribution of the benefits of economic growth, even if many of them would not show up directly in measures of household income. The care investments included in the budget, for example, may not boost household income directly, but would remove a large cost item from the household budgets of families.
- The budget’s debt targets focus on a much more sensible measure than previous budgets: the inflation-adjusted interest payments on public debt (or, the real debt service ratio). This indicator is a far better metric for measuring the burden of public debt. It should replace the ratio of public debt to gross domestic product (GDP) as the standard measure used in fiscal debates. This real debt service ratio shows historically low burdens from public debt today.
- This ratio tells us something clear about upcoming fiscal debates: As useful as the tax increases in the Biden budget are, if the legislative process does not allow the full amount of these tax increases to become law, this does not mean that the spending proposals should be scaled back. Instead, they should simply be financed with debt.
Below, we expand a bit on each of these points.
One Thing Missing From the Biden Budget: Booming Growth – For all the administration’s focus on transformational policies, it’s not forecasting an outburst of economic potential. By Neil Irwin President Biden’s budget proposal includes billions of dollars for clean energy, education and child care – ideas being sold for their potential to increase America’s economic potential. One thing it does not include: an outright economic boom. In the assumptions that underpin the administration’s budget, economic growth is strong in 2021 and 2022 – but strong enough only to return the economy to its prepandemic trend line, not to surge above the trajectory it was on throughout the 2010s. In 2023, G.D.P. growth falls to 2 percent in the budget assumptions, then to 1.8 percent a year through the mid-2020s. That is lower than the 2.3 percent average annual growth rate experienced from 2010 to 2019. The administration’s restrained outlook is consistent with projections by other forecasters, including at the Congressional Budget Office and in the private sector. But it means that the Biden White House is not – at least not formally – forecasting the kind of rip-roaring growth that characterized periods like 1983 to 1989 (with an average annual G.D.P. growth of 4.4 percent) and 1994 to 2000 (4 percent). Those surges, among other things, helped propel two presidents to comfortable re-elections. If the new projections were to prove accurate, it would imply two years of strong growth paired with moderate inflation as the nation recovers from the pandemic heading into the 2022 midterm elections, but then comparatively low growth in the run-up to the 2024 election. The sober estimate contrasts with the approach Mr. Biden has taken to selling his agenda publicly. The framing of his signature plans for infrastructure and family support has been that they will enable the economy to become more vibrant and productive … .
First Biden Budget Retains Trump-Era Business Tax Break – WSJ Owners of closely held businesses would still get a 20% tax deduction under President Biden’s tax plan, leaving high-income people who run construction companies and manufacturing firms benefiting – for now – from a provision that Republicans created in 2017over Democratic opposition.Although Mr. Biden campaigned on limiting the break, the deduction went untouched in the first $2.4 trillion worth of net tax increases that were detailed by the Biden administration on Friday.Administration officials haven’t said why they haven’t proposed curbing the break at this point, and the White House didn’t comment. Treasury officials said Friday that some campaign proposals need more work and others may appear in future plans.The deduction “just seems to be kind of without redeeming qualities and frankly, I was a little surprised that the Biden administration didn’t propose curtailing it,” said William Gale, a senior fellow at the Brookings Institution, a left-leaning Washington think tank. Kevin Kuhlman, vice president of government relations at the National Federation of Independent Business, said he had been bracing for the deduction to be removed.”There is a sensitivity to direct tax increases on small businesses and I think that’s one of the reasons it may not have been included,” he said.He and other advocates of the provision say congressional Democrats’ wariness about some Biden tax-increase proposals could lead them to seek to change this break as a potential alternative way to raise money.”That’s where you fear this getting resurrected, particularly when you consider the revenue pressure they’re going to be under,” said Dustin Stamper, tax legislative affairs practice leader at accounting firm Grant Thornton LLP.Sen. Ron Wyden (D., Ore.), chairman of the Senate Finance Committee, is working on a series of changes to the break that could sharply curb it for the highest-income households while opening it up to upper-middle-class service-business owners.”I’m looking at ways to revamp the deduction to ensure it’s not just a giveaway to the top,” Mr. Wyden said. “The benefit could be made more generous for middle-class small-business owners and still generate revenue for other priorities like child care.”Congress created the tax break – Section 199A of the tax code – in the 2017 tax law that got through Congress without a single Democratic vote. It gives a deduction worth 20% of income – basically a 20% rate cut – to business income that shows up on individual tax returns. That includes income from partnerships, sole proprietorships and S corporations, all of which are known as pass-through businesses because their income passes through to their owners without the separate business-level taxes that typically apply to corporations.
US State Dept Issues “Do Not Travel” Advisory For Japan As Calls To Cancel Olympics Intensify –Much to the chagrin of Japan’s political leaders, worsening COVID-19 cases are prompting more critics, including SoftBank Chairman Masayoshi Son (one of the country’s most high-profile businessmen), to warn that the Olympics should be canceled as hospitals in the country’s second-largest city, Osaka, struggle to treat a huge wave of hospitalized patients as Japan becomes the latest Asian nation to fall victim to a new wave of the virus. The western Japanese region of Osaka is home to 9 million people, and is suffering the brunt of what Reuters described as Japan’s “fourth wave of the pandemic.” Only half of the region’s medical staff are vaccinated, which “underscores the challenge of hosting a major global sports event in two months time,” Reuters added. “Simply put, this is a collapse of the medical system,” said Yuji Tohda, the director of Kindai University Hospital in Osaka. Fortunately for the government, the surge is already showing some signs of abating. Tokyo, the site of the upcoming Summer Olympics (which were postponed after the pandemic made the Games a virtual impossibility last year) reported 340 new cases on Monday, down from 535 a day earlier, bringing the seven-day average of new cases in the capital to 638, which is 18.7% lower than the prior week. Osaka meanwhile registered 216 new infections, down from 274 a day ago and the first time in two months that the number of new cases in the western Japan prefecture fell below 300 for two consecutive days. Tokyo, Osaka and seven other prefectures are currently under a state of emergency that has been extended through May 31. Japan has recorded more than 700,000 infections and 12,000 Covid-19 deaths from the virus.Shortly after the warnings from Masa-san and news (below) of Japan’s push for a amass vaccination program, the US State Department has cranked up the pressure to ’11’ by issuing a Level 4 Travel Advisory for visitors to Japan. “Do not travel to Japan due to COVID-19.”The Centers for Disease Control and Prevention (CDC) has issued a Level 4 Travel Health Notice for Japan due to COVID-19, indicating a very high level of COVID-19 in the country. There are restrictions in place affecting U.S. citizen entry into Japan. Visit the Embassy’s COVID-19 page for more information on COVID-19 in Japan. So the question is – will the US send their athletes?
Fauci ‘not convinced’ COVID developed naturally, backs investigation –Dr. Anthony Fauci, a top adviser to President Biden on the coronavirus pandemic, said he’s “not convinced” the deadly virus developed naturally and has called for further investigations into where it emerged. Fauci was asked during a Poynter event, “United Facts of America: A Festival of Fact-Checking,”earlier this month about whether he was confident that COVID-19 developed naturally.”No actually. I am not convinced about that. I think we should continue to investigate what went on in China until we continue to find out to the best of our ability what happened,” Fauci, the director of the National Institute of Allergies and Infectious Diseases, said, according to Fox News. “Certainly, the people who investigated it say it likely was the emergence from an animal reservoir that then infected individuals, but it could have been something else, and we need to find that out. So, you know, that’s the reason why I said I’m perfectly in favor of any investigation that looks into the origin of the virus,” he added. The coronavirus was first reported in the Chinese city of Wuhan in December 2019, and many believe it could have begun in a lab there and escaped. Fauci was pressed on that theory during a Senate hearing on May 11 and said he would support a further investigation during an exchange with Sen. Roger Marshall (R-Kansas). “Do you think it’s possible that COVID-19 arose from a lab accident … in Wuhan, and should it be fully investigated?” Marshall, a doctor, asked Fauci. “That possibility certainly exists, and I am totally in favor of a full investigation of whether that could have happened,” he replied.
Biden orders 90-day review of COVID origins, ‘lab leak’ theory -President Biden on Tuesday ordered US spy agencies to do a 90-day investigation into whether COVID-19 was released by a Chinese lab – with the White House saying it isn’t ruling out anything, including deliberate release of the virus.Biden made the abrupt pivot after his administration insisted for weeks that it would defer to the World Health Organization for answers on how the pandemic started.Biden said in a statement that two theories predominate current US official thinking. Those theories are that the virus emerged naturally from animals or escaped from a lab in Wuhan, China.”As of today, the U.S. Intelligence Community has ‘coalesced around two likely scenarios’ but has not reached a definitive conclusion on this question,” Biden said.”Here is their current position: ‘while two elements in the [intelligence community] leans toward the former scenario and one leans more toward the latter – each with low or moderate confidence – the majority of elements do not believe there is sufficient information to assess one to be more likely than the other.'” Biden released the statement after his chief medical adviser Dr. Anthony Fauci was grilled Wednesday by senators about whether the WHO is beholden to China. A preliminary WHO study controlled by China this year concluded the virus likely emerged naturally. CNN reported on Tuesday that the Biden administration closed down a probe into whether COVID-19 originated at the Wuhan Institute of Virology. White House Deputy Press Secretary Karine Jean-Pierre said at a press briefing that no explanation is being ruled out for the pandemic’s origins.”We haven’t ruled out anything yet,” Jean-Pierre said when asked if the Biden administration had ruled out a “deliberate” release of the virus.
White House embraces “Wuhan Lab” conspiracy theory -On Wednesday, US President Joe Biden publicly embraced the conspiracy theory that COVID-19 may have been released from China’s Wuhan Institute of Virology (WIV), ordering the US intelligence agencies to produce a report within 90 days into the potentially man-made origins of the disease. The intelligence agencies tasked with determining whether COVID-19 is a biological weapon played a leading role in one of the greatest crimes of the twenty-first century – the 2003 US invasion of Iraq, based on allegations manufactured by the Central Intelligence Agency that Iraq possessed chemical, biological, and nuclear “weapons of mass destruction.” That lie led to the death of over 1 million people and engulfed the Middle East in war that has lasted to this day. Now, an even greater and more dangerous lie is being perpetrated. The Biden administration, like the Trump administration before it, is attempting to blame China for a disease that led by some estimates to the deaths of at least 1 million people in the US. If, as the Trump administration publicly asserted, COVID-19 is a “weaponized virus” sent by Beijing against the American population, it would constitute grounds for war against the most populous country in the world. As with “weapons of mass destruction,” leaks from anonymous intelligence officials are being presented as evidence in a coordinated media campaign. Within a matter of a few days, the entire US media has embraced this discredited conspiracy theory, summed up by an article by the Washington Post ‘s lead fact checker entitled “How the Wuhan lab-leak theory suddenly became credible.” The stage for this sudden reversal was set by an article published in the Wall Street Journal Sunday, claiming that “a previously undisclosed US intelligence report” reveals three staff at the institute became sick and sought hospital care in November 2019. The article implied that these three cases are the real origin of the COVID-19 pandemic. The Journal article, however, includes nothing fundamentally new beyond the contents of a fact sheet published by the Trump State Department on January 15. In other words, the most the CIA, NSA and their counterparts could find, funded with tens of billions of dollars to spy on the entire world, is that a few people who work at the WIV happened to get symptoms that the State Department fact sheet itself admits are “consistent with … common seasonal illnesses” the month before the virus was first detected.
US joins calls for transparent, science-based investigation into Covid origins – The United States and other countries have called for a more in-depth investigation of the pandemic origins, after an international mission to China earlier this year proved inconclusive. Addressing the World Health Organization’s main annual meeting of member states in Geneva, representatives from several countries stressed the continued need to solve the mystery of how Covid-19 first began spreading among humans. “We underscore the importance of a robust comprehensive and expert-led inquiry into the origins of Covid-19,” US representative Jeremy Konyndyk told the meeting on Tuesday. Australia, Japan and Portugal were among other countries to call for more progress on the investigation, while the British representative urged for any probe to be “timely, expert-driven and grounded in robust science”. Determining how the virus that causes Covid-19 began spreading is seen as vital to preventing future outbreaks. But a long-delayed report by the team of international experts sent to Wuhan and their Chinese counterparts drew no firm conclusions as to the origins of the pandemic. Instead, they ranked a number of hypotheses according to how likely they believed they were. The report said the virus jumping from bats to humans via an intermediate animal was the most probable scenario, while it said a theory involving the virus leaking from a laboratory was “extremely unlikely”. After the report was released, however, WHO chief Tedros Adhanom Ghebreyesus insisted all theories remained on the table.
Chinese embassy in U.S. says politicising COVID-19 origins hampers investigations (Reuters) – Politicizing the origins of COVID-19 would hamper further investigations and undermine global efforts to curb the pandemic, China’s U.S. embassy said after President Joe Biden ordered a review of intelligence about where the virus emerged. The embassy in Washington said in a statement on its website on Wednesday evening “some political forces have been fixated on political manipulation and (the) blame game”. As the World Health Organization (WHO) prepares to begin a second phase of studies into the origins of COVID-19, China has been under pressure to give investigators more access amid allegations that SARS-CoV-2 leaked from a laboratory specialising in coronavirus research in the city of Wuhan. China has repeatedly denied the lab was responsible, saying the United States and other countries were trying to distract from their own failures to contain the virus. Biden said on Wednesday that U.S. intelligence agencies were divided about whether COVID-19 “emerged from human contact with an infected animal or from a laboratory accident”. Yanzhong Huang, senior fellow for global health with the Council on Foreign Relations in Washington, said China’s lack of openness was a major factor behind the resurgence of the lab leak theory. “There’s nothing really new there to prove the hypothesis,” he said. “In the investigation of the origins of the pandemic it is really important to have transparency in order to build trust in the investigation results.” The Chinese embassy said it supports “a comprehensive study of all early cases of COVID-19 found worldwide and a thorough investigation into some secretive bases and biological laboratories all over the world.” The Global Times tabloid, part of the ruling Communist Party’s People’s Daily newspaper group, said late on Wednesday that if the “lab leak theory” is to be further investigated, the United States should also allow investigators into its own facilities, including the lab at Fort Detrick.
“Fact-Checking” Takes Another Beating: Taibbi –The news business just can’t stop clowning itself. The latest indignity is an international fact-checking debacle originating, of all places, at a “festival of fact-checking.”The Poynter Institute is perhaps the most respected think tank in our business, an organization seeking to “fortify journalism’s role in a free society,” among other things through its sponsorship of the fact-checking outlet PolitiFact. A few weeks back, it held a virtual convention called the “United Facts of America: A Festival of Fact-Checking.”The three-day event featured special guests Christiane Amanpour, Dr. Anthony Fauci, Brian Stelter, and Senator Mark Warner – a lineup of fact “stars” whose ironic energy recalled the USO’s telethon-execution of Terrance and Phillip before the invasion of Canada in South Park: Bigger, Longer, and Uncut. Tickets were $50, but if you wanted a “private virtual happy hour” with Stelter, you needed to pay $100 for the “VIP Experience.”During the confab, PolitiFact’s Katie Sanders asked Fauci, “Are you still confident that [Covid-19] developed naturally?” To which the convivial doctor answered, “No, I’m not convinced of that,” going on to say “we” should continue to investigate all hypotheses about how the pandemic began:Conservatives in particular were quick to point out that Fauci last year said, “Everything about the stepwise evolution over time strongly indicates that [this virus] evolved in nature and then jumped species.” At that time last May, of course, the issue of the pandemic’s origin had already long since been politicized, with Donald Trump’s administration anxious to point a finger at China for causing the disaster. Mike Pompeo went so far as to say there was “enormous evidence” the disease had been created at the Wuhan Institute of Virology. Fauci was touted as a hero for pushing back on this and many other things.Fauci’s new quote about not being “convinced” that Covid-19 has natural origins, however, is part of what’s becoming a rather ostentatious change of heart within officialdom about the viability of the so-called “lab origin” hypothesis. Through 2020, officials and mainstream press shut down most every discussion on that score. Reporters were heavily influenced by a group letter signed by 27 eminent virologists in the Lancet last February in which the authors said they “strongly condemn conspiracy theories suggesting that COVID-19 does not have a natural origin,” and also by a Nature Medicine letter last March saying, “Our analyses clearly show that SARS-CoV-2 is not a laboratory construct.” The consensus was so strong that some well-known voices saw social media accounts suspended or closed for speculating about Covid-19 having a “lab origin.” One of those was University of Hong Kong virologist Dr. Li-Meng Yan, who went on Tucker Carlson’s show last September 15th to say “[Covid-19] is a man-made virus created in the lab.” After that appearance, PolitiFact – Poynter’s PolitiFact – gave the statement its dreaded “Pants on Fire” rating.
Facebook Stops Removing Posts Claiming COVID-19 Man-Made After Lab-Leak Hypothesis Finally Goes Mainstream –After nearly 18 months of punishing anyone who suggested that COVID-19 might have originated in a Wuhan lab, Facebook has decided to stop removing posts which claim the virus was man-made or manufactured, a company spokesperson told Politico on Wednesday. The move comes after the Wall Street Journal reported that three lab workers at the Wuhan Institute of Virology were hospitalized in late 2019 with symptoms consistent with the virus – building on previous reporting by the Washington Post‘s Josh Rogin. Both articles cast doubt on the mainstream media’s unsupported claim that COVID-19 jumped from bats to humans through an intermediary species – as opposed to the far more plausible theory that the virus escaped from a labknown for manipulating bat coronaviruses to better infect humans, in the same town which became ground zero for the pandemic. As we noted last week, there were very obvious clues to anyone able to think for themselves. As the mainstream media parroted CCP talking points throughout 2020 and punished anyone who strayed from the official narrative, Facebook banned Zero Hedge articles and policed COVID ‘disinformation’ based on the word of so-called “fact checkers” who insisted that the new disease could only have emerged via yet-to-be discovered animal intermediaries.Of course, one of Facebook’s “fact checkers” also worked at the Wuhan lab, and was defending her former colleagues in a giant undisclosed conflict of interest.
COVID pandemic spawns vaccine billionaires amid global mass death — Profits reaped from the production of COVID-19 vaccines have spawned nine new billionaires with a combined wealth of $19.3 billion. They have likewise fattened the portfolios of eight existing billionaires with fortunes tied to corporations involved in vaccine production by $32 billion. These staggering figures, exposing an obscene accumulation of private wealth in the midst of global mass death and immiseration, were released in a report produced by an alliance of aid organizations in advance of a G20 Global Health Summit. The report estimates that the newly minted fortunes of Moderna and Pfizer CEOs and investors-turned-billionaires could pay to vaccinate all 780 million people in the so-called “low-income countries” 1.3 times over.The $32 billion raked in by the pre-existing billionaires over the past year would pay for the full vaccination of all 1.4 billion people in India. The country is the new epicenter of the COVID-19 catastrophe, where infections have doubled in the past two months. Recorded daily deaths have risen to 4,000, overwhelming the health care system and overflowing crematoriums and burial grounds with bodies.The new vaccine billionaires include Stephane Bancel, Moderna’s CEO ($4.3 billion); Ugur Sahin, CEO and co-founder of BioNTech ($4 billion); Timothy Springer, an immunologist and founding investor of Moderna ($2.2 billion), and Noubar Afeyan, Moderna’s chairman ($1.9 billion).The foundation for the immense wealth amassed by these individuals was laid by government-funded research at the National Institutes of Health (NIH) and university laboratories, along with the outlay of some $10.5 billion in public funding for the development and production of vaccines.
Preliminary data show CEO pay jumped nearly 16% in 2020, while average worker compensation rose 1.8% –EPI Blog -Data from large firms filing information on CEO compensation through the end of April show corporations and a strong stock market shielded CEOs from the financial impact of the pandemic.An examination of the early filings of 281 large firms shows:
- The offer by CEOs to forgo salary increases during the pandemic was largely symbolic. Salaries were stable, but many CEOs pocketed a windfall by cashing in stock options and obtaining vested stock awards, compounding income inequalities laid bare during the past year.
- CEO compensation, including realized stock options and vested stock awards, rose 15.9% from 2019 to 2020 among early reporting firms. Growth in CEO compensation was slightly faster than last year’s strong growth – 14.0% between 2018 and 2019 – while the annual compensation of the average worker increased just 1.8% in 2020.
- Strong CEO compensation growth and modest growth in worker annual compensation yielded a remarkable growth in the CEO-to-worker compensation ratio, which jumped from 276.2 in 2019 to 307.3 in 2020 among early reporting firms. In firms that retained the same CEO, the CEO-to-worker compensation ratio rose to 341.6 in 2020, up from 278.9 in 2019.
The Institute for Policy Studies also looked at a more limited sample of early reporting firms (the 100 S&P 500 firms with the lowest median worker pay) and found CEO compensation grew by 15%.Given that stock-related components of CEO compensation comprise roughly three-fourths of total CEO compensation (see Table 1 of Mishel and Kandra 2020), this growth in CEO compensation might be expected given the rapid growth of stocks since the end of 2019 (see Figure A, showing 16.3% growth of S&P 500 from December 2019 to December 2020). The growth of CEO compensation was very uneven across firms, as we show below.
Bank profits strengthen, but lending remains sluggish – Profits soared and allowances for loan-losses fell at U.S. banks in the first quarter even as net interest margins continued to shrink. The banking industry produced net income of $76.8 billion in the quarter, up 29% from the fourth quarter and 315% from a year earlier, according to the Federal Deposit Insurance Corp.’s latest Quarterly Banking Profile. The recent gains were driven by declines in the reserves built up by banks in the earlier months of the pandemic. For the first time, the industry recorded negative provisions for credit losses of $14.5 billion. FDIC Chairman Jelena McWilliams said the banking sector is strong, though challenges remain on the horizon. “The banking industry reported strong earnings in first quarter 2021 as the economic recovery continued,” McWilliams said. “At the same time, the persistent low-interest-rate environment and a decline in loan volume caused further contraction in the average net interest margin, which reached a new record low.” Banks’ combined net interest income fell 5.6% to $129.7 billion in the first quarter of 2021. However, the FDIC reported that nearly 65% of banks reported higher net interest income compared with the first quarter of 2020. Overall, the industry’s net interest margin declined 57 basis points year over year to 2.56%, which was “the lowest level on record in the Quarterly Banking Profile,” the agency wrote. The previous record was 2.68% in the third quarter of 2020. Total loan and lease balances fell on an annual basis for the first time since the third quarter of 2011, according to the FDIC. They dropped 1.2% year over year to $10.82 trillion as of March 31 this year. The decline was thanks largely to a 12.8% drop in credit card balances and a 3.7% drop in commercial and industrial lending. “This was the largest percentage reduction in credit card commitments since first quarter 2009,” according to the QBP. Meanwhile, deposit growth stayed brisk. Deposits swelled by $635 billion, or 3.6%, between the fourth quarter of 2020 and the first of 2021, bringing the sector’s total to $18.5 trillion.In the same period, the Deposit Insurance Fund balance grew by $1.5 billion to $119.4 billion. Still, the sector’s deposit growth pushed the reserve ratio down four basis points to 1.25%, placing it 10 basis points below the statutory minimum of 1.35%
Small banks count on PPP tech advances to speed traditional lending — When HV Bancorp in Doylestown, Pennsylvania, first went live with the Paycheck Protection Program last April, “we just had bodies in front of keyboards using the Small Business Administration’s E-Tran system and entering applications,” said Hugh Connelly, chief lending officer in the business banking division of Huntingdon Valley Bank. The $595.7 million-asset community bank built a portal with the cloud technology company nCino to process applications faster for a second round of PPP funding last year, and chose Numerated, a digital lending and sales platform for business banking, to assist when Congress authorized another $284 billion in PPP funding in January. This story played out across the country: The urgency of the Paycheck Protection Program propelled community banks to find a speedier way to disburse loans to small businesses than relying on phone and email. Many turned to software to originate loans, automate the underwriting process, collect documents and transmit the information to the SBA’s processing system. With the relief program nearing its official end, community banks face a new question: Can they maintain the same efficiency and convenience by digitizing small-business lending activity. As lenders look for ways to persuade the “temporary” customers they hooked during PPP to stay, technology is one way community banks can ride the momentum of PPP – say, by creating self-service online portals or using customer data to make more proactive offers. “The pandemic in general and PPP in particular, especially for small banks, was a vast and successful proof-of-concept project for digitization,” said David O’Connell, senior analyst at the Aite Group. “In community banking, when you’re closing a loan, you’re probably closing it with a lady or gent you went to high school with, maybe on the hood of a Cadillac at a Friday night football game or Sunday after church. Those things are nice, but they don’t scale.” But the path forward is complicated. Many of the cultural barriers to automation have gone away, O’Connell pointed out, as banks learned that employees wouldn’t lose their jobs to technology. Still, “there is much more diversity in small and medium-size business lending than there was in PPP,” he said. While the terms of PPP loans were homogenous, regular small-business loans vary from term loans to revolver loans, some with a borrowing base or with real estate collateral and some without.
Can fintechs build on strong PPP lending to Black businesses? – Though fintech lenders joined the Paycheck Protection Program later than banks, they had an outsize impact in disbursing emergency loans to Black-owned businesses last year, according to an analysis by the Federal Reserve Bank of New York.Twenty-three percent of Black business owners that sought help from the PPP last year applied to fintechs, the New York Fed said. They weren’t far behind small banks, which captured 30% of the applicants from that segment.The big question going forward is can fintechs capitalize on the bonds they built with Black businesses as these online-only lenders try to expand their market share.”I expect to see the fintech lenders that participated in the PPP and are still around will focus on building deeper relationships with new customers that they acquired through the program,” said Alex Johnson, director of fintech research at Cornerstone Advisors. “I’d expect new customers that came in through the PPP to be a priority” for new product offerings like Square’s new business checking accounts.The figures were included in a series of blog posts Thursday from the New York Fed as part of its economic inequality research series. The posts examined the impact of the pandemic on small businesses and how fintechs stacked up next to banks of all sizes when lending to minority business owners.The research found that Black entrepreneurs were far likelier to seek help from fintechs (defined in the reports as nonbank lenders that operate online, such as Kabbage and Square) than small-business owners of other races and ethnicities.Fintechs received 10% of loan applications from Hispanics, 9% of those from Asians and 8% of those from whites.These findings point to the gaps Black business owners face in the banking system as a whole, and the opportunities fintechs have to fill their needs.”PPP highlighted, in stark terms, the larger problem that we’ve been dealing with for a long time – that Black Americans have less access to mainstream financial services,” Johnson said. “When the Paycheck Protection Program was introduced, banks and credit unions prioritized their relationships with existing customers. Fintech lenders prioritized growth, which meant a larger percentage of historically underserved customers.”
This Is What Jamie Dimon Will Tell the U.S. Senate Today (With Annotated Text) by Pam Martens -Below are selected remarks from Jamie Dimon’s prepared statement for the Senate Banking Committee hearing today, which will take testimony from a total of six Wall Street bank CEOs. Wall Street On Parade’s annotated remarks appear in brackets and italics. “I appreciate the invitation to appear before you to talk about JPMorgan Chase, the strength and resilience of the U.S. financial system, and the people, businesses and communities we serve.” [The strength of the U.S. financial system would, of course, be a lot safer and sounder if the largest bank in the U.S., at which Dimon serves as Chairman and CEO, had not been charged with five felony counts since 2014, all occurring under his leadership. The bank admitted to all five counts.]“JPMorgan Chase is a global financial services firm with assets of $3.4 trillion and operations worldwide. We are a leader in investment banking, financial services for consumers and small businesses, commercial banking, financial transaction processing, and asset management.”[As for exactly how JPMorgan Chase interacts with consumers, see its rap sheet. JPMorgan Chase also has the distinction of being the riskiest bank in the U.S.]“Banks play an essential role in a community, with the potential of bringing people together, enabling companies and individuals to reach their dreams, and being a source of strength in difficult times.”[Actually, rather than being a source of strength in difficult times, the mega banks on Wall Street required $29 trillion in bailouts from the Fed from 2007 to the middle of 2010 to keep the entire U.S. financial system from collapsing.]”We are living through extraordinary times, for which history will judge the leaders of government and industry by the actions we take to address the health crisis, support the people and businesses suffering from the devastating economic impacts of the pandemic, and address longstanding structural inequities and racial economic inequality.”[On March 11, 2020, the World Health Organization declared COVID-19 a pandemic. Jamie Dimon’s compensation to oversee the bank in 2020, which included admitting to two new felony counts on September 29, 2020, was set at $31.5 million by his Board of Directors. One of those 2020 felony counts related to rigging the U.S. Treasury market, the market that makes it possible for the U.S. government to pay its bills and help struggling Americans during a national health crisis.]“We were proud to have participated in various Federal Reserve emergency programs, such as the Paycheck Protection Program, Primary Dealer Credit Facility, Commercial Paper Funding Facility, Money Market Mutual Fund Liquidity Facility and the Secondary Market Corporate Credit Facility, among others.”[The Paycheck Protection Program was created to help main street businesses. The Primary Dealer Credit Facility, the Commercial Paper Funding Facility, and the Money Market Mutual Fund Liquidity Facility were created to bail out the Wall Street banks. The American people still have not received a report on just which Wall Street banks received bailouts under those three programs. In addition, the Fed pumped more than $6 trillion into Wall Street banks in repo loans from September 17, 2019 to January, 2020 – before any pandemic had been declared. The public has yet to see a breakdown of which banks got that bailout money.]
Bank CEOs grilled by Senate on pandemic response, ‘woke capitalism’ – – The CEOs of the six largest banks faced a grilling in the Senate on Wednesday, taking heat from Democrats over how they responded to businesses and consumers hurt by the pandemic, and from Republicans over their stances on hot-button issues like climate change and voting rights. Appearing before the Senate Banking Committee, the six CEOs – Jane Fraser of Citigroup, Brian Moynihan of Bank of America, Charlie Scharf of Wells Fargo, Jamie Dimon of JPMorgan Chase, David Solomon of Goldman Sachs and James Gorman of Morgan Stanley – touted their efforts to address the economic impact of COVID-19 through the Paycheck Protection Program and loan payment flexibility. They also attempted to publicize their work to try to narrow the racial wealth gap through investments in minority communities. “You’ve heard from all the CEOs here that we’re making an enormous effort to try to get credit to marginalized, lower- and middle-income, majority-minorities, Black small businesses, women of color, etc.,” Dimon said. “We’re doing a good job. We could always do more. We acknowledge there’s some problems that need to be fixed. We’re all trying to do it the right way.” But the CEOs’ comments on efforts to help the economy weather the pandemic fell on deaf ears with some Democrats, who said small-business lending and relief efforts for struggling consumers were insufficient. And they were criticized by Republicans over the efforts of some banks to scale back lending to fossil fuel companies, and for public statements on political debates that lawmakers said were outside the scope of banking. Here are three takeaways from the CEOs’ Senate visit:
- Democrats are not impressed by the banks’ pandemic relief efforts. While the CEOs touted their PPP lending, forbearance offered to consumers and fee waivers arising from the coronavirus pandemic, Democrats on the committee said they weren’t satisfied with banks’ work to help struggling families and consumers.Sen. Elizabeth Warren, D-Mass., took JPMorgan Chase to task for collecting overdraft fees despite guidance from federal regulators last year encouraging banks to waive certain fees for consumers affected by the pandemic. “Your bank, JPMorgan, collects more than seven times as much money in overdraft fees per account than your competitors. … Nearly $1.5 billion that you collected from your customers,” Warren said to Dimon. “You and your colleagues come in today to talk about how you stepped up and took care of customers during the pandemic and it’s a bunch of baloney.”
- Republicans are concerned about ‘woke capitalism’ in the financial sector. Republicans sounded the alarm about potential political motivations behind the financial industry’s decisions to weigh in on issues like voting rights and climate change.”‘Woke capitalism’ seems to be running amok throughout the financial institutions of our country,” said Sen. Tim Scott, R-S.C. Sen. Pat Toomey, R-Pa., the committee’s ranking member, said he was worried that banks face pressure “to embrace ‘wokeism’ and appease the far left’s attacks on capitalism.”
- The bankers tried to tout investments in minority communities and diversity efforts.Several CEOs used their opening remarks at the hearing to discuss their recent investments in community development financial institutions and minority depository institutions during the pandemic.”Recognizing that the goal of the PPP was to provide a lifeline to struggling small businesses, we also took the more than $400 million in fees generated by the program in 2020 and are donating them to our ‘Open for Business Fund,’ which is allowing us to engage CFDI’s, not-for-profits and others,” Scharf said.While Goldman Sachs was not a PPP lender, Solomon said that the bank committed funds to CDFIs and MDIs to help mitigate the impact of the pandemic..
Despite federal moratorium, eviction rates returning to pre-pandemic levels –Before the COVID-19 pandemic, Idaho, like many states across the country, faced rising housing costs, low home-vacancy rates and increasing efforts by landlords to evict tenants.Thanks to increased unemployment benefits, federal stimulus checks and eviction moratoriums – all part of the government’s pandemic response – renters’ lives improved slightly in 2020. But with those programs decreasing or disappearing, many Idahoans and other Americans who rent their homes will still struggle to pay rent and face imminent risk of being evicted.Our analysis of eviction rates across the state of Idaho finds that numbers were down in 2020 but are poised to return to – or even exceed – pre-pandemic levels in the coming months as economic support for renting families runs out.In 2016, 2,037 or 1.1% of all renting households in Idaho faced an eviction filing – when a landlord formally requests an eviction order from a court. The courts ordered evictions for 1,107 households, or 0.6% of the state’s renting households that year.Eviction filings that do not end in an ordered eviction may be a result of renters reaching a settlement with the landlord before eviction. Even when dismissed or settled, filings affect a tenant’s record, potentially making it challenging to find new housing for years into the future.By 2019, eviction filings increased to affect 2,673 households, 1.4% of the state’s renting households, with 1,611, or 0.8%, ultimately facing a court-ordered eviction. Between 2016 and 2019, housing prices in Idaho increased by 34.7%, while the median income increased by only 17.7%. When housing costs outpace income, affordable housing stock decreases with a likely increase in evictions.In 2020, however, eviction numbers dropped – 1% of Idaho’s renting households, 1,893 families, had an eviction filing and 1,127, or 0.6%, were formally evicted.Unlike other states, Idaho did not have a statewide eviction ban, but there are potential reasons for these decreases.From March 25 through April 30, 2020, state courts were closed, except for essential hearings – which could have included evictions relating to illegal activity. Most other eviction proceedings would have been delayed. In addition, some landlords may have decided to seek resolutions other than eviction, especially as cash aid came in from federal and state governments. However, when the courts reopened in May 2020, eviction filings and formal evictions spiked. And monthly statistics show the rates rising almost back to 2019’s levels. This raises the question of the ability of federal bans alone to decrease eviction rates.
Freddie Mac: Mortgage Serious Delinquency Rate decreased in April – Freddie Mac reported that the Single-Family serious delinquency rate in April was 2.15%, down from 2.34% in March. Freddie’s rate is up year-over-year from 0.64% in April 2020.Freddie’s serious delinquency rate peaked in February 2010 at 4.20% following the housing bubble, and peaked at 3.17% in August 2020 during the pandemic.These are mortgage loans that are “three monthly payments or more past due or in foreclosure” 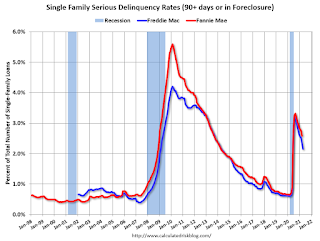 Mortgages in forbearance are being counted as delinquent in this monthly report, but they will not be reported to the credit bureaus.This is very different from the increase in delinquencies following the housing bubble. Lending standards have been fairly solid over the last decade, and most of these homeowners have equity in their homes – and they will be able to restructure their loans once (if) they are employed. Also – for multifamily – delinquencies were at 0.20%, up from 0.17% in March, and up more than double from 0.08% in April 2020.
Fannie Mae: Mortgage Serious Delinquency Rate Decreased in April –Fannie Mae reported that the Single-Family Serious Delinquency decreased to 2.38% in April, from 2.58% in March. The serious delinquency rate is up from 0.70% in April 2020. These are mortgage loans that are “three monthly payments or more past due or in foreclosure”.The Fannie Mae serious delinquency rate peaked in February 2010 at 5.59% following the housing bubble, and peaked at 3.32% in August 2020 during the pandemic. By vintage, for loans made in 2004 or earlier (2% of portfolio), 5.44% are seriously delinquent (down from 5.66% in March). For loans made in 2005 through 2008 (2% of portfolio), 9.33% are seriously delinquent(down from 9.65%), For recent loans, originated in 2009 through 2021 (96% of portfolio), 1.94% are seriously delinquent (down from 2.13%). So Fannie is still working through a few poor performing loans from the bubble years.Mortgages in forbearance are counted as delinquent in this monthly report, but they will not be reported to the credit bureaus.This is very different from the increase in delinquencies following the housing bubble. Lending standards have been fairly solid over the last decade, and most of these homeowners have equity in their homes – and they will be able to restructure their loans once they are employed.
MBA Survey: “Share of Mortgage Loans in Forbearance Decreases to 4.19%” -Note: This is as of May 16th. From the MBA: Share of Mortgage Loans in Forbearance Decreases to 4.19% The Mortgage Bankers Association’s (MBA) latest Forbearance and Call Volume Survey revealed that the total number of loans now in forbearance decreased by 3 basis points from 4.22% of servicers’ portfolio volume in the prior week to 4.19% as of May 16, 2021. According to MBA’s estimate, 2.1 million homeowners are in forbearance plans. The share of Fannie Mae and Freddie Mac loans in forbearance decreased 3 basis points to 2.21%. Ginnie Mae loans in forbearance decreased 2 basis points to 5.59%, while the forbearance share for portfolio loans and private-label securities (PLS) remained the same relative to the prior week at 8.26%. The percentage of loans in forbearance for independent mortgage bank (IMB) servicers decreased 4 basis points to 4.38%, and the percentage of loans in forbearance for depository servicers remained the same at 4.35%. “The share of loans in forbearance declined for the 12 th straight week, dropping by 3 basis points. The decline was smaller than the prior week due to a slower pace of forbearance exits,” said Mike Fratantoni, MBA’s Senior Vice President and Chief Economist. “Although the overall share is declining, there was another increase in forbearance re-entries. Currently, 5.3 percent of loans in forbearance are homeowners who had cancelled forbearance but needed assistance again.” , “The job market is recovering, but the pace of recovery thus far is slower than we had forecasted. Continued job growth is needed to help more struggling homeowners get back on their feet.”This graph shows the percent of portfolio in forbearanceby investor type over time. Most of the increase was in late March and early April, and has trended down since then. The MBA notes: “Total weekly forbearance requests as a percent of servicing portfolio volume (#) increased relative to the prior week: from 0.04% to 0.05%. “
FHFA House Price Index: Up 2.5% in March –The Federal Housing Finance Agency (FHFA) has released its U.S. House Price Index (HPI) for February. Here is the opening of the press release: – U.S. house prices rose 12.6 percent from the first quarter of 2020 to the first quarter of 2021 according to the Federal Housing Finance Agency House Price Index (FHFA HPI). House prices were up 3.5 percent compared to the fourth quarter of 2020. FHFA’s seasonally adjusted monthly index for March was up 1.4 percent from February.“House price growth over the prior year clocked in at more than twice the rate of growth observed in the first quarter of 2020, just before the effects of the pandemic were felt in housing markets,” said Dr. Lynn Fisher, Deputy Director of FHFA’s Division of Research and Statistics. “In March, rates of appreciation continued to climb, exceeding 15 percent over the year in the Pacific, Mountain and New England census divisions.”The chart below illustrates the monthly HPI series, which is not adjusted for inflation, along with a real (inflation-adjusted) series using the Consumer Price Index: All Items Less Shelter.
Case-Shiller: National House Price Index increased 13.2% year-over-year in March – S&P/Case-Shiller released the monthly Home Price Indices for March (“March” is a 3 month average of January, February and March prices).This release includes prices for 20 individual cities, two composite indices (for 10 cities and 20 cities) and the monthly National index. From S&P: S&P Corelogic Case-Shiller Index Shows Annual Home Price Gains Climbed to 13.2% in March: The S&P CoreLogic Case-Shiller U.S. National Home Price NSA Index, covering all nine U.S. census divisions, reported a 13.2% annual gain in March, up from 12.0% in the previous month. The 10-City Composite annual increase came in at 12.8%, up from 11.7% in the previous month. The 20-City Composite posted a 13.3% year-over-year gain, up from 12.0% in the previous month.Phoenix, San Diego, and Seattle reported the highest year-over-year gains among the 20 cities in March. Phoenix led the way with a 20.0% year-over-year price increase, followed by San Diego with a 19.1% increase and Seattle with a 18.3% increase. All 20 cities reported higher price increases in the year ending March 2021 versus the year ending February 2021. Before seasonal adjustment, the U.S. National Index posted a 2.0% month-over-month increase, while the 10-City and 20-City Composites both posted increases of 2.0% and 2.2% respectively in March.After seasonal adjustment, the U.S. National Index posted a month-over-month increase of 1.5%, and the 10-City and 20-City Composites both posted increases of 1.4% and 1.6% respectively. In March, all 20 cities reported increases before and after seasonal adjustments.. “The National Composite Index marked its tenth consecutive month of accelerating prices with a 13.2% gain from year-ago levels, up from 12.0% in February. This acceleration is also reflected in the 10- and 20-City Composites (up 12.8% and 13.3%, respectively). The market’s strength is broadly-based: all 20 cities rose, and all 20 gained more in the 12 months ended in March than they had gained in the 12 months ended in February. The National Composite’s 13.2% gain was last exceeded more than 15 years ago in December 2005, and lies very comfortably in the top decile of historical performance. The unusual strength is reflected across all 20 cities; March’s price gains in every city are above that city’s median level, and rank in the top quartile of all reports in 19 cities.“These data are consistent with the hypothesis that COVID has encouraged potential buyers to move from urban apartments to suburban homes. This demand may represent buyers who accelerated purchases that would have happened anyway over the next several years. Alternatively, there may have been a secular change in preferences, leading to a permanent shift in the demand curve for housing. More time and data will be required to analyze this questionThe first graph shows the nominal seasonally adjusted Composite 10, Composite 20 and National indices (the Composite 20 was started in January 2000).The Composite 10 index is up 1.4% in March (SA) from February.The Composite 20 index is up 1.6% (SA) in March.The National index is 33% above the bubble peak (SA), and up 1.5% (SA) in March. The National index is up 80% from the post-bubble low set in December 2011 (SA).
Home Prices Shattering Records Across U.S. Following Pandemic – Home prices are shattering records – especially in smaller cities. As a result, buyers can barely afford to blink or they risk losing the house they want. Jennifer Steinzer and Garrett Farber wanted their first house to have a backyard for a dog and no stairs. “We got a three story, no backyard and a cat,” Farber said. They got their home for $295,000 after being outbid on 10 other homes in Las Vegas. When asked why she was willing to make so many sacrifices, Steinzer said, “Just to get our foot into a house and have a roof over our head.” When asked if this was their dream home, Steinzer and Farber said: “No, not at all.” Desperate buyers, record-low interest rates, along with low inventory and cash-rich investors are driving prices up – nationally, 19% higher. But cities like Kingston, New York, are up 35%, Boise, Idaho, is up 33%, and Las Vegas is up 15%, according to the National Association of Realtors. One 1,300-square-foot, one bath home in Tiburon, California, went for more than $2 million – 58% above the asking price. tiburon-house-for-sale.jpg A house that sold recently for $2,057,000, 58% above list price, in Tiburon, California. ALAN DEP “If you’re putting in asking offers you’re automatically a loser,” Las Vegas realtor Mike McGrath said. One of McGrath’s clients paid $45,000 above the listed price for a home in Henderson, Nevada. “They barely got in the house,” McGrath said.
Zillow Case-Shiller House Price Forecast: “Not Slowing Any Time Soon”, 14.3% YoY in April –The Case-Shiller house price indexes for March were released today. Zillow forecasts Case-Shiller a month early, and I like to check the Zillow forecasts since they have been pretty close.From Matthew Speakman at Zillow: March 2021 Case-Shiller Results & Forecast: Not Slowing Any Time Soon: While signs are emerging that the consistent decline of for-sale inventory is beginning to slow and could be on the verge of reversing, the pressures that have pushed home prices upward at their fastest pace in years remain in place and prices continue to press higher….Following sharp monthly declines in January and February, March saw a more modest retreat in inventory, suggesting that the historically tight inventory pressures may finally be starting to ease. But that anticipated relief has not yet materialized and the competition for the relatively few homes on the market remains red hot. Nationally, nearly half of all homes that go under contract are doing so in less than a week and nearly a third of homes are selling for above their initial list price – more than twice the share from a year ago. What’s more, mortgage rates have held near all-time lows and the gradual re-opening of the economy has encouraged many would-be buyers to enter the mix. All told, there is little, if any, indication that home prices will slow their appreciation anytime soon.Monthly and annual growth in April as reported by Case-Shiller is expected to accelerate from March and April 2020 in all three main indices. S&P Dow Jones Indices is expected to release data for the April S&P CoreLogic Case-Shiller Indices on Tuesday, June 29.The Zillow forecast is for the year-over-year change for the Case-Shiller National index to be at 14.3% in April, up from 13.2% in March.The Zillow forecast is for the 20-City index to be up 14.3% YoY in April from 13.3% in March, and for the 10-City index to increase to be up 13.9% YoY compared to 12.8% YoY in March.
REALTORS Confidence Index Survey April 2021 – Some interesting information from the REALTORS Confidence Index Survey April 2021 Several metrics indicates a very strong buyer market with short supply. The REALTORS Buyer Traffic Index increased from 79 in March 2021 to 80 (very strong conditions) in April 2021while the REALTORS Seller Traffic Index remains below 50 which is “weak” traffic compared to the level one year ago. On average, a home sold had five offers. On average, REALTORS expect home prices in the next three months to increase nearly 6% from one year ago and sales in the next three months to increase nearly 3% from last year’s sales level.With little supply in the market, homes typically sold within 17 days (27 days one year ago), as buyer competition heats up. The share of first-time buyers decreased to 31% (32% in the prior month, 36% one year ago).This graph, from the NAR report, shows buyer traffic is strong just about everywhere.
NAR: Pending Home Sales Decreased 4.4% in April From the NAR: Pending Home Sales Drop 4.4% in April:Pending home sales took a step backward in April, according to the National Association of Realtors. All four U.S. regions recorded year-over-year increases, but only the Midwest witnessed month-over-month gains in terms of pending home sales contract transactions.The Pending Home Sales Index (PHSI), a forward-looking indicator of home sales based on contract signings, fell 4.4% to 106.2 in April. Year-over-year, signings jumped 51.7% as last year’s pandemic-related shutdowns slumped sales to an all-time low. An index of 100 is equal to the level of contract activity in 2001….The Northeast PHSI declined 12.9% to 85.3 in April, a 96.5% jump from a year ago. In the Midwest, the index increased 3.5% to 101.1 last month, up 39.4% from April 2020.Pending home sales transactions in the South fell 6.1% to an index of 128.9 in April, up 45.3% from April 2020. The index in the West decreased 2.6% in April to 92.0, up 57.3% from a year prior.This was well below expectations of a 1.2% increase for this index. Note: Contract signings usually lead sales by about 45 to 60 days, so this would usually be for closed sales in May and June.
New Home Sales Decrease to 863,000 Annual Rate in April –The Census Bureau reports New Home Sales in April were at a seasonally adjusted annual rate (SAAR) of 863 thousand. The previous three months were revised down sharply, combined. Sales of new singleâ€family houses in April 2021 were at a seasonally adjusted annual rate of 863,000, according to estimates released jointly today by the U.S. Census Bureau and the Department of Housing and Urban Development. This is 5.9 percent below the revised March rate of 917,000, but is 48.3 percent above the April 2020 estimate of 582,000.The first graph shows New Home Sales vs. recessions since 1963. The dashed line is the current sales rate. This was the highest sales rate for April since 2007.The second graph shows New Home Months of Supply. The months of supply increased in April to 4.4 months from 4.0 months in March.The all time record high was 12.1 months of supply in January 2009. The all time record low was 3.5 months, most recently in October 2020.This is close to the low end of the normal range (about 4 to 6 months supply is normal).”The seasonallyâ€adjusted estimate of new houses for sale at the end of April was 316,000. This represents a supply of 4.4 months at the current sales rate.” Starting in 1973 the Census Bureau broke inventory down into three categories: Not Started, Under Construction, and Completed.The third graph shows the three categories of inventory starting in 1973.The inventory of completed homes for sale is just above the record low, and the combined total of completed and under construction is a little lower than normal.The last graph shows sales NSA (monthly sales, not seasonally adjusted annual rate).In April 2021 (red column), 78 thousand new homes were sold (NSA). Last year, 52 thousand homes were sold in April.The all time high for April was 116 thousand in 2005, and the all time low for April was 30 thousand in 2011. This was well below expectations, and sales in the three previous months were revised down sharply, combined.
A few Comments on April New Home Sales – McBride – New home sales for April were reported at 863,000 on a seasonally adjusted annual rate basis (SAAR). Sales for the previous three months were revised down significantly, combined.This was well below consensus expectations for April, but still the highest sales rate for April since 2007. However, sales were in line with home builder about “limiting sales” in April and May mostly due to high material costs.Still, sales have been strong for the last 11 months. Clearly low mortgages rates, low existing home supply, and favorable demographics have boosted sales. A surging stock market has probably helped new home sales too. Earlier: New Home Sales Decrease to 863,000 Annual Rate in April. This graph shows new home sales for 2020 and 2021 by month (Seasonally Adjusted Annual Rate).The year-over-year comparisons are easy in the first half of 2021 – especially in March and April. However, sales will likely be down year-over-year in August through October – since the selling season was delayed in 2020.And on inventory: note that completed inventory (3rd graph in previous post) is near record lows, but inventory under construction is closer to normal. This graph shows the months of supply by stage of construction.The inventory of completed homes for sale was at 36 thousand in April, just above the record low of 34 thousand in March 2021. That is about 0.5 months of completed supply (just above record low). The inventory of new homes under construction, and not started, is at 3.9 months – close to normal.
New Home Prices —As part of the new home sales report released yesterday, the Census Bureau reported the number of homes sold by price and the average and median prices. From the Census Bureau: “The median sales price of new houses sold in April 2021 was $372,400. The average sales price was $435,400.”The following graph shows the median and average new home prices. During the housing bust, the builders had to build smaller and less expensive homes to compete with all the distressed sales. When housing started to recovery – with limited finished lots in recovering areas – builders moved to higher price points to maximize profits. Then the average and median house prices mostly moved sideways since 2017 due to home builders offering more lower priced homes. Prices picked up during the pandemic, and really picked up recently.The average price in April 2021 was $435,400, up 21% year-over-year. The median price was $372,400, up 20% year-over-year. The second graph shows the percent of new homes sold by price.Very few new homes sold were under $200K in April 2021 (about 2.6% of all homes). This is down from 56% in 2002. In general, the under $200K bracket is going away. The $400K and greater than $500K+ brackets increased significantly over the last decade. A majority of new homes (about 59% in April) in the U.S., are in the $200K to $400K range.
Lawler: Single-Family Rent Trends – Last week, I posted a brief note from housing economist Tom Lawler: Lawler: Is the “Owners’ Equivalent Rent” Index Set to Accelerate Sharply?. Here is some more information from Lawler: Two of the largest institutional holders of single-family rental properties recently reported that demand for single-family rentals has rebounded strongly over the past several quarters, and both reported an acceleration in rental increases. Invitation Homes owns about 80,330 single-family homes, while American Homes 4 Rent owns about 51,984 single-family homes. While apartment rents in many large cities fell sharply following the pandemic (though rents have rebounded somewhat recently), the single-family rental market held up much better, as did the apartment rental markets in less-densely-populated (and less expensive) cities. A recent report from CoreLogic also shows this to be the case. CoreLogic’s Single-Family Rent Index (SFRI), based on repeat-rent analysis of the same rental properties, increased by 4.3% YOY in March, compared to a recent YOY low of 1.4% in June. The SFRI for the “high-price” tier showed a 5.0% YOY gain in March, while the “low-price” tier showed just a 3.2% YOY increase. In terms of property type, the SFRI for SF detached properties increased by 6.9% YOY gain in March (a record high), while the SFRI for SF attached properties showed just a 1.3% YOY rise. Here is a chart from the report, which is available here: U.S. Single-Family Rents Up 4.3% Year Over Year in March. From CoreLogic: Rent prices for the low-end tier, increased 3.2% year over year in March 2021, down from 3.8% in March 2020. Meanwhile, higher-priced rentals increased 5% in March 2021, up from a gain of 2.8% in March 2020. This was the fastest increase in higher-price rents since August 2006.
Hotels: Occupancy Rate Down 15% Compared to Same Week in 2019 –Note: The year-over-year occupancy comparisons are easy, since occupancy declined sharply at the onset of the pandemic. However, occupancy is still down significantly from normal levels.The occupancy rate is down 15.1% compared to the same week in 2019.From CoStar: STR: Weekly US Hotel Occupancy Reaches 60%, a First Since Start of Pandemic: U.S. weekly hotel occupancy reached the 60% mark for the first time since the start of the pandemic, according to STR’s latest data through May 22. May 16-22, 2021 (percentage change from comparable week in 2019*):
Occupancy: 60.3% (-15.1%)
Average daily rate (ADR): US$115.57 (-13.6%)
Revenue per available room (RevPAR): US$69.69 (-26.6%)
ADR also reached its highest point of the pandemic but was still US$18 less than the corresponding week in 2019. RevPAR also hit a high point when compared to 2019.
The following graph shows the seasonal pattern for the hotel occupancy rate using the four week average.The red line is for 2021, black is 2020, blue is the median, dashed purple is 2019, and dashed light blue is for 2009 (the worst year on record for hotels prior to 2020). Occupancy is now above the horrible 2009 levels.
Las Vegas Visitor Authority for April: No Convention Attendance, Visitor Traffic Down 27% Compared to 2019 -From the Las Vegas Visitor Authority: April 2021 Las Vegas Visitor Statistics: Visitation continued to ramp up in April as the destination welcomed more than 2.5M visitors, up more than 15% MoM and down roughly â€27% vs. preâ€COVID levels in Apr 2019.Hotel occupancy increased to 65.6%, up 10.1 pts MoM, with Weekend occupancy improving to 83.5%, up 5.8 pts MoM and within 13 pts of Apr 2019 levels.The first graph shows visitor traffic for 2019 (blue), 2020 (orange) and 2021 (red).Visitor traffic was down 27.3% compared to the same month in 2019.Convention traffic was non-existent again in April, and was down 100% compared to April 2019. There has been no convention traffic since March 2020. I’ll add a graph of convention traffic once conventions start to reopen.Note: A convention is scheduled for early June (HT MS): “Informa Markets, organizers of the World of Concrete, has received approval from the Nevada Department of Business and Industry to move forward with its 2021 in-person edition. The event is scheduled to be held June 8-10, 2021 at the Las Vegas Convention Center.”
Consumer Confidence Held Steady in May The headline number of 117.2 was a decrease of 0.3 from the final reading of 117.5 for April. This was below theInvesting.com consensus of 119.2.“After rebounding sharply in recent months, U.S. consumer confidence was essentially unchanged in May,” said Lynn Franco, Senior Director of Economic Indicators at The Conference Board. “Consumers’ assessment of present-day conditions improved, suggesting economic growth remains robust in Q2. However, consumers’ short-term optimism retreated, prompted by expectations of decelerating growth and softening labor market conditions in the months ahead. Consumers were also less upbeat this month about their income prospects – a reflection, perhaps, of both rising inflation expectations and a waning of further government support until expanded Child Tax Credit payments begin reaching parents in July. Overall, consumers remain optimistic, and confidence should remain resilient in the short term, as vaccination rates climb, COVID-19 cases decline further, and the economy fully reopens.” Read more The chart below is another attempt to evaluate the historical context for this index as a coincident indicator of the economy. Toward this end, we have highlighted recessions and included GDP. The regression through the index data shows the long-term trend and highlights the extreme volatility of this indicator. Statisticians may assign little significance to a regression through this sort of data. But the slope resembles the regression trend for real GDP shown below, and it is a more revealing gauge of relative confidence than the 1985 level of 100 that the Conference Board cites as a point of reference.
Americans Boosted Spending, Adding Fuel to Economic Growth – WSJ — Americans continue to venture back out into public to buy services they went without for more than a year – a shift that is adding fuel to the economic recovery and stirring higher inflation.Consumer spending, the biggest source of economic demand in the U.S., rose 0.5% last monthafter surging in March, the Commerce Department said Friday.The report offered mostly positive signs about the direction of the economy’s path out of the pandemic-induced downturn. After months of buying goods from the safety of their homes, Americans are increasingly comfortable enough to go out in public and buy things in person, a shift that economists say is crucial to getting the economy running at full speed again. Spending on services, which account for the bulk of all consumer purchases, rose 1.1% last month; spending on goods fell 0.6%. The higher spending is being fueled by rising vaccination rates, falling business restrictionsand ample household savings, much of it from the federal government. States and cities continue to lift restrictions on businesses such as restaurants, gyms and concert venues, and customers are returning.”The U.S. consumer has an itch to spend, the means to do so and fewer health reasons not to indulge,” said Gregory Daco, chief U.S. economist for Oxford Economics. Americans are well-positioned to continue spending despite a drop in income last month. Household income fell 13.1% in April, the biggest drop on record, though the decline followed a surge the prior month due to the effects of stimulus payments that went out earlier this year. Income rose sharply in March as the government sent most households $1,400 checksas part of Covid-19 stimulus efforts.Despite the April drop, household income was 11% higher than in February 2020, the month before the pandemic hit the U.S. Households have saved about $2 trillion more than they would have absent the pandemic and federal relief efforts in response to it, according to Morgan Stanley.The report also contained a potential warning flag – higher inflation. Labor shortages, rising demand and disruptions in shipments are leading companies to raise prices. The Commerce Department’s inflation measure showed consumer prices rose 0.6% in April from a month earlier and 3.6% from a year earlier. Core prices, which exclude energy and food, rose 0.7% over the month and 3.1% over the year. The Federal Reserve, which aims for 2% annual inflation to keep the economy growing at a healthy pace, believes that the higher inflation is due largely to temporary factors, such as supply disruptions, and will eventually subside. The latest annual inflation figures are also skewed because of the severe recession caused by the onset of the pandemic in spring of 2020, which caused prices to drop sharply a year ago. After adjusting for annual inflation, both household spending and incomes fell in April.
Real Personal Income less Transfer Payments Above Previous Peak – Government transfer payments decreased sharply in April compared to March, but were still almost $1.4 trillion (on SAAR basis) above the February 2020 level (pre-pandemic). Most of the increase in transfer payments – compared to the levels prior to the crisis – is from unemployment insurance and “other” (includes direct payments). This table shows the amount of unemployment insurance and “Other” transfer payments since February 2020 (pre-crisis level). The increase in “Other” was mostly due to parts of the relief acts including direct payments. There was a large increase in “Other” in March due to the American Rescue Plan Act.Note: Not in the table below, but Social Security payments haven’t increased significantly since the pre-recession levels (from $1,065 billion SAAR in Jan 2020 to $1,108 billion SAAR in Apr 2021).A key measure of the health of the economy (Used by NBER in recession dating) is Real Personal Income less Transfer payments. This graph shows real personal income less transfer payments since 1990. This measure of economic activity increased 0.5% in April, compared to March, and was up 0.3% compared to February 2020 (previous peak). Another way to look at this data is as a percent of the previous peak. Real personal income less transfer payments was off 8.1% in April 2020. That was a larger decline than the worst of the great recession. Currently personal income less transfer payments are at a new peak. This is the first of the key NBER measures – GDP, Employment, Industrial Production, Real Personal Income less Transfer Payments – that is above pre-recession levels. GDP will be above pre-recession levels in Q2.
Memorial Day gas prices are the highest in seven years and could stay high all summer – Gasoline prices are expected to be the highest for a Memorial Day weekend in seven years, and prices could stay elevated all summer, as Americans take to the road in a post-coronavirus pandemic driving spree. The current average price for a gallon of unleaded gasoline of $3.04 per gallon, 16 cents more than a month ago and $1.08 per gallon higher than last year, according to AAA. The motor club federation expects 37 million Americans to travel this weekend, a 60% increase over last year when the economy was still shut down. Gas prices jumped earlier this month, particularly in the Southeast, after the Colonial Pipeline went off line for six days after a ransomware attack. In some Southern states, gasoline jumped more than 20 cents per gallon as panicked drivers filled their tanks and shortages shut down stations. Gasoline demand last week reached 9.5 million barrels a day, the highest since March 13, 2020, which was just when the economy began to shut down, according to the latest Energy Information Administration data. “There’s part of me that feels like the market has a potential to overheat this summer, just because people are stuck here,” said Patrick De Haan, head of petroleum analysis at GasBuddy. De Haan expects more driving vacations since international travel is still difficult. “Everyone wants to get out. If there’s any hiccup in the system this summer, it’s going to be hard to fuel up.” De Haan said more of a concern is that prices will jump this summer if there are any refinery outages or hurricanes disrupting the flow of crude or refined product. “Usually when prices go up 50 cents, people say they’ll just stay home, but not this year, with the pent-up demand. If there’s any kinks in the system, it could get ugly,” he said. AAA warned that some stations in the Southeast could continue to experience supply strains during the three-day Memorial Day holiday weekend, but drivers should still be able to fill up. Stations in popular travel areas, like beaches, mountains or national parks could face low supplies. De Haan said a GasBuddy survey showed that 53% of Americans said gas prices are irrelevant to them, and 57% expect to take at least one road trip, up from 31%. “I think it’s possible that we will have some blockbuster weekends that break records. It’s just because Americans have been stuck at home,” he said.
DOT: Vehicle Miles Driven Increased Sharply year-over-year in March -This will be something to watch as the economy recovers. The Department of Transportation (DOT) reported:m Travel on all roads and streets changed by 19.0% (42.0 billion vehicle miles) for March 2021 as compared with March 2020. Travel for the month is estimated to be 263.0 billion vehicle miles.The seasonally adjusted vehicle miles traveled for March 2021 is 261.1 billion miles, an 18.5% (40.7 billion vehicle miles) increase over March 2020. It also represents a 6.2% increase (15.2 billion vehicle miles) compared with February 2021.Cumulative Travel for 2021 changed by -2.1% (-14.9 billion vehicle miles). The cumulative estimate for the year is 691.5 billion vehicle miles of travel.This graph shows the monthly total vehicle miles driven, seasonally adjusted.Miles driven declined sharply in March 2020, and really collapsed in April. After partially recovering fairly quickly, miles driven was mostly flat for 6+ months – but really picked up in March 2021.
Headline Durable Goods Orders Down 1.3% in April After 11 Months of Increases – The Advance Report on Manufacturers’ Shipments, Inventories, and Orders released today gives us a first look at the latest durable goods numbers. Here is the Bureau’s summary on new orders:New orders for manufactured durable goods in April decreased $3.2 billion or 1.3 percent to $246.2 billion, the U.S. Census Bureau announced today. This decrease, down following eleven consecutive monthly increases, followed a 1.3 percent March increase. Excluding transportation, new orders increased 1.0 percent. Excluding defense, new orders were virtually unchanged. Transportation equipment, down two consecutive months, drove the decrease, $4.9 billion or 6.7 percent to $68.9 billion. Download full PDFThe latest new orders number at -1.3% month-over-month (MoM) was worse than the Investing.com 0.7% estimate. The series is up 52.1% year-over-year (YoY). If we exclude transportation, “core” durable goods was up 1.0% MoM, which was above the Investing.com consensus of 0.8%. The core measure is up 28.6% YoY.Core Capital Goods New Orders (nondefense capital goods used in the production of goods or services, excluding aircraft) is an important gauge of business spending, often referred to as Core Capex. It is up 2.3% MoM and up 25.3% YoY. For a look at the big picture and an understanding of the relative size of the major components, here is an area chart of Durable Goods New Orders minus Transportation and Defense with those two components stacked on top. We’ve also included a dotted line to show the relative size of Core Capex.
Richmond Fed Manufacturing: Strength in May – Fifth District manufacturing activity showed continued growth in May, according to the most recent survey from the Federal Reserve Bank of Richmond. The composite index rose to 18 from 17 in April and indicates expansion.The complete data series behind today’s Richmond Fed manufacturing report, which dates from November 1993, is available here.Here is a snapshot of the complete Richmond Fed Manufacturing Composite series. Here is an excerpt from the latest Richmond Fed manufacturing overview:Fifth District manufacturing activity strengthened in May, according to the most recent survey from the Richmond Fed. The composite index inched up from 17 in April to 18 in May, as all three component indexes – shipments, new orders, and employment – reflected growth. A majority of firms reported lengthening vendor lead times, as this index reached a record high, along with the backlog of orders index. Meanwhile, the index for raw materials inventories reached a record low. Overall, manufacturers reported improved business conditions. Link to Report Here is a somewhat closer look at the index since the turn of the century.
Kansas City Fed Survey: Continued Expansion in May – The latest index came in at 26, down 5 from last month’s 31, but still indicating expansion in May. The future outlook inched down to 33 this month from 34. Here is a snapshot of the complete Kansas City Fed Manufacturing Survey.Quarterly data for this indicator dates back to 1995, but monthly data is only available from 2001.Here is an excerpt from the latest report:Tenth District manufacturing activity continued to expand at a strong pace, and expectations for future activity remained solid (Chart 1, Tables 1 & 2). The index of prices paid for raw materials compared to a month ago posted a new survey record high for the second straight month, and prices received for finished goods also surpassed historical levels. Price indexes vs. a year ago also posted record highs, with 98% of firms reporting higher materials prices compared to a year ago. Moving forward, district firms expected materials prices and finished goods prices to continue to increase over the next six months. [Full report here] Here is a snapshot of the complete Kansas City Fed Manufacturing Survey.
Weekly Initial Unemployment Claims decrease to 406,000 —The DOL reported: In the week ending May 22, the advance figure for seasonally adjusted initial claims was 406,000, a decrease of 38,000 from the previous week’s unrevised level of 444,000. This is the lowest level for initial claims since March 14, 2020 when it was 256,000. The 4-week moving average was 458,750, a decrease of 46,000 from the previous week’s unrevised average of 504,750. This is the lowest level for this average since March 14, 2020 when it was 225,500. This does not include the 93,546 initial claims for Pandemic Unemployment Assistance (PUA) that was down from 95,142 the previous week.The following graph shows the 4-week moving average of weekly claims since 1971.The dashed line on the graph is the current 4-week average. The four-week average of weekly unemployment claims decreased to 458,750.The previous week was unrevised.Regular state continued claims decreased to 3,642,000 (SA) from 3,738,000 (SA) the previous week.Note: There are an additional 6,515,657 receiving Pandemic Unemployment Assistance (PUA) that decreased from 6,606,198 the previous week (there are questions about these numbers). This is a special program for business owners, self-employed, independent contractors or gig workers not receiving other unemployment insurance. And an additional 5,191,642 receiving Pandemic Emergency Unemployment Compensation (PEUC) up from 5,142,370. Weekly claims were lower than the consensus forecast..
There is no justification for cutting federal unemployment benefits: The latest state jobs data show the economy has not fully recovered –EPI Blog —Republican governors in 24 states – including Florida and Nebraska just this week – have indicated they will pull out from the federal unemployment insurance (UI) programs created at the start of the pandemic. Some states are ending participation in all federal pandemic UI programs, others only some of the federal supports. These actions are dangerously shortsighted.UI provides a lifeline to workers unable to find suitable jobs, giving them time to find work that matches their skills and pays a decent wage. Moreover, the money provided through these entirely federally fundedprograms bolsters consumer demand and business activity in local economies, helping to speed the recovery. In many states, these federal UI programs are providing the bulk of all unemployment benefits to jobless workers. By cutting off these programs – which currently provide an extra $300 in weekly benefits, allow workers who have exhausted traditional UI to continue receiving benefits, and expand eligibility to workers typically not included in existing UI programs – governors are weakening their states’ potential economic growth.Further, the most recent national jobs and unemployment data show that the country has not yet recovered from the COVID-19 recession. In April, the country was still down 8.2 million jobs from before the pandemic, and down between 9 and 11 million jobs since then if you factor in the jobs the economy should have added to keep up with growth in the working-age population over the past year.With an official unemployment rate of 6.1%, there are nearly 10 million people actively looking for work and unable to find it. These estimates understate the true level of weakness in the labor market as many people have exited the labor force since the COVID-19 shock began, but would likely rejoin if jobs were available, and others are still awaiting recall from “temporary” layoffs. The country is simply not at a place yet where states should be cutting off supports to unemployed workers.April state jobs and unemployment data released last Friday show that in many of the states that are cutting unemployment programs, labor market conditions are not much stronger than the national picture. Figure Ashows the states that have indicated they will be cutting support for jobless workers. In four of these states, the unemployment rate in April was higher than the national average: Arizona (6.7%), Alaska (6.7%), Texas (6.7%), and Mississippi (6.2%). In another four states, the official unemployment rate was still 5% or above: West Virginia (5.8%), Wyoming (5.4%), South Carolina (5.0%), and Tennessee (5.0%).However, these estimates likely understate the true weakness in these states’ labor markets. In seven of the eight states mentioned above, and in 20 of the 24 states cutting UI, labor force participation has fallen since before the pandemic – in some cases, dramatically. The labor force participation rate has fallen by an average of 1.1 percentage points among the states cutting UI, with declines as large as 3.8% in Iowa, 2.1% in Montana, 2.0% in Florida, 1.9% in Nebraska, and 1.8% in Texas. Some of these declines may be the result of jobless workers opting for early retirement, but it is likely that most have given up looking for work in the face of few suitable options, valid concerns about health risks, or a need to provide care to a child or family member.
Employers Can Require Covid-19 Vaccine Under Federal Law, New Guidance States – WSJ – U.S. employers could require all workers physically entering a workplace to be vaccinated against Covid-19, the federal government said Friday.The Equal Employment Opportunity Commission issued updated guidance stating that federal laws don’t prevent an employer from requiring workers to be vaccinated.However, in some circumstances, federal laws may require the employer to provide reasonable accommodations for employees who, because of a disability or a religious belief, aren’t vaccinated. For example, the EEOC said as a reasonable accommodation, an unvaccinated employee entering the workplace might wear a face mask, work at a social distance or be given the opportunity to telework.The new guidelines also say that federal laws don’t prevent or limit incentives that can be offered to workers to voluntarily take the vaccine. And employers that are administering vaccines to their employees may also offer incentives, as long as the incentives aren’t coercive.The updated guidance is intended to answer frequently asked questions, EEOC Chairwoman Charlotte Burrows said in a statement. She said the agency will continue to update and clarify its assistance for employers.The commission is an independent, bipartisan agency that enforces workplace civil-rights laws. The five-person body is led by Ms. Burrows, a Democrat whom President Biden elevated to the top position. It also includes three Republican members nominated by former President Donald Trump.Some employers have offered bonuses to workers who take the shot. For example, retailerDollar General Corp. is offering four hours of pay to those who take the shot, and Bolthouse Farms, a maker of juices and salad dressings, said it would pay $500 to full-time hourly workers who get Covid-19 vaccine. Retailer Trader Joe’s, delivery service Instacart Inc. and meat producers Pilgrim’s Pride Corp. and JBS USA Holdings Inc. said they would give vaccine incentives.
New York City Is Back: At Least 30 People Shot Over The Weekend – New York City is officially back: almost 30 people were shot in New York City this past weekend – and that number was only up until about 2PM on Sunday. 29 victims in total had been struck by gunfire by early evening Sunday, according to the New York Post, with one reported fatality. “These kids are having running gun battles and innocents are getting shot,” one veteran NYPD officer told the Post. “Nobody is interested in hearing how many shots are fired but if people knew how many shootings occurred where there are no victims – it’s by the grace of God.”Among those struck by gunfire over the weekend were a Manhattan federal prosecutor, Mollie Bracewell, who was dining outside in Brooklyn’s Prospect Heights, and Benjamin Bustamante, an innocent bystander walking nearby. The weekend hadn’t even ended before one officer said “there were just two more right now”, referring to additional shootings late Sunday. Shootings took place at Beach 30th Street and Seagirt Boulevard in Far Rockaway, Queens, among other locations throughout the city.Two people were shot in that area after a “gang dispute” spilled out of a nearby park, the report says. And if “diversity” in your violent crimes is a major concern, as we know it probably is for Mayor De Blasio, it should be noted that in addition to the shootings, there was a fatal stabbing in Northern Brooklyn and a man who was beaten to death in the Northeast Bronx over the weekend as well.
NYC Schools To Reopen Fully With No Remote Learning This Fall : NPR –New York City Mayor Bill de Blasio is promising a full reopening of the nation’s largest public school system in September. That means in person, five days a week, with no remote option for students to attend school exclusively online. The mayor made the announcement Monday on MSNBC’s Morning Joe. “You can’t have a full recovery without full-strength schools,” de Blasio said in the segment.Almost 70% of the nation’s students attend schools that are currently offering full-time, in-person learning, according to the organization Burbio. De Blasio’s announcement comes a week after New Jersey Gov. Phil Murphy announced there would be no remote option for that state’s public school students come September.But questions remain about how New York City will be able to accommodate 100% of its public school students in person. Some administrators worry there won’t be enough space to fit all students in classrooms under current social distancing requirements. At a City Council hearing last week, officials testified that all but 10% of the city’s public schools could fit their students into classrooms 3 or more feet apart. At a press conference Monday, the mayor said he believes schools could make 3-feet social distancing work, but that he expects the Centers for Disease Control and Prevention to relax the requirements more by August.Meanwhile, many New York City parents have expressed reluctance around in-person schooling. Data from the U.S. Education Department shows students of color are less likely than white students to be learning in person, as of March. Communities of color in the U.S. have beendisproportionately affected by the pandemic. In New York, Asian and Black families in particular have been more likely to keep their children home, according to demographic data released by the city. Parents there have cited virus safety concerns, a lack of trust in the school system and fear of discrimination in or on the way to school as reasons for keeping their children home. Some parents have said they won’t feel comfortable until their children are vaccinated, while others have said they prefer remote learning, because it works better for their children academically or socially. De Blasio said parents will be welcomed back to schools starting in June to ask questions and get answers from educators as well as to see how schools are keeping students and staff safe. And remote learning isn’t completely going away in New York City. Earlier this month,officials said public school students will learn remotely on Election Day, instead of having the usual day off from school, and class will no longer be suspended on “snow days.”
Vaccines’ success could undercut Biden’s multibillion-dollar school testing plans – President Joe Biden took office pledging to help curb the pandemic by supporting regular Covid-19 testing in schools and other group settings like homeless shelters and workplaces – but the future of those multibillion-dollar plans is murky amid dramatic drops in infection rates nationwide. The administration has struggled to launch a $650 million program it announced in February to set up regional Covid-19 testing hubs for schools and facilities like homeless shelters. Federal officials had hoped to have the first hub open and coordinating 150,000 tests per week by late April, but have not yet awarded any contracts. And while the White House announced in March that it would spend $10 billion in stimulus money to support testing programs in schools across the country, planning has been left largely to states, cities and local school districts. The CDC began distributing the money to state and local health departments in early April, but it is not clear how much schools have spent in the waning months of the 2020-2021 school year. Now, with vaccination slowing the virus’s spread, some schools are reopening without the kind of widespread Covid-19 screening that Biden once envisioned as crucial. Administration officials, many education leaders and some public health experts argue that testing will still be important for stemming outbreaks in schools into the next academic year, because Covid-19 shots are not yet available for kids under 12. But with new infections steadily dropping as the summer looms, a debate is brewing about what role widespread screening programs will play in a world where an increasing number of Americans are vaccinated. “Testing really is important for surveillance when you don’t have a majority of the people vaccinated,” the president’s chief medical adviser, Anthony Fauci, recently told POLITICO. “Once you get most people vaccinated, you’re not going to need to do that type of surveillance testing.”
CDC Recommends Masking for School Staff, Accepts Aerosol Transmission (Without Using the Word) — Lambert Strether — May 21’s “Mask Use and Ventilation Improvements to Reduce COVID-19 Incidence in Elementary Schools – Georgia, November 16 – December 11, 2020” really does seem to be different. This time. I apologize, but every time CDC drags its sluggish body toward the light, and not the darkness does the right thing, we should take notice and applaud. Readers will recall that the first CDC guidance on school re-opening, released on February 12 of this year, was appallingly bad. As I wrote back on February 18[1], when the guidance was released: You will notice immediately that aerosol transmission is omitted; the message ofStrategy is that aerosol transmission can be ignored because it is not an “essential” element. This message is getting through; from an acute summary of Strategy in WaPo, “The CDC’s plan to reopen schools seems to prioritize expediency over teachers’ health“: Again, the CDC’s “mitigation strategies” omit discussion of aerosols entirely (even to ventilation). Frankly, I was gobsmacked. I hate to deploy terms like “criminal malpractice,” so I won’t, but such was my level of gobsmacked-ness. Further, if you accept, as I do, the SARS-COV-2 can be transmitted by aerosols, the CDC Transmissiondocument – “the science” backing up the recommendations – rests on a very modest epidemiological base. Let’s consider first the CDC’s suppression of aerosol transmission. So that is my reading of Morbidity and Mortality Weekly Report’s new study on mask use and ventilation in schools. I’m pleased to see that CDC’s scientists are coming to their senses at long last following where the epidemiology leads. If in fact, which Heaven forfend, there is a Covid uptick when the schools re-open in the Fall, we will welcome having these particular “multiple prevention strategies” in place. I know I do harp on whether the word “aerosol” is used. However, it’s important that we use the right names for things. We need to name the theory of transmission – “aerosol transmision” – or else we’re robots simply following the rules, unable to adjust to new situations. (For example, “open the windows” is a rule, and a good one. It doesn’t tell you to think about what to do in new situations. Only a theory of transmission can do that.) More importantly – hold onto your hats, here, folks – elites never, ever, ever hold themselves accountable. See especially the Iraq War, where everybody who was wrong is still respected and in power, and everybody who was right was and is marginalized. If we say “aerosol transmission,” those who got it right are more likely to be rewarded and empowered, which is how science should work after a paradigm shift. So now, we wait to see the science translated into guidance.
What Do I Do Next?’: Orphaned by Covid, Two Teens Find Their Way – NYTimes — Their mother went into cardiac arrest just before midnight. She was resuscitated, but the doctor had a question: What did the family want to do if Magalie Salomon’s heart stopped beating again? The decision was left to Ms. Salomon’s son, Xavier. He was 18 years old. It was an alarming position to be in, particularly for Xavier, who had never felt much responsibility for the household. His father had died nine years earlier, and his mother worked overnight shifts as a home attendant, which meant he was often home alone with his 16-year-old sister, Adriana. Still, Xavier felt no obligation to take on a big brother role, preferring to dodge chores and duties. He gave little thought to blowing his Burger King paychecks on Yeezy sneakers or gifts for his girlfriend and tended to hole up in his room on his phone. But when the hospital called, it was Xavier who was asked for answers. He panicked. Do whatever it takes, he pleaded. A heaviness descended on the apartment in Bushwick, Brooklyn. Xavier lay on his bed in the dark, waiting for another call. When it came a couple hours later, there was the same news, the same question. Xavier repeated his plea. Yes, resuscitate. Save her. Finally, just before dawn, Xavier received word: Ms. Salomon, 44, died of Covid-19 about 6 a.m. on April 3, 2020, at Wyckoff Heights Medical Center. It had been less than three days since she left their home. This time, before Xavier hung up, he had his own question to ask: “What do I do next?” The nation has begun to emerge from the pandemic, but any real return to normalcy must include an acknowledgment of what has been lost. More than half a million have died of Covid-19 across the United States. Nearly 34,000 of those deaths were in New York City, an early epicenter where the virus tore through the crowded landscape.The collective numbers speak to the scope of the devastation, but each death was an event of its own, a fissure in some intimate world where only the bereft know just how much was broken. The stories are detailed and personal, a different ache to fill in every home.But woven within that grief are tales of hope and hardiness – of small but brilliant transformations as the city reopens.In the 14 months since their mother’s death, Xavier and Adriana Salomon have managed to reshape their lives, unearthing courage where there was sorrow. Two teenagers on their own, they have made unsteady but brave steps into the shadows of their parents.
Ontario’s Laurentian University declares insolvency, slashes hundreds of jobs, dozens of programs – Management at Laurentian University, which serves Northern Ontario as a postsecondary hub, filed for creditor protection in February and has spent the past three months imposing savage cuts on the institution’s faculty and staff. The use of insolvency proceedings for the first time at a Canadian postsecondary educational institution was greenlighted by Ontario’s hard-right Conservative government and broad sections of the ruling elite. They view it as setting a precedent for a broader assault on education workers and drive to reorganize the postsecondary sector to more fully meet the needs of big business.A quarter of the tenured faculty – about 110 professors – were unceremoniously laid off last month, with no prior notice during a Zoom call with school administration. Scores of contract positions have also been axed, above all, through Laurentian’s ending of the federated status of three smaller regional universities: the Huntington University, Thorneloe University and the University of Sudbury.The cuts are especially devastating in a region that has no other major postsecondary institution. Moreover, Laurentian was one of the few institutions in predominantly English-speaking Ontario that allowed students to study in French, an option that has now been severely curtailed with the elimination of key programs like French language and cultural studies.Fifty-eight undergraduate and 11 graduate programs were eliminated entirely, accounting for about a third of the northern university’s course offerings. Programs that were cut include undergraduate degrees in anthropology, environmental science, geography, Italian, mathematics, modern languages, music, philosophy, physics, political science and Spanish.It also appears likely that Laurentian’s Indigenous Studies program, one of the oldest in Canada, will cease to exist.
117 employees sue Houston Methodist hospital for requiring COVID-19 vaccine – Over 100 employees have joined a lawsuit against Houston Methodist hospital in Texas for requiring all employees to get the COVID-19 vaccine.The network, which oversees eight hospitals and has more than 26,000 employees, gave workers a deadline of June 7 to get the vaccine. If not, staffers risk suspension and termination, according to the lawsuit.As a result, 117 employees have joined a lawsuit filed Friday in Montgomery County that alleges the hospital is “illegally requiring its employees to be injected with an experimental vaccine as a condition of employment.”An American flag flies outside the Houston Methodist Hospital at the Texas Medical Center campus…Read MoreThe lawsuit cited that the U.S. Food and Drug Administration issued its first emergency use authorization for COVID-19 in December 2020, but thevaccines are awaiting full FDA approval and licensing, which will likelytake months for the agency to review additional data.The complaint cited that forcing employees to get the vaccine violates Nuremberg Code, a medical ethics code which bans forced medical experiments and mandates voluntary consent.Hospital CEO Dr. Marc Boom sent out a letter in April to staffers announcing that employees have to be vaccinated by June 7. “Please see the HR policy that outlines the consequences of not being compliant by June 7, which include suspension and eventually termination,” the letter, which was included in the lawsuit, stated.Attorney Jared Woodfill, who filed the lawsuit, told ABC News that Houston Methodist is forcing employees to get the shot to boost the hospital’s profits.
Global Chip Hub Taiwan Hammered By Triple Blow Of Drought, Blackouts And COVID Surge -The calm of a sunny May afternoon in Taiwan was broken by what the Nikkei describes as a crescendo of smartphones buzzing due to a national emergency alert: electricity blackouts were coming due to a malfunction at a power plant in the south of the island. People had no time to prepare. There were more than 30 reports of people being trapped in elevators half an hour after the warning in the capital city.”I was talking to my clients… but our building suddenly blacked out. The air conditioning as well as WiFi crashed completely, so I went home early,” a manager with the surname of Lin working in the Neihu Science Park in Taipei, where many top tech companies have offices, told Nikkei Asia. “Many traffic lights on my way home were out and my home was dark too.” More than four million households on the island, which has a population of 24 million, were affected by six rounds of rolling one-hour power suspensions on May 13 before power was fully restored around 8 pm. Taipower, the state-owned electricity operator, said human error at Hsinta Power Plant in the southern city of Kaohsiung caused a malfunction in the power grid, tripping four generators and cutting about 13 megawatts of electricity supply. This dragged Taiwan’s total power supply below a critical security level and triggered the outages. The nation’s phones buzzed again just four days later with another blackout warning. That evening, up to 659,000 households had their power cut. Taipower said that, with temperatures warmer than usual, there was a shortage of electricity supply because they had not anticipated demand for electricity to be so high.The two blackouts did not affect Taiwan’s crown jewel semiconductor industry. But they still put production continuity at risk because chipmakers like Taiwan Semiconductor Manufacturing Co. and United Microelectronics Corp said they experienced a sudden voltage dip, which could have a small impact on semiconductor production, industry sources said.After the two massive power outages, Taiwan endured another small-scale power suspension in Taipei City on Friday and experienced temporary power generator malfunctions at two separate coal-fired power plants on S unday and Monday respectively.Maintaining production is crucial at a time of global chip shortage, with political tensions and pandemic-induced lockdowns affecting supply chains and remote working increasing demand for electronic devices.
India reportedly orders social media platforms to remove references to “Indian variant” of COVID-19 – India’s government has sent notices to social media platforms ordering them to take down content that refers to an “Indian variant” of the COVID-19 virus, Reuters reported. The letter from the Ministry of Electronics and Information Technology sent Friday was not made public, but was viewed by several news outlets.It was not clear which social media outlets received the letter, but India’s government has recently ordered Twitter to remove tweets and Facebook and Instagram to take down poststhat were critical of its handling of the coronavirus pandemic.”There is no such variant of COVID-19 scientifically cited as such by the World Health Organisation (WHO). WHO has not associated the term ‘Indian Variant’ with the B.1.617 variant of the coronavirus in any of its reports,” the letter states, adding that the phrase is “completely FALSE.”A variant of the coronavirus first detected in India last year, B.1.617 is believed responsible for the latest wave of COVID-19 cases in south Asia. The World Health Organization has classified it as a variant of global concern, with some evidence that it is more contagious than other strains of the virus.But while India’s approach to censoring information about the coronavirus and variants is extreme, WHO and other health organizations and scientists are critical of the practice of referring to viruses and variants with geographic nicknames, since it can be stigmatizing and inaccurate. The WHO’s 2015 guidance for naming infectious diseases discourages using place names, human names, or animal species names.However, as National Geographic notes in its very good explainer about how virus variants get their names, the current naming conventions are cumbersome and confusing, making them difficult for non-scientists to grasp or remember. National Geographic reports that WHO is working with virologists to create a new way of naming viruses.
Sri Lankan government imposes censorship as experts warn of coronavirus surge – The Sri Lankan government on Monday announced “travel restrictions” for the next two weeks, until June 7, in response to surging coronavirus infections. It followed calls by medical experts for a “strict lockdown” of the island. President Gotabhaya Rajapakse, however, has warned state officials not to make any unauthorised media statements, claiming it could intensify popular concern about COVID-19. The official total number of coronavirus infections in Sri Lanka has climbed to over 167,170 with more than 1,240 deaths. In the last five days, the daily average of new infections spiked to over 3,300 with an increase of 65,000 cases, or a 70 percent rise, in the past month. State Minister of Health Sudarshini Fernandopulle has admitted that there were “about three times as many patients in society as reported.” Her statement was in response to repeated statements by medical experts that the real number of coronavirus infections and deaths was much higher than officially reported. The number of COVID-19 infections is also inaccurate because the government has directed health authorities to use the limited PCR (polymerase chain reaction) test. Last week, the Colombo office of the World Health Organization (WHO) held what it called a “brainstorming session” about Sri Lanka’s COVID-19 situation. More than a dozen epidemiologists and other medical experts participated, including Dr. Olivia Nieveras and Dr. Palitha Abeykoon from the WHO Colombo office, and Professors Malik Peiris, Nilika Malavige and Dr. Padma Gunaratne. These highly-qualified experts called on the government to introduce “strict restrictions on non-essential human mobility” with a two- or three-week lockdown in high transmission areas, and an expansion of medical facilities with intensive care units. “The decisions we take now will affect the lives of millions of Sri Lankans,” they warned. “The public sector health system is stretched to the limit, making it difficult to manage COVID-19 cases as well as other essential services. More health professionals and preventive staff (e.g., public health inspectors) are getting infected and HR [human resources] policies need to be geared to meet the urgency. There is a ‘tipping point’ beyond which the system can rapidly go out of control,” the experts stated. This tipping point, in fact, is rapidly being reached. According to reports, thousands of infected patients are being told to stay at home due to the lack of hospital beds. Health workers are increasingly unable to deal with the worsening situation.
Bolsonaro prepares electoral coup amid Brazilian Congress probe of COVID-19 response – Over the past two weeks, Brazil’s fascistic President Jair Bolsonaro has stepped up his preparations for an electoral coup, pressing Congress to pass a so-called “print ballot amendment” to the Brazilian Constitution. He has claimed that this is the only guarantee against what he describes as massive and recurrent electoral fraud preventing his reelection next year.Bolsonaro’s approval rating has sunk to an all-time low of 24 percent, and a plurality of 49 percent of Brazilians support his impeachment for the first time, with public attention drawn to the ongoing proceedings of a Senate commission of inquiry (CPI) into his murderous handling of the COVID-19 pandemic.With the help of his close ally, House Speaker Arthur Lira, Bolsonaro has succeeded in creating and stuffing with far-right loyalists a special panel to discuss, and bring to the center of the national debate, his longstanding and baseless allegations against the Brazilian electronic voting system, in place for almost 20 years. He claims it was rigged to stop him from winning the first round of the 2018 elections, in which he beat the Workers Party (PT) candidate Fernando Haddad in a run-off. The panel will analyze and vote on a constitutional amendment to attach to every electronic ballot a backup paper ballot. Bolsonaro alleges the current system doesn’t allow recounts and is prone to vote rigging, an accusation debunked by Army-promoted hacking competitions to find loopholes in the system, and by the very fact that the 2014 presidential elections saw a recount at the behest of runner-up Aecio Neves. Bolsonaro is following a carefully calculated strategy. After supporting until the eleventh hour Donald Trump’s claims that the 2020 US elections were stolen by the Democrats, Bolsonaro endorsed the January 6 putsch at the US Capitol, declaring Brazil would see “much worse” if his backup print ballot amendment was not adopted. In an undeniable indication of preparations for such an electoral coup in Brazil, Bolsonaro’s son Eduardo, a House member and former head of the Foreign Relations Committee, was present in Washington for a pre-coup meeting held at the Trump International Hotel on January 5.
UK government relaxes mask wearing in schools as it lifts safety restrictions amid spread of new Covid variant – UK Prime Minister Boris Johnson’s government, backed by the Labour opposition and trade unions, is proceeding recklessly with its roadmap for reopening the economy. This began almost fully on May 17 and aims to reopen completely on June 21. This takes place under conditions where infections from the more transmissible B.1.617.2 variant from India is growing exponentially and is expected to soon become the dominant strain. Among the safety restrictions being lifted, the government announced that teachers and pupils in secondary schools were no longer required to wear face coverings in classrooms. In primary schools, pupils were always exempt. Masks are only recommended in communal areas, excluding classrooms with poor ventilation housing up to 30 children or more. The government took this decision despite prior knowledge of the spread of the variant in schools, which it attempted to conceal. According to documents leaked to the Observer, a Public Health England (PHE) report May 13 omitted vital data linking 164 cases to schools. Mask wearing was the main, albeit limited, protection afforded to educators and pupils when schools reopened early March. The virus is now spreading in schools and communities in all parts of the UK. Universities returned to face-to-face teaching May 17, exacerbating transmission after tens of thousands travelled across the country from home to campus. The Wilsthorpe Academy School in Long Eaton, with 950 pupils, closed May 4 after confirming 100 Covid cases. Cases in the surrounding area of Erewash soared following the outbreak – the infection rate rose to 185.5 per 100,000 in seven days to May 6, indicating how quickly the disease can take hold. More than 150 cases were linked to the school. Seventeen cases were found in nearby schools. Bolton’s Assistant Director of Public Health, Lynn Donkin, said, ‘Initially we did see some cases linked to international travel, but we’ve now got a picture of widespread community transmission…’ Several schools in Bolton were forced to send classes home. Positive cases were confirmed at St Joseph’s RC High school and Lostock Primary School. Tonge Moor Primary Academy sent its Year One class home after finding a positive case. On Friday, each pupil at Bishop Bridgeman CE Primary School went home with a PCR test kit for all the family. Bolton has introduced voluntary surge testing and the use of facemasks will continue in the town and in nearby Bury schools.
.
include(“/home/aleta/public_html/files/ad_openx.htm”); ?>


