from the St Louis Fed
— this post authored by Charles S. Gascon, Regional Economist
Recent research by economist Stephan Whitaker at the Cleveland Fed found little evidence of an “urban exodus” during the pandemic. Populations of urban neighborhoods declined across the U.S. in 2020. However, this decline was primarily due to a drop in the flow of people moving into urban areas – not a mass urban exodus.

Whitaker found evidence of slower in-migration being the largest contributor to net outward urban migration, particularly in larger metropolitan areas. While these broad national trends are worthwhile to understand, dynamics of cities that have experienced out-migration for many decades, like St. Louis, can be very different than those of large coastal cities, like New York or San Francisco.
Understanding Migration Flows
Before getting into the details of the analysis, it is important to understand some key terms:
- Metropolitan statistical areas (MSAs) are regions that are geographically defined as groups of counties that are composed of cities and the surrounding suburbs that have a high degree of economic and social integration.
- Urban areas of MSAs are census tracts (think neighborhoods) that have a population density over 7,000 people per square mile or have the majority of housing stock built before World War II and a population density over 2,000 people per square mile.
- Outflow measures the number of people moving from the region’s urban area to another location.
- Inflow measures the number of people moving from another location into the region’s urban area.
- Net flow equals the difference between outflows and inflows.
Portions of the following analysis focus on the change in flow, which is defined as the difference between the average monthly flow from April to September 2020 and the average monthly flow for those same months in 2017, 2018 and 2019. In other words, changes in flows reflect an acceleration or deceleration of pre-pandemic migration trends.
Urban Migration in the Eighth District
Whitaker’s research provides detailed data on MSAs across the nation with populations over 500,000 people. This includes the Little Rock, Ark.; Louisville, Ky.; Memphis, Tenn.; and St. Louis MSAs in the Eighth Federal Reserve District.1 The table below reports changes in net flow (net migration) from urban areas in these MSAs during the pandemic. To easily compare trends across metro areas of different sizes, the values are migrants per 100,000 residents. On average, these four MSAs experienced an increase in net migration out of urban areas by about 12 per 100,000 residents, with the drop in urban inflow of 12 per 100,000 residents being the primary contributor.
| Metro Area | Change in the Net Flow (Change in Outflow Minus Change in Inflow) | Change in Outflow | Change in Inflow |
|---|---|---|---|
| Average U.S. MSA | 24 | 5 | -20 |
| Little Rock | 8 | -2 | -10 |
| Louisville | 21 | 1 | -21 |
| Memphis | 7 | -4 | -11 |
| St. Louis | 10 | 4 | -7 |
| NOTES: Values are migrants per 100,000 residents. The change is the difference between the average monthly flow from April to September 2020 and the average monthly flow for comparable months in 2017, 2018 and 2019. A positive number reflects an acceleration of pre-pandemic migration trends and a negative number reflects a deceleration of these trends. The U.S. average is calculated across the 96 metro areas in the sample, not weighted by population. Figures may not add up because of rounding. | |||
| SOURCE: Whitaker, Stephan. “Did the COVID-19 Pandemic Cause an Urban Exodus? Fourth Quarter 2020 Update for Tables and Figures.” Federal Reserve Bank of Cleveland District Data Brief, March 1, 2021. | |||
Among the District’s four largest MSAs, narratives emerge:
- The Little Rock and Memphis MSAs experienced a relatively modest increase in the net flow of migrants per 100,000 residents moving out of urban areas. Similar to national trends, these urban areas experienced a decline in in-migration (e.g., suggesting that more people remained in the suburbs). However, the urban areas of both regions also experienced declines in outflows (e.g., suggesting that more people remained there).
- The Louisville MSA experienced trends very similar to the average U.S. MSA, with a slight increase in outflows from urban areas, but a steep decline in inflows (e.g., suggesting that more people remained in the suburbs).
- The St. Louis MSA experienced a relatively more modest increase in the net flow out of urban areas. Overall, this trend in St. Louis is consistent with the average MSA, although both flows changed at more modest magnitudes.
Continued Trends or a Pandemic Shock?
It is worthwhile to dive deeper into medium-term trends to fully understand whether the data outlined above more likely reflect an acceleration of pre-pandemic trends or something new. Contrary to numerous headlines of urban revivals after the 2007-09 recession, national trends indicate a slow and steady increase in net migration out of urban areas since 2012, with outflows consistently remaining higher than inflows.2 However, these headlines of urban revival are understandable. Urban in-migration did accelerate after 2014; it is just that out-migration accelerated as well and at a faster rate.3
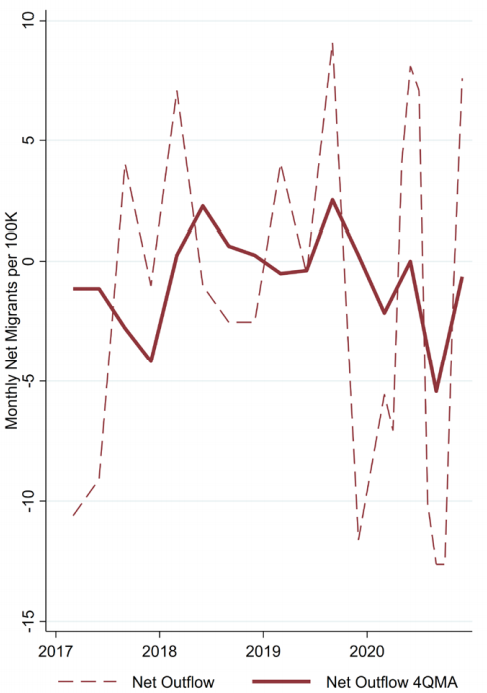
However, the District’s largest MSAs have not followed the pre-pandemic national trends. District MSAs reported a general slowing of net migration out of urban areas since 2017. The most interesting case is Memphis, which is depicted in the next two figures. The figure below shows quarterly net migration out of urban areas. Note that the series moves around zero, with periods below zero in the most recent years indicating net in-migration into urban areas.
Net Migration out of Urban Areas in the Memphis MSA
NOTE: Similar figures for other District MSAs are available.
SOURCE: Whitaker, Stephan. “Did the COVID-19 Pandemic Cause an Urban Exodus? Fourth Quarter 2020 Update for Tables and Figures.” Federal Reserve Bank of Cleveland District Data Brief, March 1, 2021.
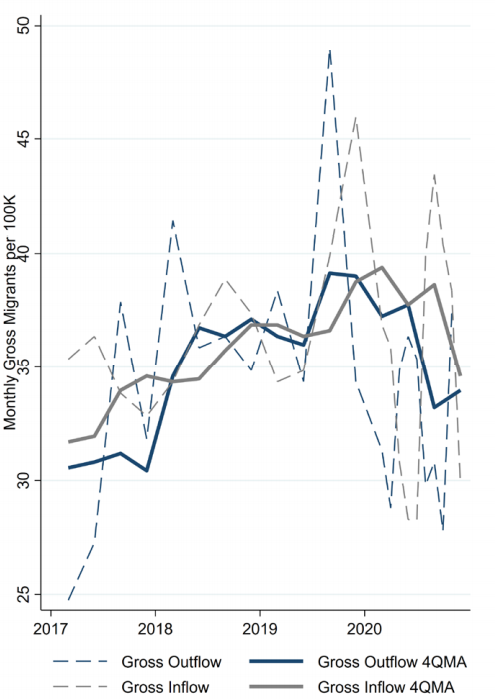
The next figure depicts the inflows and outflows for urban areas in Memphis. Both series trend upward over time, indicating a higher degree of resident mobility. Earlier in the pandemic, the gray line continued to trend slightly upward, indicating the continued movement of population into Memphis’ urban areas, before it turned downward. Conversely, the blue line moved immediately downward, indicating a slowing of urban residents moving out of the urban areas in the Memphis MSA.
Flows into and out of Urban Areas in the Memphis MSA
NOTE: Similar figures for other District MSAs are available.
SOURCE: Whitaker, Stephan. “Did the COVID-19 Pandemic Cause an Urban Exodus? Fourth Quarter 2020 Update for Tables and Figures.” Federal Reserve Bank of Cleveland District Data Brief, March 1, 2021.
Outlook for Urban Areas of MSAs
Nationally, there has been a sharp increase in net out-migration from urban areas during the pandemic. However, the data do not support a story of residents fleeing densely populated urban areas in search of more space in the suburbs, but rather a slowdown of people moving into urban areas. Moreover, each MSA has a unique experience.
This presents a host of new questions for researchers and policymakers in understanding the implications for urban growth and development. First and foremost, the pandemic kept many people from moving, regardless of their location choice. When these people will be willing or financially able to move again remains unclear.
Second, sharply declining housing inventories and rising housing prices, particularly in suburban areas, may have kept more people in urban areas even if they had a desire to get more space. Conversely, those looking to move into urban areas to enjoy urban amenities may have postponed these decisions because of the pandemic.
Third, surveys of firms and employees suggest work-from-home arrangements will continue for many workers after the pandemic. Recent research suggests that firms employing remote workers would move to the core of cities, while workers could move to more affordable neighborhoods in the periphery. While these broad trends suggest continued suburbanization in the aggregate, this may be driven primarily by large coastal cities with high-cost urban centers. Memphis’ experience, along with many other MSAs, suggests regional factors also play a significant role in urban migration patterns.
Notes and References
- Headquartered in St. Louis, the Eighth District includes all of Arkansas and parts of Illinois, Indiana, Kentucky, Mississippi, Missouri and Tennessee.
- See Figure 1 in Whitaker’s article.
- See Figure 2 in Whitaker’s article.
Additional Resources
- Regional Economist: The Impact of COVID-19 on the Residential Real Estate Market
- On the Economy: COVID-19, School Closings and Labor Market Impacts
- On the Economy: COVID-19 across Counties with Different Pre-Pandemic Financial Distress
Source
https://www.stlouisfed.org/on-the-economy/2021/april/pandemic-urban-exodus-eighth-district
Disclaimer
Views expressed are not necessarily those of the Federal Reserve Bank of St. Louis or of the Federal Reserve System.


