
Written by rjs, MarketWatch 666
News posted last week about economic effects related to the coronavirus 2019-nCoV (aka SARS-CoV-2), which produces COVID-19 disease, has been surveyed and some articles are summarized here. We cover the latest economic data, especially the new coronavirus relief bill and stimulus checks, government funding, the latest employment data, housing market reports, mortgage delinquencies & forbearance, layoffs, lockdowns, and schools, as well as GDP. The bulk of the news is from the U.S., with a few more articles from overseas at the end. (Picture below is morning rush hour in downtown Chicago, 20 March 2020.) News items about epidemiology and other medical news for the virus are reported in a companion article.

Please share this article – Go to very top of page, right hand side, for social media buttons.
There is a lot of news this week:
Jerome Powell Sees Easy-Money Policies Staying in Place – WSJ – Federal Reserve Chairman Jerome Powell reaffirmed the central bank’s commitment to maintaining easy-money policies until the economy has recovered further from the effects of the coronavirus pandemic. “The economy is a long way from our employment and inflation goals,” Mr. Powell said in testimony to the Senate Banking Committee, a statement he has repeated in recent weeks. The Fed will therefore continue to support the economy with near-zero interest rates and large-scale asset purchases until “substantial further progress has been made,” a standard that Mr. Powell said “is likely to take some time” to achieve. Mr. Powell delivered the Fed’s semiannual monetary-policy report to members of the committee Tuesday and is set to do the same Wednesday at a hearing of the House Financial Services Committee. The hearings come as steady progress on vaccinations and multiple rounds of fiscal stimulus have brightened the economic outlook, the Fed chief noted. His remarks suggested, however, that improvement won’t prod the Fed to tighten monetary policy anytime soon. “While the news has been positive on that front when you look at the drop in virus cases and you look at some of the recent economic data, the Fed is certainly not ready to pivot on its policy stance.” Daily coronavirus cases have fallen from their early January peak, and recent economic data including retail sales, industrial production, hiring and service-sector activity have indicated economic growth picked up in the new year after slowing in late 2020.Consumer confidence in the U.S. rose in February for the second consecutive month as Americans grew more upbeat about current business and labor market conditions, the Conference Board reported Tuesday. Still, nearly a year after the crisis erupted in the U.S., the nation has about 10 million fewer payroll jobs than in February 2020.Inflation also remains below the Fed’s 2% goal, a long-running worry among policy makers.Rising U.S. Treasury yields in recent weeks suggest some market participants may have the opposite concern: that prices could start to rise faster than the Fed expects.Mr. Powell said Tuesday that inflation could be somewhat volatile over the next year and might rise due to a potential burst of spending as the economy strengthens. But that, he said, would be a “good problem to have” in a world where economic and demographic forces have been pulling inflation down for a quarter of a century.He said he wouldn’t expect inflation to reach “troubling levels,” and wouldn’t expect any increase in inflation to be large or persistent.”Inflation dynamics do change over time but they don’t change on a dime, and so we don’t really see how a burst of fiscal support or spending that doesn’t last for many years would actually change those inflation dynamics,” he said.
Fed Chair Powell: Semiannual Monetary Policy Report to the Congress – From Fed Chair Jerome Powell: Monetary Policy Report – February 2021. A few excerpts:The initial wave of COVID-19 infections led to a historic contraction in economic activity as a result of both mandatory restrictions and voluntary changes in behavior by households and businesses. The level of gross domestic product (GDP) fell a cumulative 10 percent over the first half of 2020, and the measured unemployment rate spiked to a post – World War II high of 14.8 percent in April. As mandatory restrictions were subsequently relaxed and households and firms adapted to pandemic conditions, many sectors of the economy recovered rapidly and unemployment fell back. Momentum slowed substantially in the late fall and early winter, however, as spending on many services contracted again amid a worsening of the pandemic. All told, GDP is currently estimated to have declined 2.5 percent over the four quarters of last year and payroll employment in January was almost 10 million jobs below pre-pandemic levels, while the unemployment rate remained elevated at 6.3 percent and the labor force participation rate was severely depressed. Job losses have been most severe and unemployment remains particularly elevated among Hispanics, African Americans, and other minority groups as well as those who hold lower-wage jobs.And on high frequency indicators: Outside of the labor market, several new high-frequency indicators have been useful in monitoring the massive effects of the COVID-19 pandemic on consumer spending. Weekly data from NPD (a market analytics firm) on nonfood retail sales captured in real time the dramatic and sudden drop in consumption in mid-March; the monthly Census Bureau data recorded that decline only with a lag (figure B, left panel).3 The NPD data also reflected how the income support payments to families, provided by the Coronavirus Aid, Relief, and Economic Security Act, or CARES Act, rapidly affected consumer spending in mid-April. More recently, the NPD data showed some decline in consumption late last year, followed by a pickup in January after the passage of the most recent fiscal stimulus package. Several nontraditional data sources illustrate that services spending remains depressed as social distancing continues to restrain in-person activity
Within a Matter of Months, the Fed’s Balance Sheet Will Hit $8 Trillion; These Charts Tell the Rest of the Story — Pam Martens – Every Thursday, at approximately 4:30 p.m., the Federal Reserve provides a report on its balance sheet as of the prior day. It’s known as the H.4.1 report or the Wednesday Level report.On Thursday, September 4, 2008, the Fed’s H.4.1 report showed a $935 billion balance sheet as of Wednesday, September 3, 2008. That was 12 days before iconic financial institutions on Wall Street began to blow up in what became the worst financial crisis since the Great Depression. As of last Wednesday, February 17, 2021, the Fed’s balance sheet stood at $7.6 trillion – an increase of 712.83 percent in less than 13 years. The Federal Reserve was created in 1913 and such a staggering growth in its balance sheet has not occurred at any other period in U.S. history – not during the Great Depression, not even during or after World War II.What has changed the course of economic history in the United States and put the country on a debt-fueled disaster course is the Wall Street crash of 2008 and the bailouts, both monetary and fiscal, that have followed ever since, together with the unwillingness of Congress to confront this reality.The charts above showing the unprecedented growth in the federal debt and federal debt versus GDP since the Wall Street crash of 2008 confirm this thesis.Among the many factors that have kept the U.S. locked on this destructive debt path are the following:The failure by Congress to separate the giant federally-insured banks from the Wall Street casino, that is, to restore the Glass-Steagall Act, thus making perpetual Wall Street bailouts unnecessary;The failure by Congress to strip federally-insured banks of the ability to hold tens of trillions of dollars notionally in dangerous derivatives, thus making perpetual bailouts unnecessary;The fear by the Fed of allowing another stock market crash because consumers might retrench from spending if their 401(k)s implode;The failure by Congress to restore corporate pension plans to workers, thus allowing loyal, productive U.S. workers to live in dignity in their retirement years and de-linking the wealth effect from the stock market and 401(k) plans;The failure by Congress to conduct meaningful forensic investigations into how Wall Street’s Dark Pools, High Frequency Traders, and mega banks have joined forces to become a fraud monetization system and institutionalized wealth transfer mechanism, creating the worst wealth and income inequality in U.S. history.Time is running out for Congress to act.
Powell delivers reassurances to Wall Street – Federal Reserve chairman Jerome Powell has reassured Wall Street that the central bank will continue pouring money into the financial system and keep interest rates at ultra-low levels well into the future, amid growing concerns the financial bubble that has seen the stock market reach record highs could come to a sudden end. Powell’s soothing words for the financial markets were the central thrust of his semi-annual report to Congress that he outlined to the Senate banking committee yesterday. He began by noting that the rebound in economic activity taking place in the summer had now “slowed substantially,” and that the economic recovery “remains uneven and far from complete, and the path ahead is highly uncertain.” He said that, as with overall economic activity, “the pace of improvement in the labour market has slowed” and in the three months ending in January employment had risen at an average monthly rate of only 29,000. Turning to monetary policy – the central concern of Wall Street – Powell was at pains to emphasise that the present regime would continue even if inflation began to rise and there was a tightening in the labour market. He noted that the Fed had made “some key changes” in its policy. With regard to employment, one of those changes was that “we will not tighten monetary policy solely in response to a strong labour market.” On inflation, he said the aim of the Fed was to achieve averages moderately above 2 percent over time. “This means that, following periods when inflation has been running below 2 percent, appropriate monetary policy will likely aim to achieve inflation moderately above 2 percent for some time.” In effect, the present policy will continue for years. This message was aimed at assuring the markets that if there were to be a spike in inflation, about which there have been warnings because of the Biden administration’s proposed $1.9 trillion stimulus package, the Fed would not respond with an immediate tightening of monetary policy. In addition, the Fed would continue to increase its holdings of Treasury securities and mortgage-backed securities “at least at their current pace until further substantial progress has been made toward our goals,” noting that these measures have “materially eased financial conditions.” The Fed is currently purchasing these financial assets at the rate of $120 billion per month – that is more than $1.4 trillion a year. This amount is equivalent to around 7 percent of gross domestic product, a level of support never before seen.
Wall Street Sends a Message to the Fed: We Have Run Out of Places to Stuff Your Treasuries – Pam Martens – The action in the U.S. Treasury market yesterday reminded us of the classic “I Love Lucy” episode at the chocolate factory. As the conveyor belt churns out chocolate balls faster than Lucy and Ethel can handle them, they resort to stuffing them in their mouths, their hats, and their shirts. (See video clip below.) That was the scene in the Treasury market yesterday – too much supply and no where to stuff it, causing a sharp spike in yields which set off a stock market selloff that left the Dow down 559.8 points or 1.75 percent on the day, while the tech-heavy Nasdaq fared far worse, losing 478.5 points or 3.52 percent. That the Treasury market is now projectile vomiting T-notes should come as a surprise to no one. As the chart above indicates, yields on the 10-year note have been rising sharply since early August, with the yield more than tripling from 0.50 percent to an intraday spike yesterday of 1.61 percent. The 10-year note opened this morning at 1.52 percent. The sharp and persistent rise in yields have left those who bought the T-notes at dramatically lower yields licking their wounds from heavy losses. (Prices of notes and bonds move inversely to their yields.) That has also dramatically lessened the appetite to buy more Treasuries at the current yields when the supply is expected to continue to increase as a result of rising government deficits and stimulus spending.Another catalyst for yesterday’s selloff in Treasuries was a very sloppy Treasury auction where the government attempted to stuff $62 billion of a 7-year Treasury note into an already over-supplied market.The spike in yields comes despite the fact that the Federal Reserve itself has beenbuying $80 billion each month in various maturities of Treasury notes and bonds. That started in June of last year. As of this past Wednesday, the Fed owned $4.8 trillion of Treasury securities, part of that resulting from its purchases of Treasuries (QE programs) after the 2008 Wall Street crash.In an additional effort to hold overall interest rates down, the Fed is also buying $40 billion each month in agency mortgage-backed securities (MBS). It owns $2.18 trillionof those, much of that also resulting from the aftermath of the 2008 crash.The Fed’s Federal Open Market Committee (FOMC) has also directed the New York Fed’s trading desk “to increase holdings of Treasury securities and agency MBS by additional amounts and purchase agency commercial mortgage-backed securities (CMBS) as needed to sustain smooth functioning of markets for these securities.” Aside from the Fed, the other big domestic buyers of Treasury securities are the mega Wall Street banks. These banks are known as “Primary Dealers” and are contractually bound to have to buy at Treasury auctions. On top of the problem of a supply glut is the fact that these mega banks/Primary Dealers have been allowed to gobble up other banks over the years, leading to a dramatic decline in the number of Primary Dealers available to bid at Treasury auctions. In 1988 there were 46 primary dealers. By 1999, there were only 30. Today, there are just 24. (Click on the plus sign under “List of Primary Dealers” here to see the names.)
Chicago Fed: “Index suggests economic growth increased in January” –“Index suggests economic growth increased in January.” This is the headline for this morning’s release of the Chicago Fed’s National Activity Index, and here is the opening paragraph from the report: Led by improvements in personal consumption-related indicators, the Chicago Fed National Activity Index (CFNAI) increased to +0.66 in January from +0.41 in December. All four broad categories of indicators used to construct the index made positive contributions in January, but three categories decreased from December. The index’s three-month moving average, CFNAI-MA3, decreased to +0.47 in January from +0.60 in December. [Download report] The Chicago Fed’s National Activity Index (CFNAI) is a monthly indicator designed to gauge overall economic activity and related inflationary pressure. It is a composite of 85 monthly indicators as explained in this background PDF file on the Chicago Fed’s website. The index is constructed so a zero value for the index indicates that the national economy is expanding at its historical trend rate of growth. Negative values indicate below-average growth, and positive values indicate above-average growth. The first chart below shows the recent behavior of the index since 2007. The red dots show the indicator itself, which is quite noisy, together with the 3-month moving average (CFNAI-MA3), which is more useful as an indicator of the actual trend for coincident economic activity.
Q4 GDP Growth Revised up slightly to 4.1% Annual Rate — From the BEA: Gross Domestic Product, Fourth Quarter and Year 2020 (Second Estimate) Real gross domestic product (GDP) increased at an annual rate of 4.1 percent in the fourth quarter of 2020, according to the “second” estimate released by the Bureau of Economic Analysis. In the third quarter, real GDP increased 33.4 percent. The GDP estimate released today is based on more complete source data than were available for the “advance” estimate issued last month. In the advance estimate, the increase in real GDP was 4.0 percent. With the second estimate, upward revisions to residential fixed investment, private inventory investment, and state and local government spending were partly offset by a downward revision to personal consumption expenditures (PCE) Here is a Comparison of Second and Advance Estimates. PCE growth was revised down to 2.4% from 2.5%. Residential investment was revised up from 33.5% to 35.8%. This was at the consensus forecast.
Q4 GDP Second Estimate: Real GDP at 4.1% The Second Estimate for Q4 GDP, to one decimal, came in at 4.1% (4.09% to two decimal places), a decrease from 33.4% (33.444% to two decimal places) for the Q3 Third Estimate and a slight increase from the Q4 Advance Estimate of 4.0%. Investing.com had a consensus of 4.2%.Here is the slightly abbreviated opening text from the Bureau of Economic Analysis news release:Real gross domestic product (GDP) increased at an annual rate of 4.1 percent in the fourth quarter of 2020 (table 1), according to the “second” estimate released by the Bureau of Economic Analysis. In the third quarter, real GDP increased 33.4 percent.The GDP estimate released today is based on more complete source data than were available for the “advance” estimate issued last month. In the advance estimate, the increase in real GDP was 4.0 percent. With the second estimate, upward revisions to residential fixed investment, private inventory investment, and state and local government spending were partly offset by a downward revision to personal consumption expenditures (PCE) (see Technical Note).The increase in real GDP reflected increases in exports, nonresidential fixed investment, PCE, residential fixed investment, and private inventory investment that were partly offset by decreases in state and local government spending and federal government spending. Imports, which are a subtraction in the calculation of GDP, increased (table 2). [Full Release] Here is a look at Quarterly GDP since Q2 1947. Prior to 1947, GDP was an annual calculation. To be more precise, the chart shows is the annualized percentage change from the preceding quarter in Real (inflation-adjusted) Gross Domestic Product. We’ve also included recessions, which are determined by the National Bureau of Economic Research (NBER). Also illustrated are the 3.17% average (arithmetic mean) and the 10-year moving average, currently at 2.07%.
Q1 GDP Forecasts –From Merrrill Lynch: Our 1Q GDP tracking estimate held at 5.5% [Feb 26 estimate] From Goldman Sachs: We left our Q1 GDP tracking estimate unchanged at +6.0% (qoq ar). [Feb 25 estimate] From the NY Fed Nowcasting Report: The New York Fed Staff Nowcast stands at 8.7% for 2021:Q1. [Feb 26 estimate] And from the Altanta Fed: GDPNow: The GDPNow model estimate for real GDP growth (seasonally adjusted annual rate) in the first quarter of 2021 is 8.8 percent on February 26, down from 9.6 percent on February 25. [Feb 26 estimate]
Seven High Frequency Indicators for the Economy –These indicators are mostly for travel and entertainment. The TSA is providing daily travel numbers. This data shows the seven day average of daily total traveler throughput from the TSA for 2019-2020 (Blue) and 2020-2021 (Red). The dashed line is the percent of last year for the seven day average. This data is as of February 21st. The seven day average is down 58.8% from last year (41.2% of last year). (Dashed line) The second graph shows the 7 day average of the year-over-year change in diners as tabulated by OpenTable for the US and several selected cities. This data is updated through February 20 2021. Dining picked up during the holidays. Note that dining is generally lower in the northern states – Illinois, Pennsylvania, and New York. Dining in Texas declined sharply due to the weather. This data shows domestic box office for each week (red) and the maximum and minimum for the years 2016 through 2019. Blue is 2020 and Red is 2021. The data is from BoxOfficeMojo through February 18th. Movie ticket sales were at $8 million last week (compared to usually around $200 million per week at this time of year). This graph shows the seasonal pattern for the hotel occupancy rate using the four week average. This data is through February 13th. Hotel occupancy is currently down 29.0% year-over-year. Seasonally we’d expect that business travel would start to pick up in the new year, but there will probably not be much pickup early in 2021. This graph, based on weekly data from the U.S. Energy Information Administration (EIA), shows gasoline supplied compared to the same week of 2019. Blue is for 2020. At one point, gasoline supplied was off almost 50% YoY. Red is for 2021. As of February 12th, gasoline supplied was off about 4.5% (about 95.5% of the same week in 2019). This graph is from Apple mobility. From Apple: “This data is generated by counting the number of requests made to Apple Maps for directions in select countries/regions, sub-regions, and cities.” There is also some great data on mobility from the Dallas Fed Mobility and Engagement Index. ![]() This data is through February 20th for the United States and several selected cities. The graph is the running 7 day average to remove the impact of weekends. According to the Apple data directions requests, public transit in the 7 day average for the US is at 50% of the January 2020 level. It is at 44% in Chicago, and 32% in Houston (weather related decline) – and mostly moving sideways, and moving up a little recently. Here is some interesting data on New York subway usage. This graph is from Todd W Schneider. This is daily data since early 2020. This data is through Friday, February 19th. Schneider has graphs for each borough, and links to all the data sources.
This data is through February 20th for the United States and several selected cities. The graph is the running 7 day average to remove the impact of weekends. According to the Apple data directions requests, public transit in the 7 day average for the US is at 50% of the January 2020 level. It is at 44% in Chicago, and 32% in Houston (weather related decline) – and mostly moving sideways, and moving up a little recently. Here is some interesting data on New York subway usage. This graph is from Todd W Schneider. This is daily data since early 2020. This data is through Friday, February 19th. Schneider has graphs for each borough, and links to all the data sources.
Yellen: $1,400 stimulus payments would help people in ‘pockets of misery’ –Treasury Secretary Janet Yellen on Monday defended President Biden’s proposal to send $1,400 direct payments to the vast majority of Americans, saying they will help people who are struggling but aren’t receiving more targeted forms of assistance. “That really helps to make sure that pockets of misery that we know exist out there that aren’t touched by more targeted things, that help is provided there as well,” Yellen said at a virtual event hosted by The New York Times. “I believe we’re going to be better off for it, and that it’s the right thing to do,” she added. The House is expected to vote this week on a $1.9 trillion coronavirus relief package that is based on a proposal Biden unveiled last month. The legislation would provide payments of $1,400 per person for individuals with income of up to $75,000 and married couples with income of up to $150,000. The payment amounts would then phase out above those thresholds, and individuals with income above $100,000 and married couples with income above $200,000 would not be eligible for any payment. The income eligibility requirements are similar to those for previous rounds of direct payments. Republicans and some centrist Democrats had pushed for narrower eligibility requirements in order to focus the payments on the lowest-income households. But progressives argued against making the payments more targeted, saying broad eligibility requirements will allow people who lost income last year due to the pandemic to get their payments quickly. Yellen said the notion of targeting money to those who need it most is an “important and valid principle,” and she noted that Biden’s plan provides targeted assistance in the form of expanded unemployment benefits, food aid and rental assistance. But she also said there are people who are struggling who aren’t being reached by the targeted forms of assistance already out there. She gave as an example people who needed to leave the labor force to take care of their children. Many of those people have lost income but are not eligible for unemployment benefits. Yellen was also asked about what tax increases Biden might pursue later in his presidency. She reiterated that Biden is interested in raising the corporate tax rate and closing corporate tax “loopholes” and that he has pledged to not raise taxes on people making under $400,000 a year.
House panel advances Biden’s $1.9T COVID-19 aid bill –The House Budget Committee on Monday advanced President Biden’s $1.9 trillion COVID-19 relief bill on a 19-16 party-line vote. The bill must be marked up by the House Rules Committee before consideration on the House floor, likely on Friday or Saturday. The legislation will then have to be taken up in the Senate, where it is expected to face considerable procedural and political challenges. “We are in a race against time. Aggressive, bold action is needed before our nation is more deeply and permanently scarred by the human and economic costs of inaction,” Committee Chairman John Yarmuth (D-Ky.) said at the hearing. The bill includes $1,400 stimulus checks, extensions to emergency unemployment benefits, funding for vaccinations and testing, $129 billion for schools, increases to child tax credits and earned income tax credits, and a plan to increase the minimum wage to $15 an hour by 2025. Rep. Brendan Boyle (D-Pa.) noted that the legislation is widely popular, with some 70 percent public support, including half of Republicans. Republicans on the panel, however, slammed Democrats for advancing the bill through budget reconciliation, a process that will allow them to pass it without GOP support in the Senate, saying the legislation amounted to a “liberal wish list” and arguing that many of its provisions have nothing to do with the pandemic. “This is the wrong plan at the wrong time and for all the wrong reasons,” said ranking member Jason Smith (R-Mo.), pointing to $350 billion in state and local aid that he said would encourage lockdowns. Republicans also noted that the Congressional Budget Office estimated that some $700 billion would not be spent until 2022 or later. Committee staff said the estimates were based on typical spending patterns and that nothing in the bill prevented key funds from being spent sooner. Though the committee approved the measure relatively quickly, it remained in session to debate nonbinding motions that could be raised later. Budget law prohibits the panel from substantially altering the reconciliation bill, which faced scrutiny in nine authorizing committee markups last week. Amendments will be possible in the Rules Committee as well. Overnight Health Care: US surpasses half a million COVID deaths |… On The Money: Neera Tanden’s nomination in peril after three GOP noes… Democrats may struggle to pass certain portions of the bill in the Senate, where they hold a 50-50 majority with Vice President Harris’s tiebreaking vote. Policies such as the $15 minimum wage may not pass muster under strict budget rules and have detractors among the Democratic caucus. Both Sen. Joe Manchin (D-W.Va.) and Sen. Kyrsten Sinema (D-Ariz.) oppose the minimum wage measure’s inclusion in the COVID-19 relief bill. Biden has vowed to get the bill signed into law before a slew of emergency unemployment benefits expire on March 14.
Minimum-Wage Proposal in Covid-19 Aid Plan Divides Senate Democrats – WSJ – Sen. Joe Manchin of West Virginia may be the most vocal Democrat sharing his concerns about the minimum-wage increase included in his party’s $1.9 trillion coronavirus relief bill – but he isn’t the only one with misgivings. As the House prepares to pass the relief bill later this week and send it to the Senate, Democratic leaders will have to contend with the quieter but broader pack of Senate Democrats who have problems with the legislation. And in order for Democrats to pass the bill without GOP support, they can’t afford to lose a single vote within their own ranks. Mr. Manchin and Sen. Kyrsten Sinema of Arizona are the only two Democrats to say outright they oppose increasing the minimum wage to $15 an hour by 2025, up from $7.25 currently. But 10 other Senate Democrats haven’t signed onto stand-alone legislation increasing the minimum wage to that level, and some have voiced objections to the current structure of the pay boost, setting the stage for possible revisions.”Everyone is going to have things that they want to see in the bill, and we’ll work hard to see if we can get those things in the bill, but job number one is to pass the bill,” Senate Majority Leader Chuck Schumer (D., N.Y.) told reporters Tuesday. The legislation, which is backed by President Biden and expected to pass the House later this week, would provide $400-a-week unemployment benefits through Aug. 29, send $1,400 per-person payments to most households, provide billions in funding for schools and vaccine distribution, expand the child tax credit, broaden child-care assistance and bolster tax credits for health insurance. Democrats broadly support the bill as they wrangle over portions of the legislation, including the duration of unemployment benefits and how to target the direct payments. But the minimum wage has emerged as the most contentious. Sen. John Hickenlooper (D., Colo.) said he is concerned about the impact of a $15 wage on small businesses and was reviewing possible ways to shield smaller firms from the new labor costs. Some Democrats are exploring offering tax relief to small businesses under the wage increase. “I think small business has got to be kept in mind, and I think there are a number of different variations that are being proposed that help insulate the impact in terms of small business,” Mr. Hickenlooper said.
House to vote on $1.9 trillion COVID relief bill this week as Senate considers minimum wage hike – The House is expected to approve President Biden’s $1.9 trillion coronavirusrelief proposal later this week in a party-line vote, after the House Budget Committee advanced the bill on Monday. Although the narrow Democratic majority in the House will likely pass the bill as is, it’s unclear whether a provision raising the minimum wage to $15 per hour by 2025 will be included in the final Senate version of the legislation. The bill, which includes $1,400 in direct payments to Americans making under $75,000, extra money for vaccine distribution and funding to state and local governments, was approved by the Budget Committee on Monday by a vote of 19 to 16. Congressman Lloyd Doggett was the sole Democrat to join Republicans in voting against the bill, although a spokesperson for Doggett later said in a statement that his “no” vote was a mistake and he “supports the COVID-19 relief legislation.” Senate Majority Leader Chuck Schumer told reporters on Tuesday that he believed the final bill would be passed by March 14, which is the day that enhanced unemployment benefits established by relief legislation passed at the end of last year are set to expire. “We’re going to meet that deadline,” Schumer said, adding that the final bill will be “not exactly the same, but very close to the bill that President Biden proposed.” Republicans have balked at the price tag on the bill, and expressed consternation that Democrats are using a process known as budget reconciliation to pass the bill, which will allow it to pass in the Senate without any Republican votes. Most legislation needs 60 votes to advance in the Senate, and Democrats hold a narrow 50-seat majority, with Vice President Kamala Harris casting any tie-breaking vote. Budget reconciliation would allow for Democrats to pass the bill with a simple majority. However, there are strict rules for utilizing the budget reconciliation process, such as the “Byrd rule,” which requires that all provisions in the bill be budget-related, and must not increase the federal deficit after a 10-year budget window. Senate parliamentarian Elizabeth MacDonough, who advises the Senate on procedural matters, will have to rule on whether the $15 minimum wage can be included under the Byrd rule.
Opinion: Stiglitz: Failing to pass Biden’s relief package would be irresponsible and reckless – As President Biden pushes ahead on his $1.9 trillion recovery package, some of the usual voices on the Right are worrying aloud that the federal government may be doing too much, especially to help the unemployed, states and middle-class workers. They, and even a few Democrats, are concerned that we will have a V-shaped recovery and that “excessive spending” may unleash inflation.For example, former Treasury Secretary Larry Summers wrote in The Washington Post that stimulus “will set off inflationary pressures of a kind we have not seen in a generation, with consequences for the value of the dollar and financial stability.”I disagree. Congress must pass this legislation or risk an anemic and devastatingly incomplete recovery.All policy entails balancing risks and figuring out what to do if the worst-case scenario turns into reality. Of course, there is a possibility – not likely, but one we would certainly welcome – that the pandemic will just disappear, the economy will experience a V-shaped recovery, and all of this spending will lead to an overheated economy.But even if that does happen, the Fed, which is now able to closely monitor the economy through real-time data, would almost surely raise interest rates. That, too, would be a good thing because the negative real interest rates we have experienced in recent years have distorted capital markets and led to a “search for yield” that encourages excessive risk-taking. And should the pandemic disappear and the economy rebound quickly, it would provide a good opportunity for the federal government to restructure the tax system – something it’s loathe to do in the midst of the pandemic recession. The average tax rate is too low to sustain the investments in infrastructure, technology and education that a prosperous 21st century-economy needs. We could even impose taxes that would increase the efficiency of our economy, discouraging pollution and excessive financial transactions that contribute to instability. And given the huge inequalities in our society, we could increase the progressivity of the tax system, by, for instance, closing loopholes and ensuring the income from capital, including capital gains, is taxed at least as much as labor. There’s another reason we should welcome a “heated” economy: In the past, it’s been the only time when we’ve been able to bring marginalized groups into the economy and reduce some of the excessive wage gaps. So let’s pray that we have that strong, V-shaped recovery that some people worry about. And if we’re that lucky, we won’t use all of the $1.9 trillion that Biden has asked for anyway. The money we spend on unemployment insurance will automatically be reduced.
Moderate Senate Democrats target state aid fund in Biden covid relief bill – Even as the House prepares to pass President Biden’s $1.9 trillion coronavirus relief bill this week, divisions are growing among Senate Democrats over state aid and a $15 minimum wage – raising the prospect the bill might have to change significantly to pass the Senate.Biden himself has forcefully defended his legislation in recent days, asking critics, “What would they have me cut?” Democratic senators, it turns out, have plenty of ideas.Democrats’ proposal would devote hundreds of billions of dollars to extending unemployment benefits through August and approving another round of stimulus payments at $1,400 per person, as well as devoting billions to vaccine distribution, housing and nutritional assistance, in addition to raising the minimum wage and helping states and local governments.Sen. Joe Manchin III (D-W.Va.), who has been a vocal skeptic of raising the current $7.25 federal hourly minimum wage to $15 an hour, as proposed by Biden, told reporters this week he hopes to amend the legislation to boost the minimum wage to $11 an hour instead.Several Democratic senators are working on changes to the portion of the bill on state and local aid, including redirecting some of the money to invest in infrastructure to expand the broadband network.Sen. Kyrsten Sinema (D-Ariz.) – who has also opposed the $15 minimum wage increase – has been working to include more funding for small restaurants in the legislation, as well as lobbying for other provisions to help her state.”Any money we spend needs to be focused where it would do the most good,” Sen. Jon Tester (D-Mont.) said at a hearing Tuesday, telling reporters later: “I think it’s part of our job to put our fingerprints on this package so it does the most good.” Tester said that he’s been in touch with some other senators and that he wants to be prepared for a possible amendment process. White House press secretary Jen Psaki acknowledged Tuesday the legislation may change and declined to rule out Biden signing a final bill that included an $11 minimum wage instead of the $15 he initially proposed. Any changes sought by moderates could run into resistance from liberal lawmakers and party leaders who have insisted on keeping the $15 an hour minimum wage plan in the bill.
A $15 Minimum Wage Can’t Be Included In Biden’s $1.9 Trillion Stimulus Plan, Senate Official Rules -A key advisor to the U.S. Senate on the chamber’s rules and procedures said Thursday that a $15 national minimum wage – a major priority for President Biden and progressive Democrats – cannot be included in the $1.9 trillion stimulus bill Democrats are pushing through Congress under budget reconciliation rules. The special budget process will allow Democrats, who now control the Senate by the slimmest of margins, to pass Biden’s aggressive stimulus proposal without any Republican votes, but reconciliation rules also require that every provision in the legislation have a direct impact on the federal budget. Elizabeth MacDonough, the Senate’s parliamentarian, said Thursday that the wage hike does not meet the criteria to be included in the bill under the special reconciliation process, according to multiple news reports.The push for a $15 minimum wage emerged as a divisive issue this month as lawmakers began crafting the sweeping rescue package.Republicans objected to the provision on the basis that it would be too expensive for businesses and could actually cost jobs. Conservative Democratic Sen. Joe Manchin of West Virginia has said he objects to the wage hike (he has suggested that an $11 per hour national minimum wage would make more sense for his state), as has Sen. Krysten Sinema (D-Ariz.). “We must pass a minimum wage bill,” House Speaker Nancy Pelosi (R-Calif.) said during a press briefing Thursday morning. She added that Congress last passed a wage hike 14 years ago, when Democrats raised the federal minimum to $7.25 per hour. Biden’s $1.9 trillion American Rescue Plan includes another round of $1,400 stimulus checks for individuals – another sticking point for some lawmakers. The proposal also includes expanded federal unemployment insurance of $400 per week through the end of August, a major expansion of the child tax credit, $130 billion for schools, $160 billion for coronavirus testing, tracing, and vaccines, roughly $7 billion for small businesses and $350 billion for state and local governments. On Tuesday, Republican Sens. Tom Cotton of Arkansas and Mitt Romney of Utahintroduced a counterproposal to raise the minimum wage to $10 by 2025 and then index the wage to inflation every two years. That plan would grant businesses with fewer than 20 employees an extra two years to comply with the federal minimum, and it would require that employers verify the legal state of their workers. Sens. Shelley Moore Capito (R-W.Va.), Susan Collins (R-Maine) and Rob Portman (R-Ohio) signed onto that plan on Thursday, one day after Sen. Josh Hawley (R-Mo.) introduced another alternative. Hawley’s plan would send quarterly refundable tax credits to workers earning less than $16.50 per hour. The tax credits would only go to those workers with valid Social Security numbers. The Washington Post reported Thursday afternoon that House Democrats still planned to include the $15 minimum wage provision in the bill if the parliamentarian voted against them, but House Majority Leader Steny Hoyer (D-Md.) told CNN Thursday evening that Democrats hadn’t yet made that decision. It’s not yet clear whether Democrats will pursue a narrower compromise that might attract enough bipartisan support to pass as a standalone bill outside of the reconciliation process.
Pimco says a $1.9 trillion stimulus could push US growth to 7.5% this year – a rate not seen since the 1950s -The US economy could grow by 7.5% in 2021 – a rate not seen since the 1950s – as a result of President Joe Biden’s $1.9 trillion stimulus package, analysts at investment giant Pimco said in a note on Wednesday.Pimco predicted that although this rapid growth would push up inflation to above 2% over the “next several years”, it is unlikely to cause price rises to spiral due, in part, to the reduced bargaining power of workers.Pimco head of policy Libby Cantrill and economist Tiffany Wilding said they expected the eventual stimulus package to be close to the $1.9 trillion size that President Biden is seeking.They said the legislation’s focus on enhancing social safety net provisions such as unemployment benefits, coupled with direct support to households and businesses, “boosts the near-term growth outlook.”Cantrill and Wilding added that the size of the package may also help to cushion the blow to the economy should any problems crop up, such as a slower-than-expected vaccination program.They upped their growth prediction for the US economy in 2021 to between 7% and 7.5%, more than making up for the 3.5% contraction in 2020.A 7.5% expansion would be the strongest since the early 1950s, although the US sawgrowth of more than 7% in 1984.Rising growth expectations have troubled financial markets lately, however, as they have led to higher bond yields. This has made stocks look less attractive and pulled down the tech-heavy Nasdaq index this week.The Pimco note said the rapid economic growth and rise in employment “doesn’t have huge implications for our inflation outlook.” Cantrill and Wilding said this was in part because a decline in labor unions means workers are now less able to achieve wage rises.Nonetheless, Pimco expects US inflation to rise to 2% in 2021 before dropping to around 1.5% by the end of the year. It then expects inflation to gradually accelerate to a range of 2.2% to 2.5% over the course of the next several years.”It’s not surprising that more investors are worried about another inflationary accident,” Cantrill and Wilding said.Yet they added: “While a period of above-target inflation has become more likely, in our view, the likelihood of a self-reinforcing inflationary process similar to what happened in the 1970s is still relatively low.”
GOP rallies against Democrats’ $1.9 trillion COVID-19 relief package – Republicans are closing ranks against Democrats’ proposed $1.9 trillion COVID-19 relief bill, even as the White House seemed to rule out a procedural Senate power play to protect one provision most treasured by progressives: a minimum wage hike. Despite paper-thin congressional majorities, Democratic leaders were poised to push the sweeping package through the House on Friday. They were hoping the Senate, where changes seem likely, would follow quickly enough to have legislation on President Joe Biden’s desk by mid-March. By early Thursday, not one Republican in either chamber had publicly said he or she would back the legislation. GOP leaders were honing attacks on the package as a job killer that does too little to reopen schools or businesses shuttered for the coronavirus pandemic and that was not only wasteful but also even unscrupulous. “I haven’t seen a Republican yet that’s found something in there that they agree with,” said House Minority Leader Kevin McCarthy, R-Calif. “I think all Republicans believe in three simple things: They want a bill that puts us back to work, back to school and back to health. This bill is too costly, too corrupt and too liberal.” The hardening opposition suggested that Biden’s first major legislative initiative could encounter unanimous GOP opposition. That was a counterpoint to his refrain during his campaign about bringing the country together and a replay of the Republican wall that new President Barack Obama encountered in 2009 and most of his administration. Democrats showed no signs of backing down against Republican claims that the bill was wasteful, too expensive and not focused enough on key needs like reopening schools. “This kind of reflexive partisan opposition is not going to wash with the American people. It wouldn’t wash at any time, but it especially doesn’t wash during this time of crisis,” Senate Majority Leader Chuck Schumer, D-N.Y., said Thursday.
Senate parliamentarian rules against including minimum wage in Covid relief bill – The Senate parliamentarian has ruled against including the increase in the minimum wage in the Covid relief bill.While Democrats had pushed for the increase to be included — and leadership expressed its disappointment in the ruling Thursday evening — its removal may actually make it easier to pass the bill, senior Democratic sources believe, because it’ll avoid a messy fight over whether to strip it out of the bill and whether to compromise.”President Biden is disappointed in this outcome, as he proposed having the $15 minimum wage as part of the American Rescue Plan,” White House press secretary Jen Psaki said in a statement. “He respects the parliamentarian’s decision and the Senate’s process.” For now, far from being a defeat, the ruling is viewed as clearing the way for the bill’s passage in the Senate, a Biden administration official told CNN.House Speaker Nancy Pelosi said Thursday evening the provision will remain in the House bill on which the chamber is voting Friday. However, the parliamentarian ruled that the increase to $15 per hour did not meet a strict set of guidelines needed to move forward in the Senate’s reconciliation process. That means that the House will pass its bill, the Senate will have to strip the minimum wage provision out, and then eventually the House will have to pass that bill again at the end of the process. But the ruling likely makes it easier for Senate Majority Leader Chuck Schumer to get his members in line behind the bill since the rise in the minimum wage had been a key sticking point for moderates like Sens. Kyrsten Sinema of Arizona and Joe Manchin of West Virginia.
“I’m Sorry,” Says Ro Khanna, “An Unelected Parliamentarian Does Not Get to Deprive 32 Million Americans the Wage Raise They Deserve.” – Leading progressives – including Sen. Bernie Sanders and Reps. Ro Khanna and Pramila Jayapal – reacted with opposition and disbelief Thursday evening after Elizabeth MacDonough, the chief Senate parliamentarian, issued her belief and guidance that inclusion of a federal minimum wage increase in the pending Covid-19 relief package does not qualify for the budget reconciliation process that would allow the bill to be passed by the chamber with a simple majority. “I strongly disagree with tonight’s decision by the Senate Parliamentarian,” said Sanders in a statement. Citing recent reviews by the Congressional Budget Office (CBO) which showed the outsized impact that raising the wage would have on the federal budget, the Vermont lawmaker and current Senate Budget Committee chairman – who has made raising the federal minimum a cornerstone of his presidential campaigns in both 2016 and 2020 – said the assessment wildly missed the mark. “The CBO made it absolutely clear that raising the minimum wage to $15 an hour had a substantial budgetary impact and should be allowed under reconciliation,” Sanders said. “It is hard for me to understand how drilling for oil in the Arctic National Wildlife Refuge was considered to be consistent with the Byrd Rule, while increasing the minimum wage is not.” Sanders was far from alone in condemning the absurdity of the decision as well as the procedural system that empowers the parliamentarian with such authority. As Rep. Ro Khanna (D-Calif.) put it: “Amazing that American democracy has landed in a place where some unheard of parliamentarian ends up deciding whether or not a law gets passed to give millions a raise. Simple question: are you on the side of structural reform in standing up to this system or for the status quo?” According to Rep. Pramila Jayapal, chair of the Congressional Progressive Caucus, “The ruling only makes it more clear that the Senate must reform its archaic rules, including reforming the filibuster to allow populist and necessary policies like the $15 minimum wage to pass with a majority of the Senate.” “We must deliver,” she added, “on the promise we made to voters all across this country: that we would give 27 million workers a long-overdue raise and lift one million people out of poverty during this devastating economic crisis.”.
Chump change: The Romney – Cotton minimum wage proposal leaves 27 million workers without a pay increase -EPI Blog –Those who had high hopes for a serious minimum wage proposal from the Republican Party will be disappointed: The recent proposal released by Sens. Mitt Romney (R-Utah) and Tom Cotton (R-Ark.) would not even increase the minimum wage to 1960s levels, after adjusting for inflation. It is a meager increase that fails to address the problem of low pay in the U.S. economy.The Romney – Cotton proposal would slowly raise the federal minimum wage from its current level of $7.25 per hour to $10 per hour in 2025. In contrast, the Raise the Wage Act of 2021 would raise the minimum wage to $15 per hour by 2025.
- The Romney – Cotton proposal would leave 27.3 million workers without a pay increase, compared to the Raise the Wage Act.
- Only 4.9 million workers, or 3.2% of the workforce, would receive a pay increase in 2025 under the Romney – Cotton plan, for a total of $3.3 billion dollars in wage increases.
- In contrast, under the Raise the Wage Act, pay would rise for 32.2 million workers, or 21.2% of the workforce, with $108.4 billion in total wage increases.
- 11.2 million fewer Black and Hispanic workers would receive a raise under the Romney – Cotton plan, compared with the Raise the Wage Act.
- 16 million fewer women would see wage increases. Less than one in 20 women (4.1%) would have higher pay under the Romney – Cotton proposal, whereas the Raise the Wage Act would raise earnings for one in every four women (25.8%).
- The average affected worker who works year-round would see their annual pay rise by $700 under the Romney – Cotton plan; under the Raise the Wage Act, the average annual pay increase would be nearly five times that amount ($3,400).
Romney – Cotton’s $10 target by 2025 is the equivalent of $9.19 per hour in today’s dollars, about 13% less than what the minimum wage was at its high-water mark in 1968.It is unconscionable that we should pay the lowest-wage workers today less than what they earned five decades ago, while the economy’s productivity has more than doubled over the last 50 years. The Romney – Cotton proposal would continue that harmful trend; would maintain a separate lower wage for young workers and those with disabilities; and would – incredibly – fail to increase the separate minimum wage for tipped workers that has been stuck at $2.13 per hour for 30 years.
Senate Democrats move immediately to “Plan B” on minimum wage – Senate Democrats are racing to finalize a new tax provision that would penalize large companies that pay low wages. The move comes after Senate Parliamentarian Elizabeth MacDonough ruled Thursday night that a $15 minimum wage hike cannot be included in the Senate COVID relief package, which is currently being pushed through the chamber through a process known as budget reconciliation. The plan being drafted by aides to Senate Finance Committee chair Ron Wyden of Oregon – in close consultation with Senate Budget Chair Bernie Sanders of Vermont – would impose a 5% payroll tax penalty on “very large” companies that do not pay workers a certain amount. That amount is still unclear: Wyden favors $15 an hour, but is currently seeking feedback from fellow Democrats on that figure and on exactly which companies would face the penalties. “Everyone in the caucus is envisioning ‘very large’ companies – think Walmart, Amazon,” a Senate Democratic aide told CBS News.Under the proposal, which Senate Democrats hope to finish crafting by early next week, smaller businesses that raise their workers’ wages would be eligible for income tax credits equal to 25% of wages – up to $10,00 per employer to year – tax incentives to increase wages. “Basically we’re having the stick approach for the very big companies at the top, and the carrot approach for the smallest of small businesses to try to encourage them to raise wages on their own,” the aide said.Democratic aides, anticipating an adverse ruling from the Senate parliamentarian, began quietly working on the “Plan B” proposal several weeks ago. The tax penalties would apply not only to large companies that pay their own employees low wages, but also to those that hire contractors – such as security guards – who earn low wages for work they do on premises.
‘Paid To Stay Home’?! COVID Bill Pays Federal Employees With Kids Out Of School Up To $21K –The U.S. House version of the “American Rescue Plan Act of 2021” – a $1.9 trillion emergency aid package to help America recover from the coronavirus pandemic has an extra perk for federal workers: Enhanced paid time off if your child is enrolled in a school that isn’t back to full-time, in-classroom instruction.B Critics call it a personal bailout for bureaucrats. It is funded through a new $570 million family leave account exclusively for federal workers.While millions of parents struggle to work from home with kids who are enrolled in shuttered or partially shuttered schools, and millions more left the workforce or lost jobs to care for their at-home children, evidently parents in the federal bureaucracy need their own, personal Covid-19 bailout.Buried on page 305 of the House bill released late last Friday night (included after the bailout details for states and localities), is a new Treasury Department fund called the “Emergency Federal Employee Leave Fund.”$570 million in the new fund is available through September 30. Federal employees caring for others due to Covid-19 are eligible for paid leave.Among those eligible are those who are “unable to work” because they are caring for school-aged children not physically in school full time “due to Covid-19 precautions[.]”The new Fund allows a federal employee “caring for a son or daughter” to qualify for the paid leave, specifically: “if the school or place of care of the son or daughter has been closed, if the school of such son or daughter requires or makes optional a virtual learning instruction model or requires or makes optional a hybrid of in-person and virtual learning instruction models, or the child care provider of such son or daughter is unavailable, due to Covid-19 precautions;”Under the bill as currently drafted, full-time federal employees can take up to 600 hours in paid leave until September 30, up to $35 an hour and $1,400 a week. That’s 15 weeks for a 40-hour employee. Part-time and “seasonal” employees are eligible, too, with equivalent hours established by their agency.Federal employees currently have up to 12 weeks of unpaid leave under the Family and Medical Leave Act. (A law passed in 2019, allows most federal employees – what the sponsors report is 2.1 million federal workers – up to 12 weeks of paid leave for the birth, foster placement or adoption of a new child.)
Nearly a year into the pandemic and unemployment claims remain 17 million above their pre-pandemic levels: Congress must pass $1.9 trillion relief bill -EPI — Another 1.2 million people applied for unemployment insurance (UI) benefits last week, including 730,000 people who applied for regular state UI and 451,000 who applied for Pandemic Unemployment Assistance (PUA) – the federal program for workers who are not eligible for regular unemployment insurance, like gig workers.The 1.2 million who applied for UI last week was a decrease of 172,000 from the prior week, reversing last week’s increase of 164,000. The four-week moving average of total initial claims was roughly unchanged (a slight decline of 8,500).Last week was the 49th straight week total initial claims were greater than the worst week of the Great Recession. (If that comparison is restricted to regular state claims – because we didn’t have PUA in the Great Recession – initial claims last week were roughly the same as the 9th-worst week of the Great Recession. Figure A shows continuing claims in all programs over time (the latest data for this are for February 6). Continuing claims are currently nearly 17 million above where they were a year ago.The December 11-week extensions of Pandemic Emergency Unemployment Compensation (PEUC) and PUA just kick the can down the road – they are not long enough. Congress must pass further extensions well before mid-March, or millions will exhaust benefits at that time, when the virus is still rampant and the labor market is still weak. It is already probably unlikely that gaps in payments can be avoided in many places even if Congress wraps up the next round of COVID-19 relief as soon as possible, due to processing times. In the debates around the COVID relief package, some have expressed concern that the proposed $1.9 trillion relief and recovery plan is too big. These concerns are misplaced. The full $1.9 trillion in relief and recovery is crucial.
House passes $1.9 trillion coronavirus stimulus bill – The House passed its $1.9 trillion coronavirus relief bill early Saturday, sending the massive proposal to the Senate as Democrats rush to approve more aid before unemployment programs expire.It is the first major legislative initiative for President Joe Biden. The House approved it in a 219-212 mostly party line vote, as two Democrats joined all Republicans in opposing it.Senators will start considering the pandemic assistance plan next week. Lawmakers will offer amendments, and the chamber will likely pass a different version of the bill, meaning the House would have to pass the Senate’s plan or the chambers would have to craft a final proposal in a conference committee.Democrats, who hold narrow majorities in the House and Senate, opted to approve the legislation alone through budget reconciliation rather than hammer out a smaller aid package with Republicans. The process enables a bill to pass with a simple majority in the Senate.The House plan includes:
- Payments of $1,400 to most individuals, along with the same amount for each dependent. Checks start to phase out at $75,000 in income and go to zero for individuals making $100,000
- A $400 per week unemployment supplement through Aug. 29, along with an extension of programs making millions more people eligible for jobless benefits
- An expansion of the child tax credit to give families up to $3,600 per child over a year
- $20 billion for Covid-19 vaccine distribution and $50 billion for testing and tracing efforts
- $350 billion in state, local and tribal government relief
- $25 billion for assistance in covering rent payments
- $170 billion for K-12 schools and higher education institutions to cover reopening costs and aid to students
- A $15 per hour federal minimum wage, which the Senate parliamentarian will not allow in the reconciliation bill on the other side of the Capitol
Democrats have called the bill necessary to speed up vaccinations – a critical step to resuming some level of pre-pandemic life – and sustain households at a time when roughly 19 million people are receiving jobless benefits.”The time for decisive action is long overdue,” House Speaker Nancy Pelosi, D-Calif., said Friday night before the vote. “President Biden’s American Rescue Plan is that decisive action.”Republicans questioned the need for a proposal so large, criticizing in particular the scope of the direct payments, state and local government support and school funding. Earlier Friday, House Minority Leader Kevin McCarthy, R-Calif., contended the legislation “isn’t a relief bill” and “fails to deliver for American families.”The Biden administration and Democratic leaders in Congress said the country faces a bigger risk of doing too little than injecting too much money into the response. Some economists have also questioned the scale of the bill. Senate Democrats face more challenges in passing the legislation than the House did. While the party can approve the bill on its own, it will need every Democrat to support it in the Senate, which is split 50-50.Democrats also have to decide how to proceed on minimum-wage policy without losing any support. After the Senate parliamentarian ruled the bill could not include a $15 pay floor under reconciliation rules, Senate Majority Leader Chuck Schumer, D-N.Y., and Sens. Ron Wyden, D-Ore., and Bernie Sanders, I-Vt., have looked for a workaround to impose a tax penalty on large corporations that do not pay workers at least $15 an hour.It is unclear if the proposal would comply with the Senate’s budget restrictions.Vice President Kamala Harris also appears set against trying to overrule parliamentarian Elizabeth MacDonough, which some progressives have suggested she should do.
$1.9 trillion stimulus: What you can expect – The $1.9 trillion coronavirus package passed by the House of Representatives contains a wide range of proposals to help Americans still struggling with the economic fallout of the pandemic.The legislation, which largely mirrors the relief proposal outlined in January by President Joe Biden, providesanother round of direct payments, as well as additional assistance for the unemployed, hungry, uninsured and at risk of losing their homes. It also would provide a bigger tax break for parents.Biden and congressional Democrats argue that another massive bill is necessary to assist both people in need and the nation at large.Now the bill moves to the Senate, which may add, change or eliminate some provisions — including the proposed $15 minimum wage, which the Senate parliamentarian has determined can’t be included under the rules Democrats plan to use for the bill.The House bill would provide direct payments worth up to $1,400 per person to families earning less than $200,000 a year and individuals earning less than $100,000 a year. Because the payments phase out faster than previous rounds, not everyone who was eligible for a check earlier will receive one now — but for those who are eligible, the new payments will top up the $600 checks approved in December, bringing recipients to a total of $2,000 apiece.Individuals earning less than $75,000 would receive the full $1,400 and the amount would phase out for those earning more, up to $100,000.Couples earning less than $150,000 a year would receive $2,800 — and families with children would be eligible for an additional $1,400 per dependent.The payments will be calculated based on either 2019 or 2020 income. Unlike the previous two rounds, adult dependents — including college students — would be eligible for the payments.Out-of-work Americans would get a federal weekly boost of $400 through August 29. Those enrolled in two key pandemic unemployment programs could also continue receiving benefits until that date.Freelancers, gig workers, independent contractors and certain people affected by the coronavirus could remain in the Pandemic Unemployment Assistance program for up to 74 weeks and those whose traditional state benefits run out could receive Pandemic Emergency Unemployment Compensation for 48 weeks.The jobless in these pandemic programs will start running out of benefits in mid-March, when provisions in December’s $900 billion relief package begin to phase out along with the current $300 federal weekly enhancement.Food stamp recipients would see a 15% increase in benefits continue through September, instead of having it expire at the end of June.And families whose children’s schools are closed may be able to receive Pandemic-EBT benefits through the summer, if their state opts to continue it. The program provides funds to replace free- and reduced-price meals that kids would have been given in school.The legislation would send roughly $19.1 billion to state and local governments to help low-income households cover back rent, rent assistance and utility bills.About $10 billion would be authorized to help struggling homeowners pay their mortgages, utilities and property taxes.It would provide another $5 billion to help states and localities assist those at risk of experiencing homelessness.
Biden, Trudeau aim to move past Keystone pipeline disagreement in first bilateral meeting –(Reuters) – U.S. President Joe Biden and Canadian Prime Minister Justin Trudeau will try on Tuesday to move past an early disagreement after Biden blocked the Canadian-backed Keystone XL pipeline and look to reset relations after the rocky years of Donald Trump.In his first bilateral meeting with a foreign leader since taking office last month, Biden is expected to discuss with Trudeau a host of issues including climate change and China, a senior U.S. administration official told reporters. Canada has often been a U.S. president’s first foreign stop, but the COVID-19 pandemic has turned the sit-down between the two leaders and some of their top deputies into a virtual affair. The event is likely to result in a shared document outlining cross-government collaboration on a wide range of issues, the senior U.S. administration official said. It was not clear the meeting would result in any new deal on those or other concerns, including Canada’s access to vaccines produced in the United States or a shared standoff with China over the detention of a Huawei executive. “The most important thing here is a reinvigorated road map for cooperation between the United States and Canada, meaning that we’re going to talk regularly to one of our closest allies to make sure that there’s no kind of misunderstandings,” the U.S. official said.Biden is eager to address security threats from climate change to the coronavirus pandemic as well as China, Iran, Russia and North Korea. He irritated Ottawa early on by blocking the $8 billion Keystone XL pipeline project to pump oil sands crude from Alberta to Nebraska, and proposing a “Buy American” program aimed at directing more U.S. spending toward domestic manufacturers. Trudeau is aiming to show he is now aligned with Washington on issues including COVID-19, climate change and foreign policy, a Canadian government source said.
Fauci: U.S. political divide over masks led to half a million COVID-19 deaths –Anthony Fauci, the nation’s leading infectious disease expert, said on Monday that political divisiveness over the use of masks contributed to the U.S. coronavirus death count. Fauci made the comments on the same day the country’s death toll reached half a million people one year after the start of the pandemic. Calling the grim milestone “stunning” in an interview with Reuters, Fauci said the divide over mask wearing, which split Americans politically during a presidential election year, turned the public health measure into a political statement. “Even under the best of circumstances, this would have been a very serious problem,” Fauci said. “However, that does not explain how a rich and sophisticated country can have the most percentage of deaths and be the hardest-hit country in the world,” Fauci said. Fauci also called the disregard by some governors and mayors of recommendations for how to reopen the country safely after near-nationwide lockdowns last spring “incomprehensible.” “When the American spirit is so divided, that really, really made me sad,” he said. While Fauci would not lay all the blame on the former Trump administration, he noted “the lack of involvement at the very top of the leadership in trying to do everything that was science-based was clearly detrimental to the effort.” While the U.S. has 4 percent of the world’s population, it has almost 20 percent of all coronavirus deaths, according to Reuters. . “This is the worst thing that’s happened to this country with regard to the health of the nation in over 100 years,” Fauci said. Fauci told Reuters that it was difficult to predict when the pandemic would be over due to the emergence of new coronavirus variants from South Africa and Brazil. Some studies have indicated that these strains are more resistant to the existing coronavirus vaccines. Fauci has suggested that Americans could get pre-pandemic life back by Christmas but has warned restrictions could last until next year.
Feds OK’d Export of Millions of N95 Masks as U.S. Workers Cried for More – In the midst of a national shortage of N95 masks, the U.S. government quietly granted an exception to its export ban on protective gear, allowing as many as 5 million of the masks per month to be shipped overseas. The Federal Emergency Management Agency issued the waiver in the final moments of Donald Trump’s presidency last month, allowing a Texas company to export its products after it failed to secure U.S. customers, according to the FEMA letter obtained by KHN.National Nurses United president Zenei Triunfo-Cortez called the export waiver “unconscionable” and said N95s remain under lock and key in many hospitals. She said she still has to “beg” for a new N95 if hers gets soiled during a shift caring for covid-19 patients.Health care employers “and a federal agency that is supposed to be protecting the people of America are not doing their jobs,” she said. “They have no regard for our safety.”The disconnect between front-line workers going without better protection and federal officials suddenly exporting masks boils down to one thing, workplace-safety experts say: The government has not pivoted quickly enough to lift supply chain crisis-mode guidelines and force employers to take costly and sometimes cumbersome steps to better protect workers with top-quality gear.The FEMA letter references the challenge that Fort Worth-based Prestige Ameritech faced in finding customers for its government-approved, high-end respirators: Hospitals did not want to “fit test” employees to its N95s, a 15-minute process per employee to ensure that a new N95 model seals to the face, according to company president Mike Bowen.Bowen said he ramped up N95 production during the pandemic from 75,000 to 9.6 million per month. Lately, he said, he can’t sell them to major buyers, does not have the infrastructure to sell them to small buyers and has so many in storage that he may need to lay off workers and wind down production.The FEMA letter references those challenges and says the waiver was granted in the “national defense interest” to ensure he keeps production running at pace. The letter was transmitted to Border Patrol officials who oversee exports 103 minutes before Joe Biden was sworn into office.
House Democrats demand answers on TV ‘misinformation rumor mills’ –House Democrats are pressing cable and streaming services over their decisions to host channels that the lawmakers accuse of spreading misinformation and conspiracy theories that lead to “real world harm.” Reps. Anna Eshoo (Calif.) and Jerry McNerney (Calif.), senior members of the House Energy and Commerce Subcommittee on Communications and Technology, sent letters to the companies on Monday questioning their “ethical principles” involved in deciding which channels to carry and when to take action against a channel. “Some purported news outlets have long been misinformation rumor mills and conspiracy theory hotbeds that produce content that leads to real harm,” they wrote. “Misinformation on TV has led to our current polluted information environment that radicalizes individuals to commit seditious acts and rejects public health best practices, among other issues in our public discourse.” The letter specifically calls out Newsmax, One America Network (OANN) and Fox News. A Fox News media spokesperson said the letter “sets a terrible precedent.” “As the most watched cable news channel throughout 2020, FOX News Media provided millions of Americans with in-depth reporting, breaking news coverage and clear opinion. For individual members of Congress to highlight political speech they do not like and demand cable distributors engage in viewpoint discrimination sets a terrible precedent,” the spokesperson said in a statement. The lawmakers also asked for information about the number of users who tuned into the stations in the weeks leading up to the election and the Jan. 6 riot at the Capitol. Eshoo and McNerney sent letters to traditional cable providers, including Verizon and Comcast, as well as tech companies that provide channels as part of streaming services including Amazon, Google, Apple, Roku and Hulu.
Facebook shuts down group with 90,000 cruise ship crew members – On Friday, an online Facebook Group with approximately 90,000 cruise ship employee members entitled “The Crew Bar” was shut down by the social media company. Moderators received no prior warning or explanation and were only sent a message which read, “Your group has been disabled. This is because it goes against our Community Standards on dangerous individuals and organizations. We have these standards to prevent and disrupt offline harm.” “The Crew Bar” group name is taken from officially-designated, employee-only recreational facilities in crew living quarters aboard typical cruise ships. The page intended to be an online simulation of this unique social environment. Its purpose was to enable members of the hundreds of thousands-strong, international cruising workforce to stay in touch with one another, share important workplace information and news, and primarily, to socialize. While there are several similar such groups and pages on Facebook that have been created by and for seafarers, “The Crew Bar” was the largest and most broad-based. Whereas the other groups tend to be oriented to specific crew nationality or employer, the former was used as an all-inclusive platform for ship workers across all companies and nationalities to share their experiences working at sea. The Crew Bar Facebook Page Banner. Source: The Crew Bar During the initial phases of the coronavirus pandemic and the subsequent global shutdown of cruising – which left hundreds of thousands of crew members marooned for months – the page functioned as an emotional support group for those who were stranded and concerned about the future of their livelihood in the wake of the collapse of the industry. It also supported those who were nostalgic for better days working at sea. The disabling of “The Crew Bar” comes amidst Facebook’s recently announced program of depoliticizing its platform for its nearly three billion users, as well as the banning of all news sources in Australia. These moves come as a part of a broader effort by the social media giant to monitor, track and shut down “inauthentic behavior” on its platform. In the aftermath of the 2016 US presidential elections, major tech monopolies including Facebook, Google and Twitter – falling in line with the narrative of “Russian meddling” promoted by the American Democratic Party establishment – announced the strengthening of censorship and content-restricting initiatives.
A wonderful year for the elite: Top 25 hedge fund managers earned record $32 billion in 2020 as millions plunged into miseryOn February 22, the Institutional Investor (II) published its annual “Rich List” of the top twenty-five hedge managers and their earnings in 2020. During a year in which tens of millions of people lost their jobs and hundreds of thousands died from the coronavirus pandemic in the US, these super-wealthy individuals collectively increased their earnings 50 percent over 2019 to $32 billion. In “The 20th Annual Rich List, the Definitive Ranking of What Hedge Fund Managers Earned in 2020,” Stephen Taub wrote, “A bad year for humanity was a wonderful year for the hedge fund elite.” To this the editors of the publication added, “when volatility increases and stock markets soar – regardless of their connection to the real economy – a select group of men (and yes, it is all men on II’s 2020 Rich List) stand to make bank. It may not be seemly, but it remains fact. And Steve Taub, alone among his peers, consistently gets it right.” Topping the list was Israel (Izzy) Englander, the founder and CEO of Millennium Management , who earned $3.8 billion in 2020. Englander, 72, more than doubled his 2019 earnings of $1.5 billion and has a net worth of $7.2 billion and is 74th richest American according to the Forbes 400 2020 list. Englander’s Millennium Management is characterized in investment circles as “the world’s largest alternative asset management firm with $39 billion assets under management” and it operates in America, Europe and Africa. The Millennium Management fund increased its value by 26 percent and earned “$10.2 billion in 2020, bringing the firm’s lifetime return for investors to $36 billion,” according to the II profile of Englander which noted, “Englander has been on the Rich List in 19 of 20 years, including last year’s tie for third place.” To get a sense of the amount of money earned by Englander in 2020, his payout of $3.8 billion would cover the living expenses of 5,000 families of four for 10 years. The other 24 individuals on the “Rich List” earned between $1 billion and $2.6 billion and top 10 earned a collective $20 billion. A hedge fund is a pooled investment fund that engages in complex trading schemes on Wall Street. Short selling (betting that the value of a stock is going to fall), leverage (borrowing funds to purchase a financial asset) and derivatives (complex bundles of assets such as forwards, futures, options and swaps) are among the techniques used by hedge funds and these activities are available only to “institutional investors” and “high net worth individuals” who are part of the exclusive super-wealthy financial oligarchy. One searches high and low online to find a single word of criticism or objection to the grotesque accumulation of wealth by the hedge fund managers hailed by the publishers and editors of II. It does not register in the capitalist press that there is any problem at all with a handful of billionaires raking in more billions while millions are without jobs, food, shelter and health care while the government and corporate America are demanding workers stay on the job and children go back to school to face the deadly pandemic.
Fed nears decision on continued easing of bank capital rule – The Federal Reserve is nearing a decision on whether to extend temporary capital relief given to banks last year to help them manage the economic fallout from the coronavirus pandemic, Fed Chair Jerome Powell told lawmakers Tuesday. The Fed and other agencies last spring allowed banks subject to the supplementary leverage ratio to exclude U.S. Treasury securities and deposits at Federal Reserve banks from the measure of capital relative to assets. The exemptions, set to expire March 31, were meant to free up resources to make loans and other purposes. While the central bank is still weighing its options, Powell indicated to members of the Senate Banking Committee that an extension is on the table. The deadline is also approaching on the relief provided by the Federal Deposit Insurance Corp. and Office of the Comptroller of the Currency. “We have not decided what to do there yet, and we’re actually looking into that right now,” Powell said, adding that the Fed will announce a decision “pretty soon.” The SLR requires banks with more than $250 billion of assets to maintain an extra cushion of high-quality capital against their total assets. Banks must maintain a minimum 3% ratio against their total leverage exposure. The ratio is 5% for the largest bank holding companies. The temporary relief was intended to allow banks to expand their balance sheet and relieve some stress on the functioning of the Treasury market, but the Fed had also estimated that the change would reduce the required amount of capital at bank holding companies by $76 billion. That elicited backlash from Democratic lawmakers and others who expressed concern about banks shedding capital in the midst of a crisis, and Tuesday’s hearing revealed that the issue still divides lawmakers. Senate Banking Committee Chair Sherrod Brown, D-Ohio, urged Powell not to extend the relief for any banks that have continued to pay dividends to shareholders “rather than invest in the real economy.” “The Fed reduced capital standards so banks would lend more, not so they would pay dividends, but it’s not what’s happening,” said Brown. “The biggest banks have gotten larger, they’ve gotten more profitable, but they haven’t increased lending. Dividends, however, remain steady.” But Powell told Brown that he didn’t think it would be appropriate to tie continued SLR relief to dividend payments. “I’m not going to commit to connecting that decision to the payment of dividends as a separate matter,” Powell said. “What you see now is a banking system that has higher capital than it did going into the pandemic, and particularly for the largest banks.” Powell said that the nation’s largest banks “proved resilient” throughout the past year amid the economic turmoil, and that he doesn’t expect that to change. “They’ve been able to keep lending, their capital levels have actually gone up during this period … so I think that the work that we did over the course of the last decade and then some has held up pretty well so far, and I expect it to continue,” he said.
Industry was strong enough without dividend, buyback curbs- Quarles – In response to the COVID-19 crisis, the Federal Reserve took novel steps to measure and strengthen bank capital. But now, the central bank’s top supervisory officials says some extradordinary measures were unnecessary, and the Fed could have just stuck with its normal stress test regime. Due to the pandemic, the Fed complemented its June 2020 stress tests with “sensitivity analyses” assessing how the largest banks’ balance sheets would respond to various economic recovery scenarios. Based on those analyses, the results of which were published June 25, the Fed blocked share repurchases and capped the dividend payments banks could make to shareholders. But Fed Vice Chair of Supervision Randal Quarles said, based on how banks have navigated the crisis, it is evident now that their capital levels would have remained adequate without those shareholder restrictions. That calls into question the need for irregular stress test exercises, he said. “With the benefit of hindsight, I think it’s now clear that we could have not imposed those distribution limitations [and] the banking system would have been fine,” Quarles said Thursday at a virtual event hosted by the Federal Reserve Bank of Atlanta. The comments echo earlier remarks he made in June touting the potential of the Fed’s standard stress test regime to measure bank capital strength during both normal conditions and crises. Quarles said without knowing how the economic crisis of the past year was going to play out, the Fed was right to take the extra steps it did. But he suggested that current analyses of the economic environment show that those steps were not required. “Given the uncertainty that existed at the time, I don’t think it would have been prudent for us” not to impose restrictions, “but it underscores that doing something like this should be extraordinarily rare.” It is unclear if other Fed board members such as Chair Jerome Powell or Gov. Lael Brainard share Quarles’ view. A Trump appointee, Quarles is slated to hold his vice chair title until his term ends in October. (He can remain a Fed governor until 2032.) Some have speculated that Brainard, appointed to the Fed board in the Obama administration, could succeed Quarles as the central bank’s top supervisory official. The two Fed governors have clashed on numerous issues related to supervising large banks, with Brainard dissenting from several recent board decisions. The core of the Fed’s stress test regime is a measure known as the stress capital buffer, which was established in March 2020 in an effort to streamline the regime and consolidate several requirements. Under the new system, each bank subject to the Comprehensive Capital Analysis and Review has to meet a unique benchmark based on its performance of how much capital to hold in the following year to combat stress. But the Fed created the accompanying “sensitivity analyses” out of concern that the economic scenarios developed before COVID-19 started spreading were outdated once the pandemic was in full force. Quarles suggested it is now evident that the regular stress tests would have been sufficient to ensure banks had enough capital. He said deviating from the normal regime should be reserved for more dire circumstances.
Banks’ economic outlook improving, but lending remains sluggish – The latest earnings snapshot for the banking industry suggests that while institutions are upbeat about the economy, they remain cautious about lending. A significant reduction in loan-loss expenses boosted net income last quarter as dire economic predictions about the pandemic did not come to pass, the Federal Deposit Insurance Corp. said in the Quarterly Banking Profile. Loan-loss provisions in the fourth quarter dropped sharply by over 76% from a year earlier to $3.5 billion, which was the lowest total since the second quarter of 1995, the FDIC report said Tuesday. The decline signaled a reversal in banks’ economic outlook from earlier in the year, when many feared a direct hit to credit quality resulting from COVID-19. Loan-loss provisions had exceeded $60 billion in the second quarter. Yet while many banks have a better outlook about 2021, the agency said the vast majority of banks nonetheless reported higher provisions. “The decline in provisions for credit losses was not broad-based, as less than one-third … of all banks reported year-over-year declines,” the agency said in the QBP. Meanwhile, lending continued to cool down in the final months of 2020. Though the 0.4% decline in total loans last quarter was driven in part by a 17% drop in Paycheck Protection Program loans, the annual loan growth rate of 3.3% was the lowest since the fourth quarter of 2013. Still, quarterly net income grew 9% from a year earlier to $59.9 billion, helped by a 6.5% increase in noninterest income from a year earlier. “Fourth-quarter net income rose, primarily due to lower provision expenses for credit losses and higher noninterest income,” FDIC Chair Jelena McWilliams said in remarks accompanying the report, though she added that “banks reported modest declines in asset quality and loan volume.” The agency said banks using the current expected credit losses accounting standard, or CECL, reported an 88.9% drop in loan-loss provisions in the fourth quarter, or a decline of $11.2 billion. Those institutions account for most of the industry’s assets. “They hold the vast amount of assets in the industry – like 82% of the assets, so they’re driving the results,” said Diane Ellis, director of insurance and research at the FDIC. “They’re looking out over a longer time horizon, and changes in macroeconomic outlook definitely contribute to that activity.” In spite of the industry’s profit gains, the FDIC reported the second consecutive quarterly decline in loan balances, which totaled over $10.8 trillion. The drop was driven by a decline in commercial and industrial lending, which fell by 4.1%, or $103.8 billion, compared with the previous quarter. In contrast, total loans had risen sharply in the first quarter, growing by over 4%. Annual loan growth was driven by a roughly 11% increase in commercial and industrial lending, though the agency stressed that that growth was concentrated “primarily in the first half of 2020.” The industry’s full-year net income totaled $147.9 billion dollars in 2020, a drop of more than 36% from the previous year. According to the FDIC, that decline was “primarily attributable to higher provision expenses in the first half of 2020 tied to pandemic-related deterioration in economic activity.”
FDIC: Problem Banks Unchanged, Residential REO Declined in Q4 – The FDIC released the Quarterly Banking Profile for Q4 2020 today: For the commercial banks and savings institutions insured by the Federal Deposit Insurance Corporation (FDIC), aggregate net income totaled $59.9 billion in fourth quarter 2020, an increase of $5 billion (9.1 percent) from a year ago. The improvement in quarterly net income was led by a reduction in provision expenses. Financial results for fourth quarter 2020 are included in the FDIC’s latest Quarterly Banking Profile released today. … The Deposit Insurance Fund’s Reserve Ratio Declined from the Previous Quarter to 1.29 Percent: The Deposit Insurance Fund totaled $117.9 billion in the fourth quarter, up $1.5 billion from the third quarter. The quarterly increase was led by assessment revenue and interest earned on investment securities held by the fund. The reserve ratio declined by 1 basis point from the previous quarter to 1.29 percent solely as a result of strong estimated insured deposit growth.Mergers and New Bank Openings Continued in the Fourth Quarter: During the fourth quarter, three new banks opened, 31 institutions were absorbed through mergers, and two banks failed. 5,001 commercial banks and savings institutions filed fourth quarter Call Reports and are insured by the Federal Deposit Insurance Corporation (FDIC) as of December 31, 2020. … The number of institutions on the FDIC’s “Problem Bank List” remained unchanged from the previous quarter at 56. Total assets of problem banks increased from $53.9 billion in third quarter 2020 to $55.8 billion in fourth quarter 2020.The FDIC reported the number of problem banks was unchanged.This graph from the FDIC shows the number of problem banks was unchanged at 56 institutions. Note: The number of assets for problem banks increased significantly back in 2018 when Deutsche Bank Trust Company Americas was added to the list (it must still be on the list given the assets of problem banks). The dollar value of 1-4 family residential Real Estate Owned (REOs, foreclosure houses) declined from $2.27 billion in Q4 2019 to $1.11 billion in Q4 2020. This is the lowest level of REOs in many years. (probably declined sharply due to foreclosure moratoriums and forbearance programs). This graph shows the nominal dollar value of Residential REO for FDIC insured institutions. Note: The FDIC reports the dollar value and not the total number of REOs.
Bankers plead for answers from SBA on forgiving big PPP loans – Large Paycheck Protection Program loans remain in limbo as the Small Business Administration takes its time reviewing borrowers’ applications. Though the SBA has forgiven more than 30% of the 5.1 million PPP loans it approved last year, many lenders who originated loans of $2 million or more are still waiting to hear back from the agency months after their borrowers submitted paperwork. For bankers, the wait is delaying the payout of origination fees for the loans. And it could cause big headaches for borrowers as they look to finalize their latest financial statements, bankers said. The “SBA asked for an awful lot of information” from businesses that borrowed large amounts, said Ted Sheppe, executive vice president of commercial banking at the $675 million-asset Axiom Bank in Maitland, Fla. “The information is supplied, then it just kind of goes dark for three or four months,” Sheppe added. “That has some customers a little spooked. … We just don’t have an answer for them. That’s frustrating.” Lenders have originated more than 29,000 loans of $2 million or more under the PPP, accounting for just 0.4% of total loans. But they make up 16% of the $651 billion in funds approved by the SBA. Bankers aren’t surprised the SBA is giving large loans extra scrutiny given the controversy during the PPP’s earliest days when large businesses and publicly traded companies were approved for funds. The SBA and Treasury Department, which are administering the program, issued a statement on April 28 pledging to review all loans that exceeded $2 million. The SBA in November unveiled a nine-page questionnaire for PPP borrowers who took out loans that big. But lenders are frustrated by the radio silence from the SBA and Treasury on the status of the loans or what could be holding forgiveness up.
White House will give small firms two-week exclusive PPP access – The Biden administration will give exclusive access to the Paycheck Protection Program to the nation’s smallest businesses for two weeks as part of a broader effort to steer federal aid to the most vulnerable parts of the economy. From Feb. 24 through March 9, only businesses with fewer than 20 employees will be able to apply for relief through the program, a senior administration official said. The window is aimed at helping smaller companies, which often struggle more than larger businesses to secure funding from lenders, the official said. The program is set to expire on March 31. President Joe Biden is expected announce a series of moves Monday aimed at improving access to the Paycheck Protection Program.BloombergThe measure is part of a series of moves the administration is announcing Monday aimed at improving access to the federal program for hard-hit businesses and other groups. The White House said it will also recalculate a funding formula to make more money available to sole proprietors, independent contractors and the self-employed, who’d struggled to access the program, as well as remove restrictions that had prevented non-U.S. citizens and convicted felons from accessing the aid. The PPP, created as part of the $2.2 trillion coronavirus relief package enacted in March, has faced criticism – especially for excluding minority-owned and the smallest firms. The Small Business Administration had approved 5.2 million loans worth $525 billion when the program closed in August. In December, Congress approved another $284 billion for the program when it reopened Jan. 11 and made changes aimed at making it more accessible to minorities. First-time applicants to the program can get their loans forgiven if they have fewer than 500 employees and use the money for approved costs, like payroll and rent. Companies can apply for a second forgivable loan if they have 300 or fewer employees and can show a 25% drop in revenue. The SBA approved almost 1.7 million loans worth $125.8 billion through Feb. 15, according to an agency report. The pace picked up after a slow start following the program’s reopening. The average loan size was $75,133, with first-draw loans being much smaller on average, the data showed. First-time business applicants received an average loan of $21,675, while second-time recipients got an average of $97,974. This round of PPP lending got off to a slow start as lenders and applicants had just days to update their systems and paperwork between when the SBA released the updated forms and began accepting applications. Businesses applying through community lenders, such as a community development financial institution, had exclusive access to apply for PPP money for one week when the system opened in January. However, the gesture was largely seen as ineffective because few lenders and businesses were prepared to submit applications that quickly.
Biden plan to help smallest PPP applicants has downsides, banks warn – The Biden administration’s push to channel more Paycheck Protection Program funding to small businesses with 20 employees or fewer is winning qualified support from lenders. The moves are well intended and will have some positive effects, but they’ll also come with downsides, bankers and industry representatives warned. One of the key steps announced Monday, an exclusive 14-day application window for 20-employee-or-fewer firms, will delay loans, including many already in the works, to larger borrowers, some PPP lenders said. Another major element of the proposal – a softening of the formula used to calculate the amount of credit that may be extended to sole proprietors, independent contractors and self-employed borrowers – will take time to implement. It also raises questions about whether borrowers in these categories who have already received PPP loans can seek to have their payouts recalculated under the new, more favorable formula. “Are they eligible then for increases after the fact?” asked Alison Holt-Fuller, head of product and enterprise first-line risk management at the $20 billion-asset Atlantic Union Bankshares in Richmond, Va. “With the current program expiration date of March 31st, there isn’t a lot of time to adjust processes that many, us included, tried to automate as much as possible,” Holt-Fuller said. The changes, which take effect Wednesday, “are going to slow us down some,” said Sam Sidhu, vice chairman and chief operating officer at the $18.4 billion-asset Customers Bancorp in West Reading, Pa. “Two days is not enough time to get geared up. … We’ll be up all night the next two days getting ready.” While the changes should make obtaining PPP loans “somewhat easier” for smaller firms, moving them to the front of the line without addressing persistent technical problems involving the Small Business Administration’s processing of applications may not help as much as business owners hope, Consumer Bankers Association President and CEO Richard Hunt said in a press release. “It is like giving everyone a train ticket on an unfinished railroad,” Hunt said. After the SBA announced a more stringent review process to combat fraud and loans to ineligible businesses earlier this year, bankers began to complain that the PPP loans they uploaded to the agency were hit with error codes that were resolved only after a great deal of time and effort. “We remain hopeful that as this program enters its final weeks, SBA will work with lenders in addressing the many administrative issues that are still hindering some small businesses from fully utilizing the program,” American Bankers Association President and CEO Rob Nichols said in a press release. Small-business advocates were more enthusiastic about the administration’s new course. Any modifications designed to ease their access to PPP is virtually certain to delight smaller borrowers, including minority-run businesses, many of whom complained about being left on the sidelines during the program’s first phase last year. “There were a lot of businesses whose bankers were calling them to get them to apply for PPP,” Phil Andrews, president of the Long Island African American Chamber of Commerce, said last week in an interview. “On our end, we had people calling us saying they don’t have a bank to go to, they don’t have a banking relationship.”
FHFA announces further extension of COVID-related mortgage relief — The Federal Housing Finance Agency is providing an additional three months of forbearance to borrowers with loans backed by Fannie Mae and Freddie Mac, totaling 18 months of relief due to the coronavirus pandemic. The FHFA said Thursday that it was aligning its policies with the Biden administration to address economic burdens for homeowners due to COVID-19. The change comes nearly three weeks after the agency extended the total forbearance period to 15 months. When Congress passed the Coronavirus Aid, Relief and Economic Security Act last year, it allowed borrowers with federally backed mortgages to request up to 12 months of forbearance – divided into two 180-day increments – if they experienced financial hardship. In forbearance, a borrower is allowed to suspend payments by extending the loan’s terms. There is no set cutoff date for the 18-month forbearance period because borrowers have entered and exited forbearance at different times. The FHFA also said Thursday that it was extending a moratorium on foreclosures and real estate-owned evictions until June 30 for loans backed by Fannie and Freddie. Because housing prices have jumped dramatically, borrowers are more likely to be able to sell their homes than go into foreclosure than in financial crisis in 2008, when many were underwater on their mortgages. The foreclosure moratorium had been set to expire on March 31, but the FHFA is offering another three-month extension only for single-family mortgages backed by the government-sponsored enterprises. The REO eviction moratorium applies to properties acquired by the GSEs through foreclosures or deed-in-lieu transactions. Earlier this month, the Biden administration announced similar extensions of relief for loans backed by the Federal Housing Administration, Department of Veterans Affairs and Department of Agriculture. “Today’s extensions of the COVID-19 forbearance period to 18 months and foreclosure and eviction moratoriums through the end of June will help align mortgage policies across the federal government,” FHFA Director Mark Calabria said in a press release. “Borrowers and the housing finance market alike can benefit during the pandemic from the consistent treatment of mortgages regardless of who owns or backs them.” Roughly 2.6 million homeowners were in forbearance plans as of Feb. 14, representing 5.29% of loans serviced, the Mortgage Bankers Association said Monday.
Fannie Mae: Mortgage Serious Delinquency Rate Decreased in January -Fannie Mae reported that the Single-Family Serious Delinquency decreased to 2.80% in January, from 2.87% in December. The serious delinquency rate is up from 0.66% in January 2020.These are mortgage loans that are “three monthly payments or more past due or in foreclosure”. The Fannie Mae serious delinquency rate peaked in February 2010 at 5.59% following the housing bubble, and peaked at 3.32% in August 2020 during the pandemic. By vintage, for loans made in 2004 or earlier (2% of portfolio), 5.87% are seriously delinquent (down from 5.88% in December). For loans made in 2005 through 2008 (2% of portfolio), 9.98% are seriously delinquent (unchanged from 9.98%), For recent loans, originated in 2009 through 2018 (96% of portfolio), 2.32% are seriously delinquent (down from 2.39%). So Fannie isstill working through a few poor performing loans from the bubble years.Mortgages in forbearance are counted as delinquent in this monthly report, but they will not be reported to the credit bureaus.This is very different from the increase in delinquencies following the housing bubble. Lending standards have been fairly solid over the last decade, and most of these homeowners have equity in their homes – and they will be able to restructure their loans once they are employed.
Freddie Mac: Mortgage Serious Delinquency Rate decreased in January – — Freddie Mac reported that the Single-Family serious delinquency rate in January was 2.56%, down from 2.64% in December. Freddie’s rate is up from 0.60% in January 2020. Freddie’s serious delinquency rate peaked in February 2010 at 4.20% following the housing bubble, and peaked at 3.17% in August 2020 during the pandemic. These are mortgage loans that are “three monthly payments or more past due or in foreclosure”.Mortgages in forbearance are being counted as delinquent in this monthly report, but they will not be reported to the credit bureaus. This is very different from the increase in delinquencies following the housing bubble. Lending standards have been fairly solid over the last decade, and most of these homeowners have equity in their homes – and they will be able to restructure their loans once (if) they are employed. Also – for multifamily – delinquencies were at 0.16%, unchanged from 0.16% in December, and up double from 0.08% in January 2020.
Black Knight: National Mortgage Delinquency Rate Decreased in January –Note: Loans in forbearance are counted as delinquent in this survey, but those loans are not reported as delinquent to the credit bureaus. From Black Knight: Black Knight’s First Look: Mortgage Delinquency Rate Falls Below 6% for First Time in Nearly a Year, Yet 2.1M Homeowners Remain Seriously Delinquent
The national mortgage delinquency rate fell to 5.9% in January, dropping below 6% for the first time since March 2020
January’s improvement among overall delinquencies as well as seriously past due mortgages was nearly identical to the average monthly improvement seen during the recovery to date
While delinquencies continue to improve slowly and steadily, some 2.1 million homeowners remain 90 or more days past due but not yet in foreclosure – still five times pre-pandemic levels
Recent forbearance and foreclosure moratorium extensions have reduced near-term risk, but at the same time may have the effect of extending the length of the recovery period
At the current rate of improvement, 1.8 million mortgages will still be seriously delinquent at the end of June when foreclosure moratoriums on government-backed loans are currently slated to lift
With widespread moratoriums still in place, both foreclosure starts and sales (completions) remained near record lows in January
Prepayment activity fell by 17% month-over-month in January but remains 86% above last year’s levels
emphasis added
According to Black Knight’s First Look report, the percent of loans delinquent decreased 3.8% in January compared to December, and increased 82% year-over-year. The percent of loans in the foreclosure process decreased 3.9% in December and were down 31% over the last year. Black Knight reported the U.S. mortgage delinquency rate (loans 30 or more days past due, but not in foreclosure) was 5.85% in January, down from 6.08% in December. The percent of loans in the foreclosure process decreased in January to 0.32%, from 0.33% in December.The number of delinquent properties, but not in foreclosure, is up 1,425,000 properties year-over-year, and the number of properties in the foreclosure process is down 75,000 properties year-over-year.
MBA Survey: “Share of Mortgage Loans in Forbearance Declines to 5.22%” Note: This is as of February 14th. From the MBA: Share of Mortgage Loans in Forbearance Declines to 5.22%:The Mortgage Bankers Association’s (MBA) latest Forbearance and Call Volume Survey revealed that the total number of loans now in forbearance decreased by 7 basis po ints from 5.29% of servicers’ portfolio volume in the prior week to 5.22% as of February 14, 2021. According to MBA’s estimate, 2.6 million homeowners are in forbearance plans….”The share of loans in forbearance has declined for three weeks in a row, with portfolio and PLS loans decreasing the most this week. This decline was due to a sharp increase in borrower exits, particularly for IMB servicers,” said Mike Fratantoni, MBA’s Senior Vice President and Chief Economist. “Requests for new forbearances dropped to 6 basis points, matching a survey low.” Fratantoni added, “The housing market is quite strong, with home sales, home construction, and home price data all testifying to this strength. Policymakers and the mortgage industry have helped enable this during the pandemic by providing millions of homeowners support in the form of forbearance. The decision to extend the allowable duration of forbearance plans should provide for a smoother transition this year as the job market continues to recover.” This graph shows the percent of portfolio in forbearance by investor type over time. Most of the increase was in late March and early April, then trended down – and has mostly moved slowly down recently.The MBA notes: “Total weekly forbearance requests as a percent of servicing portfolio volume (#) decreased relative to the prior week: from 0.07% to 0.06%.”
Black Knight: Number of Homeowners in COVID-19-Related Forbearance Plans Increased Slightly Note: Both Black Knight and the MBA (Mortgage Bankers Association) are putting out weekly estimates of mortgages in forbearance. This data is as of February 23rd.From Black Knight“The number of mortgages in active forbearance rose for the second week in a row, climbing by by 21K (+0.08) since last Tuesday, pushing the total back up above 2.7M after falling below that threshold for the first time since last April earlier this month. This week’s rise continues the trend of mid-month increases we’ve grown accustomed to seeing since the recovery began.Despite the weekly increase, the monthly rate of decline held steady at -2%, continuing the trend of very slow but steady improvement in the number of outstanding forbearance cases. Remember: monthly declines have been averaging less than 2% since early December.According our McDash Flash daily mortgage performance data set, as of February 23, 2.7M homeowners – 5.1% of all mortgage-holders – remain in active forbearance. This includes 9.3% of FHA/VA, 3.2% of GSE and 5.2% of portfolio/private mortgages” “Once again, portfolio held and privately securitized loans saw the largest increase in plans (+16K / +2.4%), followed FHA/VA loans, which saw active forbearance plans rise by 7K (+0.6%). As was the case last week, GSE loans were the only cohort to see any sort of decline (-2K; -0.2%). Some 160K forbearance plans are set to hit scheduled expiration points at the end of February.”The number of loans in forbearance has declined slightly over the last few months.
Eviction Moratorium Deemed Unconstitutional by Federal Judge in Texas – Yves Smith – Judge J. Campbell Barker of the Eastern District of Texas, sided with plaintiffs who challenged the CDC’s eviction moratorium on Constitutional grounds. We’ve embedded the opinion for Terkel v. Centers for Disease Control and Prevention at the end of this post. Even though some will be inclined to dismiss the ruling as politically-motivated (Barker was a Trump nominee), recall that it was the Trump Administration that first launched the eviction freeze. It initially ran through December 31, and covered tenants who gave their landlord a declaration attesting that the made less than $100,000 a year, had suffered a large hit to their income, were seeking assistance and would pay as much rent as they could. The Biden Administration planned to extend the moratorium to the end of March. Bear in mind that the eviction halt dumped the cost of keeping coronavirus-whacked workers housed on landlords, rather than having the government provide income or rental subsidies. Before we turn to the reasoning of the ruling, keep in mind that Judge Barker did not issue an injunction against the CDC’s moratorium, since the CDC apparently made noises at trial that they’d withdraw the moratorium if they lost. However, Barker told the plaintiffs they could come back and seek an injunction if the CDC didn’t play nice. There is no indication yet as to whether the Administration will appeal. Constitutional law is often a slippery area of jurisprudence, but this short ruling is well argued. The Administration declared that its authority to impose the moratorium resided in theCommerce Clause: “To regulate commerce with foreign nations, and among the several states, and with the Indian tribes” and the Necessary and Proper Clause. The obstacle for the defendants is that the Commerce Clause has been found to cover interstate commerce, and instrastate commerce to the extent that it also impacts interstate commerce. For instance, in 2005, in Gonzales v. Raich, the Supreme Court upheld Federal regulation of within-state marijuana production, since having some states permit marijuana farming and sales would clearly lead to sales in neighboring states. The government was only able to make general claims, of the sort that “reducing homelessness will keep people out of shelters, which can spread Covid” and “15% of the people who change residence go across state lines.” Judge Barker retorted that public health falls under state and local policing powers, so the arguments about shelters or other health hazards didn’t establish Federal authority. On top of that, the CDC order was not devised to limit disease spread to other states:
As Wall Street Migrates to Florida, Hedge-Funders Move to Offload Manhattan Homes – WSJ — Three Manhattan listings – a downtown penthouse asking $39.5 million, a sprawling co-op seeking $40 million and a pair of Upper West Side condos on the market for $25 million – share one thing in common. Their sellers are among the top brass at Elliott Management, a hedge fund that announced last year it is moving its headquarters from New York City to Florida. Real-estate veterans and hedge-fund executives believe a seismic shift is under way, one that is moving vast amounts of Wall Street wealth from New York to South Florida. For the past several years, Wall Street has been colonizing the Sunshine State, attracted to more favorable tax policies and sunnier climes. And the momentum is only accelerating amid the pandemic. David S. Goodboy, founder of the Palm Beach Hedge Fund Association, a networking organization for finance professionals in South Florida, said he saw his base of paying members almost triple in the past year. When he scheduled an in-person networking event in January at the West Palm Beach home of one of the organization’s wealthy members in January, he said he was shocked to get 300 RSVPs.”It’s gone into overdrive,” he said. “There was always a migration, but Covid gave people a reason just beyond just taxes. It pushed them over the edge.” At the same time, some wealthy financiers are trying to unload their homes back in New York. Moves by high-net worth financiers are closely watched, particularly in light of predictions of a looming budget crisis in New York. The fate of the new listings may also be a bellwether for the Manhattan luxury market, which got hammered by Covid-19 in 2020 but has begun to show some signs of life in the past several months. “If you think of New York City as a ballet, right now the city is at intermission,” said real-estate agent Jason Haber at Warburg Realty. “During intermission, some people get restless and don’t come back for the next act. That’s what’s happening now.” One of those listings is at the Four Seasons Residences at 30 Park Place, a slim tower in the Financial District that was designed by Robert A.M. Stern Architects. Asking $39.5 million, it is owned by Jesse Cohn, a partner at Elliott who as head of its U.S. activism practice has led campaigns at Twitter and AT&T.Over 6,000 square feet with five bedrooms, the property has panoramic views of the downtown skyline, according to the listing posted by Leonard Steinberg of real-estate brokerage Compass. The interiors include terrazzo and hardwood flooring, custom limestone plaster walls, a fireplace clad in rounded marble slabs that extend to the ceiling and an office fit for a master of the universe, with a crescent-shaped desk framed by a large window. Mr. Cohn, who is in his early 40s, bought the apartment in 2017 for $30 million, records show, and the listing shows it has since been renovated. Mr. Cohn plans to live near Elliott’s new West Palm Beach headquarters, people familiar with the matter said.
FHFA House Price Index: Up 1.1% in December –The Federal Housing Finance Agency (FHFA) has released its U.S. House Price Index (HPI) for December. Here is the opening of the press release: U.S. house prices rose 10.8 percent from the fourth quarter of 2019 to the fourth quarter of 2020 according to the Federal Housing Finance Agency House Price Index (FHFA HPI). House prices were up 3.8 percent compared to the third quarter of 2020. FHFA’s seasonally adjusted monthly index for December was up 1.1 percent from November.“House prices nationwide recorded the largest annual and quarterly increase in the history of the FHFA HPI,” said Dr. Lynn Fisher, Deputy Director of FHFA’s Division of Research and Statistics.“Low mortgage rates, pent up demand from homebuyers, and a limited housing supply propelled every region of the country to experience faster growth in 2020 compared to a year ago despite the pandemic. In particular, house prices in western states and cities saw the highest rates of growth, where annual gains often rose above 10 percent.” The chart below illustrates the monthly HPI series, which is not adjusted for inflation, along with a real (inflation-adjusted) series using the Consumer Price Index: All Items Less Shelter. The Federal Housing Finance Agency (FHFA) has released its U.S. House Price Index (HPI) for December. U.S. house prices were up 1.1 percent on a seasonally adjusted nominal basis from the previous month. Year-over-year the index is up 11.4% on a non-seasonally adjusted nominal basis. After adjusting for inflation and seasonality, the index is up 0.82% in December and up 10.22% year-over-year (seasonally adjusted).
U.S. Home-Price Growth Accelerated in December – WSJ –Home-price growth accelerated in December, as the number of homes on the market continued to decline. The S&P CoreLogic Case-Shiller National Home Price Index, which measures average home prices in major metropolitan areas across the nation, rose 10.4% in the year that ended in December, up from a 9.5% annual rate the prior month. December marked the highest annual rate of price growth since January 2014. House-buying demand has surged in recent months, driven by record-low interest rates. Sales of previously owned homes, which make up the bulk of the housing market, rose in 2020 to their highest annual level since 2006, according to the National Association of Realtors. The supply of homes for sale has dropped, prompting buyers to compete for houses and buoying prices. There were 1.07 million homes for sale at the end of December, down 23% from December 2019, according to NAR. The Case-Shiller 10-city index gained 9.8% over the year ended in December, compared with an 8.9% increase in November. The 20-city index rose 10.1%, after an annual gain of 9.2% in November. “With buyer interest leading to an unseasonably competitive landscape … home prices remain on a steep upward trend,” said George Ratiu, senior economist at Realtor.com. News Corp, parent of The Wall Street Journal, operates Realtor.com. The U.S. mortgage market involves some key players that play important roles in the process. Here’s what investors should understand and what risks they take when investing in the industry. WSJ’s Telis Demos explains. Photo: Getty Images/Martin Barraud Economists surveyed by The Wall Street Journal expected the 20-city index to gain 9.9%. The 20-city index measured 19 cities in December due to transaction reporting delays in Wayne County, Mich., according to S&P Dow Jones Indices. Price growth accelerated in 18 of the 19 cities. Phoenix had the fastest home-price growth in the country for the 19th straight month, at 14.4%, followed by Seattle at 13.6%. A separate measure of home-price growth by the Federal Housing Finance Agency also released Tuesday found an 11.4% increase in home prices in December from a year earlier.
Case-Shiller: National House Price Index increased 10.4% year-over-year in December S&P/Case-Shiller released the monthly Home Price Indices for December (“December” is a 3 month average of October, November and December prices). This release includes prices for 20 individual cities, two composite indices (for 10 cities and 20 cities) and the monthly National index.From S&P: S&P Corelogic Case-Shiller Index Reports 10.4% Annual Home Price Gain to End 2020 The S&P CoreLogic Case-Shiller U.S. National Home Price NSA Index, covering all nine U.S. census divisions, reported a 10.4% annual gain in December, up from 9.5% in the previous month. The 10-City Composite annual increase came in at 9.8%, up from 8.9% in the previous month. The 20-City Composite posted a 10.1% year-over-year gain, up from 9.2% in the previous month.Phoenix, Seattle, and San Diego continued to report the highest year-over-year gains among the 19 cities (excluding Detroit) in December. Phoenix led the way with a 14.4% year-over-year price increase, followed by Seattle with a 13.6% increase and San Diego with a 13.0% increase. Eighteen of the 19 cities reported higher price increases in the year ending December 2020 versus the year ending November 2020….Before seasonal adjustment, the U.S. National Index posted a 0.9% month-over-month increase, while the 10-City and 20-City Composites both posted increases of 0.9% and 0.8% respectively in December. After seasonal adjustment, the U.S. National Index posted a month-over-month increase of 1.3%, while the 10-City and 20-City Composites both posted increases of 1.2% and 1.3% respectively. In December, 18 cities (excluding Detroit) reported increases before seasonal adjustment, while all 19 cities reported increases after seasonal adjustment.”Home prices finished 2020 with double-digit gains, as the National Composite Index rose by 10.4% compared to year-ago levels,” “The trend of accelerating prices that began in June 2020 has now reached its seventh month and is also reflected in the 10- and 20-City Composites (up 9.8% and 10.1%, respectively). The market’s strength continues to be broadly-based: 18 of the 19 cities for which we have December data rose, and 18 cities gained more in the 12 months ended in December than they had gained in the 12 months ended in November.
Zillow Case-Shiller House Price Forecast: “More strong growth in the months ahead”, 10.9% YoY in January — The Case-Shiller house price indexes for December were released today. Zillow forecasts Case-Shiller a month early, and I like to check the Zillow forecasts since they have been pretty close. From Matthew Speakman at Zillow: December 2020 Case-Shiller Results & January Forecast: An Exclamation Point on 2020: Adding an exclamation point to a year unlike any other, home prices continued their powerful surge higher in December, setting the stage for more strong growth in the months ahead….The factors that have, for months, stoked competition for homes remained firmly in place in December. A wave of eager buyers – many of whom are looking to enter the market for the first time – sought to capitalize on record-low mortgage rates and snap up the relatively few homes available for sale, leading homes to fly off the shelves and prices to continue to grow. In some major markets, homes are going under contract more than a month faster than they were this time last year. This forces would-be buyers to move very quickly to put an offer in on a home they desire, increases the likelihood that multiple offers will be fielded by the seller and ultimately places more upward pressure on prices. Looking ahead, with mortgage rates remaining relatively low and the wave of eager buyers continuing to swell, it’s unlikely that this competition for housing, and subsequent strong price appreciation, will meaningfully abate in the near future.Monthly growth in January as reported by Case-Shiller is expected to slow slightly from December in all three main indices, while annual growth is expected to accelerate across the board. S&P Dow Jones Indices is expected to release data for the January S&P CoreLogic Case-Shiller Indices on Tuesday, March 30. The Zillow forecast is for the year-over-year change for the Case-Shiller National index to be at 10.9% in January, up from 10.4% in December.The Zillow forecast is for the 20-City index to be up 10.7% YoY in January from 10.1% in December, and for the 10-City index to increase to be up 10.4% YoY compared to 9.8% YoY in December.
New Home Sales increase to 923,000 Annual Rate in January — The Census Bureau reports New Home Sales in January were at a seasonally adjusted annual rate (SAAR) of 923 thousand. The previous three months were revised up. Sales of new single-family houses in January 2021 were at a seasonally adjusted annual rate of 923,000, according to estimates released jointly today by the U.S. Census Bureau and the Department of Housing and Urban Development. This is 4.3 percent above the revised December rate of 885,000 and is 19.3 percent above the January 2020 estimate of 774,000.The first graph shows New Home Sales vs. recessions since 1963. The dashed line is the current sales rate.The last eight months saw the highest sales rates since 2006. This was strong year-over-year growth.The second graph shows New Home Months of Supply.The months of supply decreased in January to 4.0 months from 4.1 months in December.The all time record high was 12.1 months of supply in January 2009. The all time record low is 3.5 months, most recently in October 2020.This is at the low end of the normal range (about 4 to 6 months supply is normal).”The seasonally-adjusted estimate of new houses for sale at the end of January was 307,000. This represents a supply of 4.0 months at the current sales rate. “Starting in 1973 the Census Bureau broke inventory down into three categories: Not Started, Under Construction, and Completed.The third graph shows the three categories of inventory starting in 1973.The inventory of completed homes for sale is low, and the combined total of completed and under construction is a little lower than normal.The last graph shows sales NSA (monthly sales, not seasonally adjusted annual rate).In January 2021 (red column), 70 thousand new homes were sold (NSA). Last year, 59 thousand homes were sold in JanuaryThe all time high for January was 92 thousand in 2005, and the all time low for January was 21 thousand in 2011.This was well above expectations, and sales in the three previous months were revised up.
A few Comments on January New Home Sales – McBride — New home sales for January were reported at 923,000 on a seasonally adjusted annual rate basis (SAAR). Sales for the previous three months were revised up. This was well above consensus expectations for January. Clearly low mortgages rates, low existing home supply, and favorable demographics (something I wrote about many times over the last decade) have boosted sales. A surging stock market has probably helped new home sales too. Another factor in the strong headline sales rate, over the second half of 2020, was the delay in the selling season. Usually the strongest sales are in the March to June time frame, but last year the strongest sales months were later in the year – so the usual seasonal factors boosted sales in late Summer, Fall in 2020. Earlier: New Home Sales increase to 923,000 Annual Rate in January. This graph shows new home sales for 2020 and 2021 by month (Seasonally Adjusted Annual Rate). The year-over-year comparisons are easy in early 2021 – especially in March and April. However, sales will likely be down year-over-year in August through October – since the selling season was delayed in 2020. And on inventory: note that completed inventory is near record lows, but inventory under construction has closer to normal. On inventory, according to the Census Bureau:“A house is considered for sale when a permit to build has been issued in permit-issuing places or work has begun on the footings or foundation in nonpermit areas and a sales contract has not been signed nor a deposit accepted.”Starting in 1973 the Census Bureau broke this down into three categories: Not Started, Under Construction, and Completed.This graph shows the months of supply by stage of construction..The inventory of completed homes for sale was at 42 thousand in January, just above the record low of 37 thousand in 2013. That is about 0.5 months of completed supply. The inventory of new homes under construction, and not started, is about 3.5 months – just a little below normal.
New home sales rise m/m, but signal caution for housing market going forward -New home sales increased to a three month annualized high of 923,000 in January. This is of a piece with the positive news last week on housing permits. At the same time, the pace remains below the recent high of 979,000 annualized set six months ago in July. The below graph compares housing starts (blue) with the much less volatile single family permits (red) and the even more volatile, and heavily revised, new home sales (gold), normalized to 100 as of January 2020: The reason to pay attention to new home sales is that, despite their volatility, they tend to peak and bottom before any other housing metric including permits and starts. So the fact that they have not made a new high in 6 months adds a note of caution to the otherwise sizzling housing market.New home sales also tend to be more responsive to changes in mortgage rates. Recently these have begun to increase, following longer term US treasury rates (shown inverted YoY% change) higher:Note that in 2014, when mortgage rates rose by about 1%, permits never declined significantly YoY. But new home sales did. If interest rates plateau, or continue to rise, this is the first yellow flag that permits and starts may stall as well – and, based on historical trends, will do so while home prices are still rising.
NAR: Pending Home Sales Decrease 2.8% in January – From the NAR: Pending Home Sales Retreat 2.8% in January, but Climb From Last Year: Pending home sales took a step backward in January as inventory constraints continue to hold back prospective buyers, according to the National Association of Realtors. The South was the lone region with a modest gain from the month prior, while the other three major U.S. regions experienced month-over-month decreases in January. However, all four areas saw contract transactions increase from a year-over-year standpoint, including two regions reaching double-digit gains, spurring an all-time high for pending home sales in the month of January. The Pending Home Sales Index (PHSI), a forward-looking indicator of home sales based on contract signings, dropped 2.8% to 122.8 in January. Year-over-year, contract signings rose 13.0%. An index of 100 is equal to the level of contract activity in 2001. … The Northeast PHSI fell 7.4% to 101.6 in January, a 9.6% rise from a year ago. In the Midwest, the index declined 0.9% to 113.2 last month, up 8.6% from January 2020. Pending home sales transactions in the South inched up 0.1% to an index of 151.3 in January, up 17.1% from January 2020. The index in the West dropped 7.8% in January, to 104.6, up 11.5% from a year prior. This was well below expectations for this index. Note: Contract signings usually lead sales by about 45 to 60 days, so this would usually be for closed sales in February and March.
Housing Inventory Feb 22nd Update: At Record Lows –One of the key questions for 2021 is: Will inventory increase as the pandemic subsides, or will inventory decrease further in 2021?. Tracking inventory will be very important this year. This inventory graph is courtesy of Altos Research. As of February 19th, inventory was at 337 thousand (7 day average), compared to 723 thousand the same week a year ago. That is a decline of over 53%. A week ago, inventory was at 344 thousand, and was down 53% YoY. Seasonally inventory should bottom by early March. Mike Simonsen discusses this data regularly on Youtube.
AIA: “Architecture Billings continue to contract” in January –Note: This index is a leading indicator primarily for new Commercial Real Estate (CRE) investment.From the AIA: Architectural billings continue to contract in 2021: A slight improvement in business conditions has led to fewer architecture firms reporting declining billings, according to a new report today from The American Institute of Architects (AIA).AIA’s Architecture Billings Index (ABI) score for January was 44.9 compared to 42.3 in December (any score below 50 indicates a decline in firm billings). Last month’s score indicates overall revenue at U.S architecture firms continued to decline from December to January, however, the pace of decline slowed. Inquiries into new projects during January grew for the second month in a row, with a score of 56.8 compared to 51.7 in December. The value of new design contracts also reflected an easing in the pace of decline, rising to a score of 48.8 in January from 47.0 the previous month.”The broader economy entered a soft spot during the fourth quarter of last year, and business conditions at design firms have reflected this general slowdown,” said AIA Chief Economist, Kermit Baker, Hon. AIA, PhD. “While federal stimulus and the increasing pace of vaccinations may begin to accelerate progress in the coming months, the year has gotten off to a slow start, with architecture firms in all regions of the country and in all specializations reporting continued declines in project billings.”…
Regional averages: South (47.4); West (42.8); Midwest (42.2); Northeast (41.9)
Sector index breakdown: mixed practice (47.9); multi-family residential (44.4); commercial/industrial (44.3); institutional (39.9)
This graph shows the Architecture Billings Index since 1996. The index was at 44.9 in January, up from 42.3 in December. Anything below 50 indicates contraction in demand for architects’ services.Note: This includes commercial and industrial facilities like hotels and office buildings, multi-family residential, as well as schools, hospitals and other institutions.This index has been below 50 for eleven consecutive months. This represents a significant decrease in design services, and suggests a decline in CRE investment through most of 2021 (This usually leads CRE investment by 9 to 12 months).
Hotels: Occupancy Rate Declined 23.8% Year-over-year — From CoStar: STR: US Hotels Nearly Half Full During Week Ending Feb. 20: U.S. weekly hotel occupancy reached its highest level since late October, according to STR’s latest data through Feb. 20.
Feb. 14-20, 2021 (percentage change from comparable week in 2020):
Occupancy: 48.1% (-23.8%)
Average daily rate (ADR): US$101.57 (-22.1%)
Revenue per available room (RevPAR): US$48.82 (-40.6%)
Popular leisure markets in Florida, with leftover demand from the long holiday weekend, posted the week’s highest levels. … Additionally, displaced Texans pushed week-over-week occupancy gains across STR-defined markets in the state. Texas’ occupancy added almost a point to overall U.S. occupancy for the week. The following graph shows the seasonal pattern for the hotel occupancy rate using the four week average.
Personal Income increased 10.0% in January, Spending increased 2.4% The BEA released the Personal Income and Outlays report for January: Personal income increased $1,954.7 billion (10.0 percent) in January according to estimates released today by the Bureau of Economic Analysis. Disposable personal income (DPI) increased $1,963.2 billion (11.4 percent) and personal consumption expenditures (PCE) increased $340.9 billion (2.4 percent).Real DPI increased 11.0 percent in January and Real PCE increased 2.0 percent; goods increased 5.1 percent and services increased 0.5 percent. The PCE price index increased 0.3 percent. Excluding food and energy, the PCE price index also increased 0.3 percentThe January PCE price index increased 1.5 percent year-over-year and the January PCE price index, excluding food and energy, increased 1.5 percent year-over-year.The following graph shows real Personal Consumption Expenditures (PCE) through January 2021 (2012 dollars). Note that the y-axis doesn’t start at zero to better show the change.The dashed red lines are the quarterly levels for real PCE.Personal income was at expectations, and the increase in PCE was slightly below expectations.
January personal income and spending show how important government stimulus has been to keeping the economy afloat -This morning’s report on January personal income and spending shows just how important the stimulus packages enacted by the federal government both last spring and last month have been to sustaining the economy.After adjusting for inflation both personal income and spending rose in January, by +9.7% and +2.0%, respectively: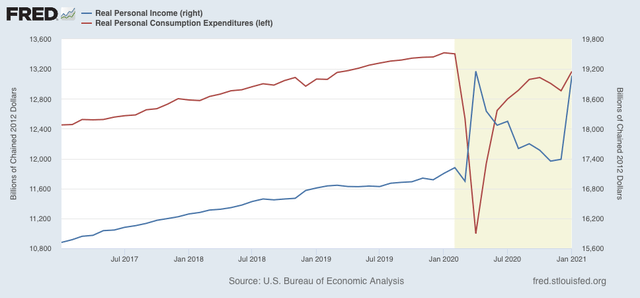 The huge increase in income is not a mistake. It follows from the renewed Congressional stimulus package providing $600 checks to most households. And it’s pretty obvious that had an impact on spending, which rose to levels equivalent to 2019 and only about 2% off peak.The importance of the stimulus is shown dramatically when we subtract government transfer receipts from the equation, shown in red in the graph below:
 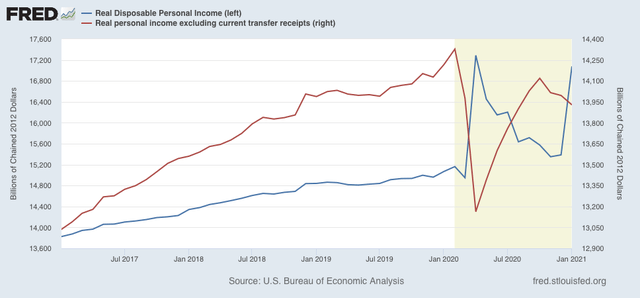 Real personal income excluding government transfer receipts fell for the third month in a row, down -0.5% in January.Since this last metric is the last of the four coincident metrics to be reported for January, we can now plot the general outline of the economy through last month, including production (blue), jobs (red), real retail sales (green), and real income (purple):Industrial production has powered through the last 9 months and is now only -1.8% below its level last February. Real sales are actually higher by 6.4%. Job growth has generally stalled in the last 3 months, but only declined outright in the month of December. But without transfer receipts from government, income is down -2.8% since last February.*IF* we continue to make good progress with vaccinations, and they prove effective against the new variants of covid-19 as well as the original virus, then by mid-year we could see production higher than before the recession, most likely leading the NBER to deflate that the recession was a brief but very deep two month affair (last March and April) with a one year+ recovery which is turning into a full-fledged expansion.
Consumer Confidence Up in February – The headline number of 91.3 was an increase from the final reading of 88.9 for January. This was above the Investing.comconsensus of 90.0.“After three months of consecutive declines in the Present Situation Index, consumers’ assessment of current conditions improved in February,” said Lynn Franco, Senior Direc tor of Economic Indicators at The Conference Board. “This course reversal suggests economic growth has not slowed further. While the Expectations Index fell marginally in February, consumers remain cautiously optimistic, on the whole, about the outlook for the coming months. Notably, vacation intentions – particularly, plans to travel outside the U.S. and via air – saw an uptick this month, and are poised to improve further as vaccination efforts expand. Read more The chart below is another attempt to evaluate the historical context for this index as a coincident indicator of the economy. Toward this end, we have highlighted recessions and included GDP. The regression through the index data shows the long-term trend and highlights the extreme volatility of this indicator. Statisticians may assign little significance to a regression through this sort of data. But the slope resembles the regression trend for real GDP shown below, and it is a more revealing gauge of relative confidence than the 1985 level of 100 that the Conference Board cites as a point of reference.
Michigan Consumer Sentiment: February Final Slightly Lower – The February Final came in at 76.8, down 2.2 from the January Final. Investing.com had forecast 76.5. Since its beginning in 1978, consumer sentiment is 10.9 percent below the average reading (arithmetic mean) and 9.9 percent below the geometric mean.Surveys of Consumers chief economist, Richard Curtin, makes the following comments:Despite a small gain in late February, consumer sentiment was slightly lower for the entire month than in January. All of February’s loss was due to households with incomes below $75,000, with the declines mainly concentrated in future economic prospects. The worst of the pandemic may be nearing its end, but few consumers anticipate the type of persistent and robust economic growth that restores employment conditions to the very positive pre-pandemic levels. The recent revival in spending has been driven by drawdowns in precautionary savings. Interestingly, those with a college degree were more cautious about prospects for the national economy until just a few months ago (see the chart). In contrast, those with less than a college degree recorded the least favorable economic prospects in this month’s survey, indicating the high cumulative toll of the pandemic. It is a common occurrence that groups that had suffered the least in a recession are the first to propel the economy forward, although it is true that those whose jobs were in the hardest hit sectors will be the slowest to fully recover.Perhaps the most attention has been garnered by rising inflationary expectations. The year ahead inflation rate was expected to be 3.3% in February, up from 3.0% last month and 2.5% in December. While consumers clearly anticipate a spurt in inflation in the year ahead, the overall evidence does not indicate the emergence of an inflationary psychology that makes the expectation of inflation a self-fulfilling prophecy. The key lesson learned from the last inflationary era is that it is easy to underestimate the strength of inflationary psychology, and correspondingly, it is easy to overestimate the ability of economic policies to bring an end to inflationary psychology. [More…] See the chart below for a long-term perspective on this widely watched indicator. Recessions and real GDP are included to help us evaluate the correlation between the Michigan Consumer Sentiment Index and the broader economy.
Consumer Demand Snaps Back. Factories Can’t Keep Up. – WSJ –U.S. manufacturers aced the shutdown of their factories and warehouses last spring in response to Covid-19. They’re botching the recovery. After carrying out an orderly retreat from assembly lines as the pandemic arrived in the U.S., many manufacturers pulled out the playbook they followed in past recessions, cutting costs and preserving cash. That left them unprepared for the sharp rebound in consumer demand that began just weeks later and never let up.Without restaurants to visit and trips to take, Americans bought out stocks of cars, appliances, furniture and power tools. Manufacturers have been trying to catch up ever since. Nearly a year since initial coronavirus lockdowns in the U.S., barbells, kitchen mixers, mattresses and webcams are still hard to find. A global shortage of semiconductors has forced many car makers to cut production in recent weeks. “Everyone was caught flat-footed,” said Jack Springer, chief executive officer of Malibu Boats Inc. The boating industry was preparing for a downturn but instead sales jumped, he said. Malibu’s orders were up by more than half last June from a year earlier and sales of recreational boats in the U.S. in 2020 were the highest in 13 years, according to the National Marine Manufacturers Association, a trade group. Consumer spending on long-lasting goods in the U.S. rose 6.4% last year but domestic production of those goods fell 8.4%, according to federal data, leading to shortages and higher prices. Supply chains typically get beaten up during recessions. As sales decline, companies draw down inventories to conserve cash instead of purchasing more parts and materials. Entire pipelines of supplies get cleaned out. When demand improves, even modestly, suppliers respond with an outsize increase in production to restock empty warehouses and assembly plants. The so-called bullwhip effect ripples all along supply chains, generating unusually large orders for suppliers that are far from end customers. This time, the bullwhip effect is even more pronounced because demand for consumer products has been extraordinarily high. At the same time, companies are placing supersize orders to compensate for the extra time it takes to procure supplies from factories and freight operators constrained by global efforts to contain the coronavirus. That’s exacerbating the strain on supply chains. .
Headline Durable Goods Orders Up 3.4% in January –The latest new orders number at 3.4% month-over-month (MoM) was better than the Investing.com 1.1% estimate. The series is up 6.3% year-over-year (YoY). If we exclude transportation, “core” durable goods was up 1.4% MoM, which was better than the Investing.com consensus of 0.7%. The core measure is up 8.5% YoY. The Advance Report on Manufacturers’ Shipments, Inventories, and Orders released today gives us a first look at the latest durable goods numbers. Here is the Bureau’s summary on new orders:New orders for manufactured durable goods in January increased $8.5 billion or 3.4 percent to $256.6 billion, the U.S. Census Bureau announced today. This increase, up nine consecutive months, followed a 1.2 percent December increase. Excluding transportation, new orders increased 1.4 percent. Excluding defense, new orders increased 2.3 percent. Transportation, up eight of the last nine months, led the increase, $6.1 billion or 7.8 percent to $85.1 billion.Download full PDFThe latest new orders number at 3.4% month-over-month (MoM) was better than the Investing.com 1.1% estimate. The series is up 6.3% year-over-year (YoY). If we exclude transportation, “core” durable goods was up 1.4% MoM, which was better than the Investing.com consensus of 0.7%. The core measure is up 8.5% YoY.Core Capital Goods New Orders (nondefense capital goods used in the production of goods or services, excluding aircraft) is an important gauge of business spending, often referred to as Core Capex. It is up 0.5% MoM and up 9.1% YoY. For a look at the big picture and an understanding of the relative size of the major components, here is an area chart of Durable Goods New Orders minus Transportation and Defense with those two components stacked on top. We’ve also included a dotted line to show the relative size of Core Capex.
February Dallas Fed Manufacturing –This morning the Dallas Fed released its Texas Manufacturing Outlook Survey for February. The latest general business activity index came in at 17.2, up 10.2 from 7 in January. All figures are seasonally adjusted.Here is an excerpt from the latest report:Texas factory activity expanded at a markedly faster pace in February, according to business executives responding to the Texas Manufacturing Outlook Survey. The production index, a key measure of state manufacturing conditions, surged 15 points to 19.9, indicating a sharp acceleration in output growth.Other measures of manufacturing activity also point to more rapid growth this month. The new orders index rose seven points to 13.0, and the growth rate of orders index rose six points to 11.6. The capacity utilization index pushed up from 9.2 to 16.5, and the shipments index edged up three points to 16.1.Perceptions of broader business conditions continued to improve in February. The general business activity index shot up 10 points to 17.2. The company outlook index held steady at 10.7, an above-average reading. Uncertainty regarding companies’ outlooks continued to rise, though the index retreated notably, from 19.3 to 8.5.Expectations regarding future manufacturing activity remained positive in February, though some key indexes weakened slightly from their January readings. The future production index ticked down from 43.7 to 40.2, but the future general business activity index moved up four points to 33.9. Most other measures of future manufacturing activity edged down but remained solidly in positive territory. Monthly data for this indicator only dates back to 2004, so it is difficult to see the full potential of this indicator without several business cycles of data. Nevertheless, it is an interesting and important regional manufacturing indicator
Richmond Fed Manufacturing: Continued Improvement in February –Fifth District manufacturing activity showed continued growth in February, according to the most recent survey from the Federal Reserve Bank of Richmond. The composite index remained at 14 in February and indicates expansion. The complete data series behind today’s Richmond Fed manufacturing report, which dates from November 1993, is available here. Here is a snapshot of the complete Richmond Fed Manufacturing Composite series.Here is an excerpt from the latest Richmond Fed manufacturing overview:Fifth District manufacturing activity continued to improve in February, according to the most recent survey from the Richmond Fed. The composite index held steady from January to February, at 14, as all three component indexes – shipments, new orders, and employment – remained firmly positive. The index for vendor lead time, which hit a 25- year-high of 39 in January, rose further to 46 in February. Firms also reported decreased inventory levels, as the index for raw materials inventories hit a series low of 8. Manufacturers were optimistic that conditions would improve in the coming months.Link to Report . Here is a somewhat closer look at the index since the turn of the century.
Kansas City Fed: Tenth District Manufacturing Activity Increased in February –From the Kansas City Fed: Tenth District Manufacturing Activity Climbed Higher The Federal Reserve Bank of Kansas City released the February Manufacturing Survey today. According to Chad Wilkerson, vice president and economist at the Federal Reserve Bank of Kansas City, the survey revealed that Tenth District manufacturing activity climbed higher in February compared to a month ago and a year ago, and expectations for future activity increased. “Regional factories reported higher activity in February,” said Wilkerson. “Most businesses reported more production and shipments, despite some difficulties due to the extreme weather events recently. However, rising materials prices and shipping delays have negatively affected 85% of firms.”The month-over-month composite index was 24 in February, up from 17 in January and 14 in December. The composite index is an average of the production, new orders, employment, supplier delivery time, and raw materials inventory indexes. Manufacturing activity growth was driven by durable goods plants, specifically by primary and fabricated metals, machinery, and transportation equipment. Month-overmonth indexes for production and employment increased at a faster pace in February and supplier delivery time rose significantly. Shipments and new orders growth was positive in February, but slower than in recent months.This was the last of the regional Fed surveys for February.Here is a graph comparing the regional Fed surveys and the ISM manufacturing index:
February Regional Fed Manufacturing Overview – Five out of the twelve Federal Reserve Regional Districts currently publish monthly data on regional manufacturing: Dallas, Kansas City, New York, Richmond, and Philadelphia.Regional manufacturing surveys are a measure of local economic health and are used as a representative for the larger national manufacturing health. They have been used as a signal for business uncertainty and economic activity as a whole. Manufacturing makes up 12% of the country’s GDP. The Chicago Fed published their Midwest Manufacturing Index from July 1996 through December of 2013.The other 6 Federal Reserve Districts do not publish manufacturing data. For these, the Federal Reserve’s Beige Book offers a short summary of each districts’ manufacturing health. Five out of the twelve Federal Reserve Regional Districts currently publish monthly data on regional manufacturing: Dallas, Kansas City, New York, Richmond, and Philadelphia. The latest average of the five for February is 18.1, up from the previous month’s 13.6. It is well below its all-time high of 25.1, set in May 2004.
Blue-Collar Jobs Boom as Covid-19 Boosts Housing, E-Commerce Demand – WSJ –The U.S.’s blue-collar workforce has begun to benefit from a strengthening job market. An Orlando, Fla.-area home builder is seeking to add four construction workers to a six-person team in the midst of soaring housing demand during the pandemic. In Atlanta, a forklift driver rakes in overtime pay because the warehouse that employs him is so busy distributing packages. A Chicago-based truck-trailer manufacturer is increasingly hosting drive-through job fairs and raising wages by up to 7% as hiring picks up across its nine production plants. Nationally, employment in residential construction, package delivery and warehousing now exceeds pre-pandemic levels. Manufacturers have steadily added back jobs after slashing payrolls last spring, though employment remains down about 5% from February 2020, according to Labor Department data. Job openings in many blue-collar occupations broke above pre-virus levels last summer and remain significantly elevated, figures from the online job site Indeed show. Strength in housing and e-commerce during the pandemic has helped propel hiring in blue-collar occupations, which were hard hit by previous recessions. Many economists and companies expect blue-collar jobs to continue growing, though at a slower pace, after the coronavirus is contained. They predict the key factors driving employer demand for blue-collar workers – a swift pickup in online orders and a buoyant housing market – will largely stay even after vaccines are widely distributed and consumers shift some of their spending from goods to services. “The demand for the workers is not going to go down,” said David Berson, chief economist at Nationwide Mutual Insurance Co. “We’re still going to need good warehousing. undefinedWe will continue to see great strength in the demand in the construction area, particularly housing.”
Weekly Initial Unemployment Claims decreased to 730,000 –The DOL reported: In the week ending February 20, the advance figure for seasonally adjusted initial claims was 730,000, a decrease of 111,000 from the previous week’s revised level. The previous week’s level was revised down by 20,000 from 861,000 to 841,000. The 4-week moving average was 807,750, a decrease of 20,500 from the previous week’s revised average. The previous week’s average was revised down by 5,000 from 833,250 to 828,250.This does not include the 451,402 initial claims for Pandemic Unemployment Assistance (PUA) that was down from 512,862 the previous week.The following graph shows the 4-week moving average of weekly claims since 1971.The dashed line on the graph is the current 4-week average. The four-week average of weekly unemployment claims decreased to 807,750.The previous week was revised down.The second graph shows seasonally adjust continued claims since 1967 (lags initial by one week). At the worst of the Great Recession, continued claims peaked at 6.635 million, but then steadily declined.Regular state continued claims decreased to 4,419,000 (SA) from 4,520,000 (SA) the previous week and will likely stay at a high level until the crisis abates.Note: There are an additional 7,518,951 receiving Pandemic Unemployment Assistance (PUA) that decreased from 7,685,857 the previous week (there are questions about these numbers). This is a special program for business owners, self-employed, independent contractors or gig workers not receiving other unemployment insurance. And an additional 5,065,890 receiving Pandemic Emergency Unemployment Compensation (PEUC) up from 4,062,189.Weekly claims were much lower than the consensus forecast, and the previous week was revised down
Initial jobless claims: it appears that the worst of the winter 2020-21 increase is behind us — Let me start off this week’s review of initial jobless claims by pre-debunking something I am sure is going to be said elsewhere: a lack of reporting in Texas did *not* appreciably skew this week’s numbers. Applying the same workaround I did for Hurricanes Sandy and Harvey, I.e., subtracting the affected State’s data from the unadjusted number, to see how much it is at variance with all the other States, shows that Texas’s underreporting due to its electricity crisis was less than 20,000 at worst in a week with little seasonal adjustment. In other words, being very generous, the “real” seasonally adjusted number of initial claims at worst probably would have been only about 30,000 higher – I.e., 760,000 – but for Texas issues. Additionally, last week’s nationwide numbers were actually revised *down* by 20,000, unlike the two prior weeks which saw very large upward revisions. With those two introductory remarks out of the way, let’s look at the data. This week, on a unadjusted basis, new jobless claims declined by 131,734 to 710,313. Seasonally adjusted claims decreased by 111,000 to 730,000. The 4 week moving average declined by 20,500 to 807,250. Here is the close up since the end of July (these numbers were in the range of 5 to 7 million at their worst in early April): The good news is that recent increases seem to have plateaued. Nevertheless both adjusted and unadjusted claims remain above their worst levels at the depths of the Great Recession. Because of the huge swings caused by the scale of the pandemic – typically claims only vary by 20,000 or less from week to week, but since the start of the pandemic, swings of 50,000 or 100,000 per week have happened as often as not, recently I began posting the YoY% change in the numbers as well, since they will be much less affected by scale. As a result, there is less noise in the numbers, and the trend can be seen more clearly: The recent elevation in new claims compared with their November lows is clear. As of this week, it also appears clear, especially in the 4 week average, that claims have plateaued. As spring begins in the warmer parts of the country, we can expect increased outdoor activity and a relative recovery in employment servicing those activities. Meanwhile continuing claims, which historically lag initial claims typically by a few weeks to several months, made new pandemic lows yet again this week. Seasonally adjusted continuing claims declined by 101,000 to 4,419,000, while the unadjusted number declined by 143,320 to 4,828,027: I had suspected that we would see an upward reversal, but obviously that did not happen. Continued claims remain at levels last seen in autumn 2009, only a few months after the Great Recession. I continue to expect that the onset of better weather in spring (fewer indoor activities) and more vaccinations will mean that we have finally put the worst of the job losses behind us.
Economic pain from pandemic upends the lives of restaurant owners, entertainers (Reuters) – The reality has not yet sunk in for Pepe Diaz that the beloved deli he ran with his brother for more than 30 years is permanently shut. “The camaraderie with all the students and the regular customers, I miss all that,” he said, outside Howard Deli in Washington. Before the pandemic, the shop had been a lively neighborhood hangout. But sales plummeted without the foot traffic of students from Howard University and the local high school. Making matters worse, Diaz’s brother Kenny Gilmore suffered several strokes. With bills piling up, the brothers closed the deli in January. “This had to be the worst. Everything else we weathered through,” Diaz said of the pandemic. Howard Deli is not alone. By the end of 2020, about 17% of all U.S. restaurants – about 110,000 – had closed long term or shuttered for good, according to the National Restaurant Association. Matt Strickland is determined that his business will not be next. The owner of Gourmeltz in Fredericksburg, Virginia, is continuing to operate his restaurant even though he said his license had been revoked by health officials for failing to comply with COVID-19 restrictions. “The people who are putting these mandates and regulations on us, they haven’t missed one paycheck. They haven’t suffered through this like we have,” said Strickland. Strickland said he has many supporters in the community. But health officials say they have received more than 50 complaints about Gourmeltz over its flouting of safety measures such as wearing masks, according to local media. The Spotsylvania County health department did not respond to a request for comment. The economic pain goes well beyond the restaurant industry. The U.S. economy lost 22 million jobs at the height of the pandemic and is still 10 million jobs short of where it was a year ago. Before the pandemic, Sharon Clark spent 11 years as a full-time jazz singer, traveling to Russia, France and South Africa. So when a year’s worth of concerts were canceled in early 2020, she panicked. “For the first time in my whole 11 years, I was asking myself and asking God, ‘What am I going to do?'” said Clark, a single mother of a teenage daughter. “Who’s going to keep the cell phones on… who’s going to pay the cable bill?” Clark said she feels optimistic that her singing work will pick up by summer. “I’m going to sing until I can’t anymore. But I’m going to learn to do something else – just in case,” she said.
Why Is Kroger Closing Stores Instead of Paying Hazard Wages for Its Employees? –Grocery store employees have been some of the most at-risk essential workers during the COVID-19 pandemic, so some local governments have decided they deserve a temporary raise. The only problem is that grocery stores are fighting those pay increases tooth and nail, suing cities to stop those laws from being enforced, or in the case of the country’s largest grocery chain, shutting down stores entirely. Kroger announced the closure of two Quality Food Centers (QFC) stores in Seattle this week, effective April 24. Though the company said in a statement to VICE News that the stores were “long struggling” and “underperforming,” it took the opportunity to blame city legislation passed last month mandating an extra $4 per hour in hazard pay for grocery workers through the end of the pandemic. “Unfortunately, Seattle City Council didn’t consider that grocery stores, even in a pandemic, operate on razor-thin profit margins in a very competitive landscape,” QFC wrote. “When you factor in the increased costs of operating during COVID-19, coupled with consistent financial losses at these two locations and this new extra pay mandate, it becomes impossible to operate a financially sustainable business.”This is the second time Kroger has closed stores and cited hazard pay, or “hero pay” ordinances mandating wage increases for workers. In January, it announced the closure of two Food 4 Less and Ralph’s locations in Long Beach, California. In that case, Kroger said the stores were “long-struggling” but blamed the city council’s “misguided action” to institute hazard pay for workers. “After all the hard work I’ve done to feed the needy families and everything and risk my life and my family’s lives at home and they don’t want to pay $4 extra an hour for four little months,” Robert Gonzalez, a worker at the Food 4 Less, told ABC7 earlier this month. “And then it’s over.”
States paying billions in fraudulent unemployment claims —The Kansas Department of Labor sent letters late last year to Laura Kelly about the unemployment benefits she had claimed. The only problems were that Kelly had not filed a claim, and that she is employed – as the state’s governor. A tsunami of fraudulent unemployment claims sweeping the nation has cost states and the federal government tens of billions of dollars in payments, many to overseas crime syndicates and nefarious hackers who have gained access to Americans’ Social Security numbers and other identifying information. The scope of the crisis is not yet known, though the early estimates are eye-popping: California officials have identified at least $11.4 billion in fraudulent claims, and they suspect another $20 billion may be fraudulent. New York officials have referred more than 400,000 fraudulent claims to federal investigators, totaling $5.5 billion in claims, most of which were caught before they were paid. In Ohio, more than 100,000 people have reported potential fraudulent activity in their names to the Ohio Department of Job and Family Services. Ohio and Michigan officials each estimated the potential fraud cost their states hundreds of millions of dollars. Colorado’s Department of Labor and Employment has flagged more than a million applications for benefits as potential fraud. Maryland has identified a quarter million phony claims. Massachusetts reported last year it had paid out $242 million in improper claims. The fraud is so widespread that Kelly is not even the only governor to be a victim: Someone filed a fraudulent claim on behalf of Ohio Gov. Mike DeWine (R), too. In a report updated earlier this month, the Department of Labor’s Office of the Inspector General estimated that fraud has cost unemployment insurance programs across the country at least $63 billion this year. Fraud is a routine part of unemployment insurance claims, experts said, in part because of the way the system is designed. Someone who becomes unemployed does not have time to wait through a lengthy review process, so states build in a bias toward action. A 1971 Supreme Court decision requires states to pay out benefits when a claim is made, rather than after an appeal. “There’s a natural tension in the unemployment insurance system between adequately assessing eligibility and getting payments out in a timely fashion,” said Christopher O’Leary, a senior economist at the Upjohn Institute for Employment Research who studies unemployment insurance programs. “There is pressure for the states to not be slow. There is also pressure in a pandemic to get money to people in need.”
Connecticut utilities seek to end pandemic-related shut-off ban – Gov. Ned Lamont is asking Connecticut utility regulators to continue a moratorium that prevents electricity customers from having their service shut off during the pandemic. Companies including Eversource Energy and United Illuminating have submitted motions to the Public Utilities Regulatory Authority asking to resume shutting off power for the first time since the moratorium was put into effect last March. The Department of Energy and Environmental Protection on Wednesday filed an objection to the motions filed by UI and Eversource, arguing that PURA should keep the moratorium in place until planned federal programs designed to help struggling utility customers come online. “PURA’s shut-off moratorium and other state actions have provided crucial mitigation to the pandemic burden for all of our residents, but especially those disproportionately impacted minority communities who have the highest energy burdens on their household budgets,” Lamont said in a statement. “We are simply too early in our comeback to begin lifting these lifesaving protections now, and we believe that there is potential for more help to be on the way.” More than $200 million has been designated by the federal government to assist Connecticut residents with rent and utility payments, the administration said. Eversource spokeswoman Tricia Taskey Modifica said the company has programs in place to help customers manage their bills to prevent any power disconnections.
Heating bill price shock could be felt in Minnesota as well – Minnesotans could face price shocks on their heating bills, the result of a nationwide gas-costs surge spurred by the great Southern freeze. The Minnesota Public Utilities Commission (PUC) will scrutinize spiking gas prices at a quickly arranged meeting scheduled for Tuesday. Meanwhile, U.S. Sen. Tina Smith on Saturday asked the Federal Energy Regulatory Commission to investigate the gas cost run-up, including possible price-gouging. “What we are looking at here is the potential for utility bills to spike up hundreds of dollars,” the Minnesota Democrat said in an interview on Monday. “On top of COVID, this could be more disastrous.” The pandemic-induced recession has already battered consumers, she said, pointing to rising gas and electric bill delinquencies. Indeed, the average past-due monthly bill at CenterPoint Energy hit $227 in January, up from $196 in December and the highest since the coronavirus pandemic hit the U.S., according to a PUC filing last week.
Material hardship taking a mental and physical toll on young adults during pandemic — As the United States approaches the one-year anniversary of the start of COVID-19 lockdowns, a new study by researchers from Syracuse University and the University of Texas at San Antonio shows that material hardship – difficulty paying for food, bills and healthcare – is taking a toll on the mental and physical health of young adults. In the study, “Material hardship, perceived stress, and health in early adulthood,” the researchers found that young adults ages 24-32 who are struggling to meet their basic needs are more likely to report poor health, depression, sleep problems and suicidal thoughts. According to the Urban Institute’s Health Reform Monitoring Survey, one in three adults have reported experiencing material hardship during the pandemic. For this recent study, material hardship was measured by asking more than 13,300 young adults if they had difficulty paying for food, bills and health care, and to report their stress levels. “Specifically, they were asked if they worried about running out of food before they had money to get more; had trouble paying utility, phone and rent/mortgage bills; and lacked health insurance or thought they should get medical care but did not,” said Syracuse University professor and research team member Colleen Heflin. “Using this information, we analyzed how hardship and stress levels impact health outcomes, including self-rated health, depression, sleep problems and suicidal thoughts.”
New CDC school opening guidelines fail to ‘follow the science’ Stat – President Biden vowed to “follow the science” in an effort to get kids back to school. But that’s not what the latest school opening guidelines from the Centers for Disease Control and Prevention do. The two core pillars of the guidelines – that schools should decide whether to open based on community transmission and that students should strive to be spaced 6 feet apart – aren’t supported by science. While there are many prudent recommendations in the document, these two demands will keep schools closed much longer than necessary, harming kids. The new school opening guidelines advise schools to open or close (or operate in “hybrid” mode) based on a four-tier color-coded system. Each color is tied to the number of new Covid-19 cases during the previous week. The red, or most restrictive category, is more than 100 cases a week per 100,000 people. By this metric, more than 90% of the country is currently in the most restrictive tier, ruling out full-time, in-person learning for elementary-aged students and any sort of in-person school for older children without screening tests.Yet many schools in such communities already have in-person school – and have done so for months – without issue. To justify this tiered approach, the CDC guidelines cite a “likely association” between community transmission levels and the risk of exposure in the schools. But the evidence for this is flimsy. The CDC relies almost exclusively on a U.K. study that examined Covid-19 cases and outbreaks – defined as two or more linked cases – in educational settings in England during June and July. The CDC summarizes the study by noting: “For every 5 additional cases per 100,000 population in regional incidence, the risk of a school outbreak increased by 72%.” While technically true, that increases is the relative risk, which obscures the study’s key finding about absolute risk: School outbreaks were vanishingly rare in this study – just 0.02% among schools that were open daily during this period – even in areas with high rates of community transmission. And if the CDC had looked at the next figure in the article, focusing on individual infections rather than outbreaks, no association was seen between the number of single infections in school and broader rates of community spread. The CDC’s school opening guidelines also ignore the experience of at least two U.S. states. Schools in North Carolina and Wisconsin were open during periods of high community transmission (red zone), and both saw far fewer cases in schools than outside of them. The Wisconsin study was published in Morbidity and Mortality Weekly Report, the CDC’s own journal. If the state had taken the CDC’s advice, it never would have done the study in the first place. Moreover, if there is less viral spread in schools than in the community, we want them open precisely during periods of high community spread, when the comparative risks outside of school are highest.
Los Angeles Unified School District moves to reopen schools for in-person instruction – Los Angeles Unified School District (LAUSD) Superintendent Austin Beutner announced on Monday that some in-person teaching will resume next week, with a broader reopening planned for April 9. The school district is the second largest in the nation, with 665,000 students and roughly 60,000 staff, including 26,500 teachers. Among the in-person services which will resume next week are child care, special education, and some athletic and tutoring activities, based on the terms of an agreement reached last October between the school district and the teachers union, the United Teachers Los Angeles. Most California districts, including Los Angeles, remain in the “purple tier,” with more than seven cases per 100,000 residents and a nearly five percent positive test rate statewide. The total number of deaths due to COVID-19 is approaching 50,000, after months in which ICUs across the state were filled to capacity. Randi Weingarten, the president of the American Federation of Teachers, said in a statement on Sunday that US schools must “actually try to get as much in-person as possible right now.” In California, the Los Angeles Times is leading the way in cheerleading these efforts, publishing an article on Monday titled, “L.A. parents demand schools reopen, saying science and improved conditions are on their side.” In fact, both parents and teachers are overwhelmingly opposed to reopening schools at the height of the pandemic. “The notion that students rarely become sick is a bald-faced lie. There can be no doubt that it’s safer to vaccinate both teachers and students before opening schools. This is of no concern to millionaire Weingarten, who has a cushy job outside of harm’s way. If she had to go back into a classroom, I’m sure she’d be singing a different tune.” As for the claim that “science is on the side” of reopening schools, scientific studies have confirmed that districts in which schools are open for in-person instruction have far higher levels of community transmission, and that young children are capable of spreading the disease. In reality, school reopenings are motivated not by concern for children’s welfare but by brutal economic considerations, forcing parents back to work to rack up profits for the financial elite. The push to reopen LAUSD is part of a nationwide campaign, spearheaded by the Biden administration, to force school districts to open against the opposition of teachers and parents.
San Diego school districts move to resume in-person classes – The San Diego Unified School District (SDUSD), the second largest district in California, announced on Tuesday it was targeting April 5 as the deadline to begin reopening campuses after almost a year of online learning due to the coronavirus pandemic. San Diego Unified school board member Richard Barrera told the media that teachers were scheduled to return to buildings the week of April 5, with all K-12 students returning the following week on April 12, provided that the county has returned to the “red tier” established by state health codes and vaccines are made “available” to all staff. San Diego County will begin making COVID-19 vaccines available to everyone starting March 1. This follows Governor Gavin Newsom’s announcement last week that the state will reserve 10 percent of vaccines for school staff, educators and child care workers. Statewide, an estimated 75,000 first doses of the vaccine will be given every week to teachers. The news was greeted with enthusiasm by the political and media establishment, who want a return to on-site learning to better facilitate reopening the economy and compel parents with children to go back to work. Much has been made about the vaccine distribution, but SDUSD is not actually requiring all staff to get vaccinated, merely to have vaccines “available.” This loophole would allow schools to reopen without having everyone inoculated against the virus. The announcement comes on the heels of new scientific research which has revealed that the California variant of the disease has acquired new and dangerous mutations. This underscores the absolute necessity of closing schools and all non-essential businesses until it is safe to reopen. “The [California] findings warrant taking a much closer look at this variant. … They underscore the importance of pulling out all the stops in terms of both exposure reduction and increased vaccine distribution and access,” one infectious disease expert told the Los Angeles Times. The trade unions, led by the San Diego Education Association (SDEA), have been instrumental in preparing the groundwork for a return to schools, despite the overwhelming scientific evidence that this will lead to a resurgence of COVID cases in the community and throughout the region. In a statement, Kisha Borden, president of the SDEA, said, “We are hopeful that a combination of vaccination for school employees, on-site mitigation (such as ventilation, testing, social distancing and masks), and community case rates that allow San Diego County to return to the red tier for the first time since the fall will allow us to offer in-person opportunities to all students by April 12 while still allowing online opportunities for students whose families do not feel comfortable returning in person.”
Teachers in US resist demand to accept “reasonable risk” of dying — As the death toll from COVID-19 reaches a horrific half a million in the United States, the Biden administration and the corporate media are ratcheting up their campaign demanding that educators and students resume in-person schooling despite scientific warnings of a major new surge of the pandemic as the winter turns to spring. The same educators who were hailed as “heroes” in the early months of the pandemic last year are now being denounced as selfish and irrational because they refuse to imperil themselves, their students and the communities they serve. Although a recent poll by the National Parents Union showed that 42 percent of parents want their children to attend classes remotely for the rest of the school year – and only 27 percent want fully in-person instruction – the media has falsely claimed there is a groundswell of popular support to fully reopen the schools. The Biden administration is spearheading this campaign, with the Democratic president reiterating his demand that schools be opened “five days a week” by April 1 during a CNN town hall meeting last week. When asked by a second grade student if she could catch COVID-19 and possibly infect her parents, Biden flatly lied, stating, “You’re not likely to be able to be exposed to something and spread it to mommy or daddy.” Democratic governors and local officials have carried out this campaign at the state and city levels. Schools are being opened this week in Detroit, even though Michigan has the third highest known cases of the more infectious B.1.1.7 UK variant among all US states. In Chicago, the next stage in the phased reopening of the nation’s third largest district starts Monday, with the return of tens of thousands of K-5 educators following the return of Pre-K and special education teachers last week. Some 62,000 middle school students in New York City will return February 25, following the return of Pre-K through fifth grade students in December. In Philadelphia, the opposition of teachers has forced the city government to delay openings for a third time, now until March 1. Teachers in Fairfax, Virginia and Montclair, New Jersey are also resisting back-to-school efforts.
West Virginia Senate outlaws public employee strikes as state demands schools reopen – On Monday, West Virginia’s upper legislative chamber passed a bill which changes state law, outlawing work stoppages and other collective action by public employees. The measure threatens that “participation in a concerted work stoppage” can be used to terminate workers. The bill is not just retribution for the massive statewide strikes of 2018 – 19, but is aimed at intimidating workers, and particularly educators, who are becoming increasingly radicalized and opposed to the deadly reopening of schools and nonessential workplaces. The passage of the bill directly followed the announcement by Republican Governor Jim Justice that schools will fully reopen for in-person instruction starting next month. While public work stoppages in West Virginia have been forbidden based upon interpretations of previous court rulings, Senate Bill 11, passed by a margin of 21 – 12, would make such actions illegal by definition. The bill, which has yet to go to the state House of Delegates for ratification, declares: “Public employees in West Virginia have no right, statutory or otherwise, to engage in collective bargaining, mediation or arbitration, and any work stoppage or strike by public employees is hereby declared unlawful.” The bill targets teachers specifically, cynically claiming that a work stoppage in education “poses a serious disruption to the thorough and efficient system of free schools, guaranteed to the children of West Virginia by section one, article XII of the Constitution of West Virginia.” The bill was introduced on the three-year anniversary of the massive West Virginia teacher strike that erupted in 2018 . The bill attacks a local superintendent’s right to close schools in anticipation of a work stoppage. This is a response to events in the 2018 teachers’ strike, when superintendents closed classes as teachers walked out, in many cases supporting their demands. It also bans extracurricular activities during a strike, in an attempt to pit students and parents against educators. Most significantly, the bill forbids alternate instruction methods, such as allowing teachers to work remotely, a clear response to educators’ widespread refusal to report for class in-person as the pandemic has raged on. A related bill, House Bill 2536, would require “county board[s] to withhold pay of assigned employees when school [is] closed temporarily due to concerted work stoppage or strike.” The raft of anti-teacher legislation is part of a one-two punch in the ruling class’ drive toward a full economic reopening in the state of West Virginia. It follows Governor Justice’s demand last week that all pre-K-through 8th grade classes reopen for daily in-person instruction by March. Last Friday, Justice declared that the governor’s mansion would loosen pandemic-related restrictions related to indoor dining, public gatherings and other protocols immediately.
Donald Trump Jr. uses a wall of guns as backdrop to launch video attack against teaching unions – Donald Trump Jr. posted a video on social media channels over the weekend in which he attacked teachers’ unions while using a backdrop of what appeared to be a large collection of guns on a wall. The video, titled “These Teachers [sic] Unions are OUT OF CONTROL,” was originally posted to Rumble, a Canadian video site favored by Trump supporters, and later shared by Trump Jr. on his Twitter page. In the footage, Trump Jr. – a prominent gun rights advocate – attacks President Joe Biden as well as teachers’ unions for what he said was their failure to advocate for a timely reopening of schools, many of which remain shuttered due to the COVID-19 pandemic. Trump echoed his father’s repeated calls during his presidency for schools to be reopened, claiming that teachers and their unions were doing “whatever they can to avoid going back.” “You’ve seen the way in the last couple of months the way they’ve basically held up progress [and] prevented schools from opening,” Trump said in the video. “The teachers’ union and those representing them have definitely failed our children in terms of education and everything else.” The largest US teaching unions have largely advocated remote learning during the pandemic on safety grounds, and last week endorsed a roadmap by the Centre for Diseases Control and Prevention for the gradual reopening of schools, NBC reported. The video appears to be filmed in front of multiple hunting rifles which are hanging on a wall. The reason for Trump’s decision to film the video in front of that backdrop was unclear.
Michigan teachers, students face double threat from school reopenings: contaminated water and COVID -With school openings scheduled for March 1 in Detroit, Dearborn, and other districts in Michigan, the date recommend by the administration of Democratic Governor Gretchen Whitmer, teachers and students in the state will be confronted with another serious health threat in addition to COVID infection, unsafe water. A recent article posted on the Chalkbeat.org website detailed the hazards posed by water that has sat stagnant in schools’ pipes, in some cases since last March. The report points to the alarming dangers of unsafe drinking water in Michigan public schools and provides yet another example of the dangerous consequences of the drive to reopen schools. In the context of the COVID-19 pandemic, the threat of contaminated water provides one more reason why schools should remain virtual through the end of the school year. Michigan’s state government recommends, but does not require, that school water pipes be thoroughly flushed with fresh water at the end of summer vacation, a period of about ten weeks. Many of the schools that are proposed to reopen have sat unused for eleven months. The dangers that can be remediated by the methodical flushing of pipes include removal of bacteria, such as legionella, and lead, which can be leached from the pipes. Elin Betanzo, an environmental engineer who heads the consulting firm Safe Water Engineering and who played a critical role in exposing the lead-in-water poisoning in Flint, spoke about the dangers of reopening school buildings where the water pipes have been stagnant since last March. “In Michigan, and in the entire country for that matter, there is no requirement for safe drinking water in public schools,” she said. “There’s no definition of what is compliant, nor are there procedures to mandate regular testing or measures to carry out methodical flushing.” Reopening the schools after they have been closed for many months, with only minimal maintenance, will have serious and possibly deadly consequences. When new water isn’t pumped into school pipes for weeks at a time, necessary anti-corrosive treatments dissipate, allowing bacteria to form and lead to get into the water. Lead is a dangerous neurotoxin that can attack any system in the body when ingested, even in low doses, stunting developmental growth and impacting behavior. An estimated 9,000 Flint children were poisoned by lead. “Most school plumbing systems in Michigan contain some lead,” Betanzo said. “No amount of lead is safe; period.” In addition to lead poisoning, Betanzo warned, “Micro-organisms grow in stagnant water, such as legionella. The symptoms of Legionnaires disease are very similar to COVID-19 because it is contracted through inhalation and affects the lungs. Who wants this to happen to a child? It is not only the children who are impacted, but those who are 50 years old and up who are at risk, which means the teachers and school staff. In the Chalkbeat article, Betanzo is quoted as saying that “they should have been flushing 12 weeks prior.”
San Francisco school board pauses plan to rename high schools —The recently elected president of the San Francisco Board of Education has postponed the process of renaming schools, writing in an op-ed for the San Francisco Chronicle that she is first concentrating on reopening schools. “There have been many distracting public debates as we’ve been working to reopen our schools. School renaming has been one of them,” Gabriela Lopez, the school board’s president, wrote. “It was a process begun in 2018 with a timeline that didn’t anticipate a pandemic. I acknowledge and take responsibility that mistakes were made in the renaming process.” The School Names Panel recommended renaming 42 schools in the San Francisco area in November of last year, garnering bipartisan criticism. Among other suggestions, the panel recommended renaming schools named after Abraham Lincoln, citing his treatment of Indigenous people as a reason to remove his name.”We are deeply grateful for the work of the renaming committee and many schools are as well. They are excited about the opportunity to uplift communities that have previously been underrepresented. Our students need to attend schools where they feel valued and seen. This work is anti-racist and we’re proud of that,” Lopez continued. “But reopening will be our only focus until our children and young people are back in schools,” Lopez added. “We’re canceling renaming committee meetings for the time being. We will be revising our plans to run a more deliberative process moving forward, which includes engaging historians at nearby universities to help.” Lopez added that she would not comment any further on renaming schools until they were reopened. San Francisco Mayor London Breed (D) spoke out against renaming last year, calling it “offensive” and saying the move should not be prioritized as governments attempt to reopen schools. Many schools across the country have begun considering new names as a way to move away from historical figures who are seen as problematic by modern-day standards. Students at T.C. Williams High School in Alexandria, Va., submitted more than 50 names to replace their current school name. T.C. Williams was superintendent of the Alexandria public school system for several decades and was a known segregationist. Among the names recommended were George Floyd, Ruther Bader Ginsburg and Meghan Markle.
Montgomery, Alabama schools moves forward with plans to convert public schools into privately-operated charter schools —In the midst of the pandemic and educator deaths, the Montgomery, Alabama Public Schools is pushing forward a plan for the privatization of schools. On February 1, Superintendent Ann Roy Moore announced that Phalen Leadership Academies (PLA), based in Indianapolis, Indiana, would take over Davis Elementary for the fall 2021 school year, converting it into a charter school. Charter schools are funded by public tax dollars, but privately run. Nixon Elementary and Bellingrath Middle will follow suit in 2022. Plans are afoot for further “startup” charters as well. The announcement comes as at least eight local teachers, and thirty statewide, have died from COVID-19. District teachers are engaged in a fight against school reopenings and dilapidated school buildings, which commonly have rodent, insect and bat infestations. Teachers throughout MPS give accounts of classrooms filled with mold. They are forced to use inadequate technology and substandard personal protective equipment. Funds granted to charter schools could have instead been channeled towards upgrading dilapidated facilities and providing more services. The “partnership” that State Superintendent Eric Mackey and others propose is the partnership between business and school board to gut state education funding further. The state’s ruling elite is using the crisis in Montgomery as a wedge to open up the entire state to charters. At present, there are only two other charters in Alabama, one in Mobile and one in Livingston. “We are fighting a war on four fronts,” as one educator put it to the World Socialist Web Site. In justifying the decision, the school district pointed to poor test scores at the three schools. Davis, Nixon and Bellingrath were placed under state supervision in 2017 on the grounds of “deficiencies in finances, operations, transportation, and student performance,” according to the ALSDE. This is the common tactic used to justify converting public schools into privately-run charters. Since Obama’s Race to the Top program, low test scores on mind-numbing standardized tests have been the cover for turning underfunded public schools into a profit opportunity.
US universities have cut 650,000 jobs, a 13 percent workforce reduction, since the onset of the pandemicThe Department of Labor published a striking report this month on the impact of the COVID-19 pandemic on higher education. The report concluded that colleges and universities have cut a total of 650,000 jobs since February 2020, 13 percent of all higher education workers. While the Department of Labor has not specified the types of jobs which have been cut, reports from university systems across the country demonstrate the damage done to university workers. Thousands of positions for food service and custodial workers have been cut as on-campus services were slashed and dorms closed. Workers engaged in student services have also been vulnerable as services were moved online and condensed. Some of the most notable targets of university layoffs and cuts have been adjunct faculty and non-tenured professors, who have been the subject of significant rounds of mass firings as schools move to cut costs and consolidate courses. Rensselaer Polytechnic Institute (RPI) in Troy, New York announced in May that it would not be renewing the contracts of 200 employees, including 60 full-time non-tenured faculty and an undisclosed number of adjuncts. RPI also furloughed nearly 300 employees, mostly non-instructional staff, despite university president Shirley Ann Jackson making $5 million a year. Over the summer, Northern Arizona University eliminated 114 non-tenured faculty. They were provided with no severance and were told they would lose their health coverage within a week. The University of Akron eliminated 178 positions, including 23 percent of its unionized full-time faculty between the start of the pandemic and the summer of 2020. The University of Michigan laid off 173 workers, furloughed over 3,500 and enforced more than 2,300 wage reductions. One of the largest attacks on university staff came from the City University of New York (CUNY) system, which laid off 2,800 adjunct faculty last summer, a quarter of CUNY’s adjunct staff. CUNY is now embroiled in a controversy for withholding contractually-obligated pay raises for the university’s lowest paid workers. The immediate cause of these mass job cuts is the collapse in university budgets during the pandemic. However, there is no doubt that the crisis is being utilized to push through a restructuring of higher education that will result in lower wages for professors and other school staff.
CUNY breaks faculty and staff contract, withholding promised pay raises – Last week, the City University of New York (CUNY) announced that it is indefinitely delaying “equity raises” to over 2,500 low-paid assistant staff and lecturers, amid the deepening pandemic-fueled financial crisis faced by the largest urban university system in the US. The decision, made by CUNY Chancellor Felix Matos Rodr’guez, violates the latest worker contract agreements. It follows CUNY’s withholding of a promised 2 percent pay raise for faculty and staff in November, which also broke the contract, and the laying off of 2,800 adjunct faculty last summer. These depression-like cuts and austerity measures are not restricted to CUNY alone, but extend to many higher education institutions throughout the country, and in New York City – under Democratic Party control – to critical social services and infrastructure. The Metropolitan Transportation Authority is threatening to significantly reduce service this year and lay off thousands of transit workers . The latest breach of CUNY’s contract with its employees involves withholding a salary increase of $1,000 starting on February 1 to 1,295 assistants to “Higher Education Officers” (academic administrators), whose base salaries are $40,869, and withholding an increase of $1,500 starting on April 1 to 1,262 full-time lecturers, whose base salaries are $47,598. These meager pay raises total just $19 and $28, respectively, per week for workers living in one of the most expensive cities in the world. The fact that CUNY is choosing to withhold what are deemed “equity raises,” because they are going to the lowest-paid office and full-time faculty positions, is especially shameful. CUNY officials have claimed the raises will be paid eventually, but have provided no date. This past November, CUNY announced it was withholding a contractual 2 percent raise for all unionized faculty and staff because the budget – which was slashed by over $55 million by city and state budget cuts combined, and saw a $52 million decline due to a 5 percent decrease in enrollment – could not afford it. The deferring of an annual 2 percent raise has also been applied to around 80,000 unionized New York state employees on Democratic Governor Andrew Cuomo’s order. The governor’s recently proposed budget provides that repayment would not take effect until 2023 . Due to this measure, adjunct professors, who already earn low wages, have been forced to take an effective pay cut for the current spring semester because the university front-loaded a portion of the pay rise last fall. On top of this, adjuncts have pointed to CUNY’s raising of the minimum enrollment for classes by 33 percent, which has resulted in class cancellations due to under-enrollment.
COVID-19 cases in New York colleges rise as state changes guidelines to keep schools open – COVID-19 cases continue to rise in the State University of New York (SUNY) system after the state erroneously altered its guidelines for handling coronavirus outbreaks. Since schools opened last fall, state guidelines for universities in New York have required that if a school recorded 100 individual cases or five percent of the student body became infected in a two week period then the school would be required to switch to two weeks of remote instruction. However, facing a slew of outbreaks across the state, the state government decided to alter the guidelines to keep schools open rather than follow its guidelines. As of February 19, schools will be allowed to remain open with up to 5 percent of the student body infected in a 14-day period as long as schools meet testing requirements. The decision has no scientific grounding and is clearly politically motivated. With the Biden administration and the Democratic Party putting their full weight behind the campaign to reopen schools, the SUNY system is finding that mandated school closures pose a threat to this policy. If public schools were to open while universities around the state of New York were closing just weeks into the new semester, how could anyone expect classrooms to be considered safe for returning students at any level? In the view of the Democratic Party and ruling elite more generally, the political stakes are far too high. The SUNY Board of Trustees, which is full of millionaires and Democratic Party officials, has decided that it must bend its own rules to their maximum in order to protect the policy of “herd immunity” pioneered by the fascistic Trump administration in Washington. This approach follows a previously trodden path. In the fall, SUNY announced unscientifically that case numbers contributing to the 100 case threshold would reset to zero every two weeks rather than operating on a rolling 14-day period. This came at the same time that SUNY Oswego had 147 active cases and was shortly forced to switch to remote instruction as case numbers neared 200 within a matter of days. It is three weeks since in-person instruction began at SUNY campuses and 2,400 cases have already been recorded. Over 1,000 of these have occurred just since February 13. More than 1.5 percent of the entire on-campus SUNY population has been infected since January 30, and one-in-seven students at SUNY Cortland have been infected since the fall of 2020. Both SUNY Cortland and SUNY Geneseo are closing in on four percent of the on-campus study body being infected in the just the first month of classes.
‘Historically’ Low Flu Activity Reported This Year — While the flu season is far from over and flu cases have been reported year-round in the United States in the past, during a typical year, influenza cases would likely ramp up during the fall and winter, peaking in February. Not this year.”We haven’t picked up any outbreaks of influenza or anything really, it’s just historically low,” Lynette Brammer, who leads the domestic influenza team for the Centers for Disease Control and Prevention (CDC), told AccuWeather. Brammer’s team tracks flu cases each year in its weekly report, Flu View.In the below graphic, the CDC compares flu cases over the past several years, and influenza in the 2020-21 season, represented on the red line with black triangles, is almost non-existent.”We’re looking very hard for flu,” Brammer told AccuWeather. “We’re just not finding it.”In fact, many people have reported not feeling any flu or cold symptoms.Brammer said the lack of flu is not only good news for individual health, but considering the number of people hospitalized for influenza each year, it’s a huge break for hospitals inundated with COVID-19 patients.”Given the current situation, that’s a very good thing. You know the hospitals have been overwhelmed in a lot of cases, and you really don’t want to add flu on top of that,” Brammer said.According to the CDC, some 173 people were hospitalized for the flu between Oct. 1 and Feb. 13. That’s lower than rates for any season since routine data collection began in the 1990s.In comparison, 400,000 people were hospitalized for the flu and 22,000 died, including 434 children, during the entire 2019-20 season. There has only been one pediatric flu death reported this season.
More Evidence That Private Equity Kills: Estimated >20,000 Increase in Nursing Home Deaths, 160,000 Life Years Lost Due to Cuts in Care – Yves Smith -Private equity has succeeded in exploiting economic choke points in much narrower sectors of the economy than experts in monopolies typically study. Health care is an idea area in which to exploit the leverage of providers compared to patients. You can’t haggle over which ambulance comes to fetch you. Similarly, most who get an operation or need ongoing treatments, like dialysis or chemotherapy, will use a facility nearby, which means private equity can create local oligopolies. Not only do private equity owners jack up prices (see Eileen Appelbaum on how private equity negotiates higher fees for outsourced physician practices) but they also lower service levels, as an important new study confirms.An important study by Atul Gupta, Sabrina T. Howell, Constantine Yannelis, and Abhinav Gupta, published by the Becker Friedman Institute of the University of Chicago, covering approximately 7.4 unique Medicare patients in nursing homes to understand the impact of private equity buys of 1,674 nursing homes from 2000 to 2017. We’ve embedded it below and encourage you to read it and circulate it widely.The study is very carefully done. It looks at changes in care and health/mortality in nursing homes after private equity acquisitions. That makes it apples to apples, since the acquired homes were already for profit institutions. The authors also adjusted for consolidations within nursing home chains (they compared consolidation within PE deals with consolidation of non-PE owned for profit homes) and changes in patient composition post purchase. The findings are damning:A key measure of patient welfare is short-term survival. We find that going to a PE-owned nursing home increases the probability of death during the stay and the following 90 days by 1.7 percentage points, about 10% of the mean. This estimate implies about 20,150 Medicare lives lost due to PE ownership of nursing homes during our sample period. We use the observed age and gender distribution of Medicare decedents to estimate the corresponding implied loss in life-years – 160,000. Using a conventional value of a lifeyear from the literature, this estimate implies a mortality cost of about $21 billion in 2016 dollars. To put this in perspective, this is about twice the total payments made by Medicare to PE facilities during our sample period, about $9 billion. Later in the paper, the authors underscore the significance of the 1.7% increased odds of dying in the first 90 days: “In the context of the health economics literature, this is a very large e ffect.”Why did this happen? The private equity firms cut on patient care, in particular nurse staffing levels. Keep in mind that nursing homes in the US treat both short-term patients as well as long-term residents.Nurses are the biggest operating cost, typically representing 50% of total non-overhead expenses. The cut in service ironically hurts older but relatively healthy residents the most, those with “low disease burdens.” The authors argue that sicker residents required levels of care that could not readily be reduced. So the ones that took the hit were the seemingly sounder patients, who wouldn’t have a new ailment or injury attended to as quickly as in a non-PE owned nursing home.
Australian universities rush to enroll students and disregard COVID dangers — As the teaching year begins, Australian university administrations are competing to secure the largest share of enrolments, while returning to face-to-face teaching and expanding class sizes with little to no regard for the health risks to staff or students posed by the continuing global COVID-19 pandemic. At present, the coronavirus, if it is currently present in the community, is circulating at extremely low levels. However recent outbreaks, including of highly-contagious overseas variants of the virus that have spread from hotel quarantines, have demonstrated that the situation can change very rapidly. The return to physical classrooms is part of the rising “economic reopening” and anti-lockdown push of governments and the corporate media. Universities are also desperately seeking to boost their revenues after decades of government funding cuts and pro-market restructuring of tertiary education, intensified by the loss of international student fees due to the pandemic. University of New South Wales deputy vice chancellor (academic), Merlin Crossly, told the Guardian last month that “2021 will be a bit of a celebration” because of the roll out of vaccines. In Australia, vaccines only began to be administered to front-line health workers this week. Most university students fall under the fourth category of the government’s five-part rollout plan, so they will receive the vaccine in the second half of the year at the earliest. Moreover, the vast majority of the country’s population will receive the AstraZeneca vaccine, which may not adequately protect against the more virulent strains, such as that detected in South Africa. Even if all goes to plan, this still leaves plenty of time and possibility for outbreaks to start on campuses, endangering the lives of students and staff alike. Judging by media reports, university managements plan to have tens of thousands of students back inside classrooms this semester.
Alternating lockdown strategy can help defeat COVID-19 and sustain socio-economic activity – Social distancing – from mobility restrictions to complete lockdowns — can take many weeks, possibly even months, a potentially devastating outcome for social and economic stability. One of the challenges is that the sick cannot be selectively isolated, since many of the spreaders remain pre-symptomatic for a period ranging from several days to as much as two weeks – invisible spreaders who continue to be socially active. Hence, it seems that without a population-wide lockdown isolating the carriers cannot be achieved effectively.To bypass this challenge, researchers from Israel’s Bar-Ilan University, led by Prof. Baruch Barzel, devised a strategy based on alternating lockdowns: first splitting the population into two groups, then alternating these groups between lockdown and routine activity in weekly succession. Together with isolation of the symptomatic spreaders and the adoption of everyday prophylactic behaviors, this strategy can help defeat the virus, while sustaining socio-economic activity at a 50% level. This strategy was recently published in the journal Nature Communications.In the alternating lockdown routine, society is partitioned into two groups, with little interaction between them — one half active this week, and the other active only the next. This will already slow the spread, but its main advantage is that it helps isolate the invisible spreaders, such as those who are pre-symptomatic carriers still in the incubation period. “Consider an individual who became infected during their active week. They are now in their pre-symptomatic period – the most dangerous stage, in which they are invisible spreaders. The crucial point is that, according to the alternating lock-down routine they are now scheduled to enter their lockdown phase,” explains Prof. Barzel, of Bar-Ilan’s Department of Mathematics. “Staying at home for another week, they will most likely begin to exhibit symptoms, and therefore remain in isolation until full recovery. Indeed, if following a week of lockdown they show no symptoms, they are most likely uninfected and can partake in social and professional activities during their active week. Therefore, alternating lockdown with full isolation of symptomatic spreaders ensures that at all times, the majority of invisible spreaders are inactive, as their incubation period is naturally directed towards their lockdown phase.” The proposed weekly succession is aimed to sustain a functional economy in these challenging times. The researchers believe that, providing an outlet for people to continue their social and professional activity, at least at 50% capacity, will, in and of itself encourage cooperation, as it relaxes some of the individual stress endured under lockdown.
Canada’s governments lift COVID-19 restrictions despite warnings of deadly third wave — Highlighting “the emergence and spread” of more contagious variants of the COVID-19 virus, Canada’s chief medical officer, Dr. Theresa Tam, told a press conference last Friday, “Unless we maintain and abide by stringent public health measures, we may not be able to avert a re-acceleration of the epidemic in Canada. These variants have been smouldering in the background and now threaten to flare up.” Tam backed up her warnings with Health Canada projections that showed new infections could rise to 10,000 per day by late March if current public health restrictions are maintained, and mushroom to 20,000 if these restrictions are relaxed. “Further lifting of the public health measures would cause the epidemic to re-surge rapidly and strongly,” she declared. Tam’s warnings of a “third wave” of mass infections and death echo those of epidemiologists and other health experts across the country. But their scientific advice is being disregarded by every provincial government across the country, and with the full blessing of the federal Liberal government, Tam’s boss. Canada’s governments are engineering the very “lifting of the public health measures” that she warned against last Friday. In so doing, they are paving the way for an upsurge in infections that will add thousands more fatalities to an already horrific death toll that has risen by more than 40 percent in just the last two months and now stands at more than 21,600. In Alberta, the United Conservative Party government is implementing a 4-step plan to fully reopen the economy. Except for sports games and entertainment venues, virtually the entire economy is reopened, even as large workplace outbreaks continue, as at the Olymel meatpacking plant in Red Deer. In Ontario, the Doug Ford-led Progressive Conservative government lifted a state of emergency on February 8 and announced the return to a regional, colour-coded reopening plan. Businesses in the majority of Ontario’s districts were allowed to reopen as of February 16, with York, one of the province’s hotspots, following suit yesterday. Ford grudgingly agreed that lockdown measures will remain in place in Metro Toronto and the neighbouring Peel region until March 8, but only because local health and other officials repeatedly went public with their concerns about the premature lifting of restrictions. The Ford government has also completed its reckless reopening of the province’s public and publicly funded Roman Catholic schools, with schools in Toronto, Peel, and York ordered to reopen for in-class instruction starting Tuesday, February 16.
UK government’s policies lead to horrific COVID-19 death rates among disabled people — The Conservative government’s criminal indifference to the lives of some of the most vulnerable people in society has become ever more blatant as the pandemic crisis has unfolded. Earlier this month, the Mencap charity reported that people with learning disabilities were being told in January that they would not be resuscitated if they fell gravely ill with COVID-19. Edel Harris, Mencap’s chief executive, told the Guardian, “Throughout the pandemic many people with a learning disability have faced shocking discrimination and obstacles to accessing healthcare, with inappropriate Do Not Attempt Cardiopulmonary Resuscitation (DNACPR or DNAR) notices put on their files and cuts made to their social care support. “It’s unacceptable that within a group of people hit so hard by the pandemic, and who even before Covid died on average over 20 years younger than the general population, many are left feeling scared and wondering why they have been left out.” A support worker, who works with people with learning disabilities, told the World Socialist Web Site, “They should have a chance for life like anybody else. It is outrageous to have DNAR forms in these people’s files without taking into account their choices, wishes and beliefs. We managed to get some of these notices reversed last year.” Mencap’s warning came two days after the UK’s Office for National Statistics (ONS) reported that six in 10 of those killed by COVID-19 between January and November last year were disabled, despite making up just 17 percent of the study population. According to the ONS, the risk of death involving COVID-19 was 3.7 times higher for men and women with a medically diagnosed learning disability than for the general population. For the disabled in general, including physical disability, the rate was 3.5 times higher for more-disabled women – defined by someone having their daily activities “limited a lot” by their health – and 3.1 times for more-disabled men. The risk for less-disabled women was two times greater and 1.9 times greater for less-disabled men. Last November, Public Health England (PHE) reported that the COVID-19 death rate for disabled young people, aged 18-34, was 30 times higher than the rate for people in the same age group without disabilities. Reports of the widespread placing of DNACPR notices on disabled people caused an outcry last year. Amnesty International condemned the practice in a scathing report, “As if expendable: The UK government’s failure to protect older people in care homes during the Covid-19 pandemic”. The government was forced to sanction a review of the issue through the Care Quality Commission (CQC).
Media censors British Medical Journal description of pandemic deaths as “social murder” -On February 4, the BMJ (formerly, British Medical Journal) published an editorial accusing the world’s governments of “social murder” in their collective response to the pandemic. The response to this devastating statement by the media and politicians of all stripes in Britain was to ignore and conceal it.The editorial, “Covid-19: Social murder, they wrote – elected, unaccountable, and unrepentant”, was written by Kamran Abbasi, the executive editor of the journal.The BMJ editorial: “Covid-19: Social murder, they wrote – elected, unaccountable, and unrepentant” “Murder,” the editorial begins, “is an emotive word. In law, it requires premeditation. Death must be deemed to be unlawful. How could ‘murder’ apply to failures of a pandemic response?”But, it argued, “After two million deaths, we must have redress for mishandling the pandemic … “At the very least, covid-19 might be classified as ‘social murder,’ as recently explained by two professors of criminology. The philosopher Friedrich Engels coined the phrase when describing the political and social power held by the ruling elite over the working classes in 19th century England. His argument was that the conditions created by privileged classes inevitably led to premature and “unnatural” death among the poorest classes.”The editorial concluded, “The ‘social murder’ of populations is more than a relic of a bygone age. It is very real today, exposed and magnified by covid-19. It cannot be ignored or spun away. Politicians must be held to account by legal and electoral means, indeed by any national and international constitutional means necessary.” The BMJ is the world’s oldest and one of the most prestigious medical periodicals, with a publication history going back to 1840.
.
include(“/home/aleta/public_html/files/ad_openx.htm”); ?>


