
Written by rjs, MarketWatch 666
 Here are some selected news articles from the week ended 09 January 2021. Part 2 is available here.
This is a feature at Global Economic Intersection every Monday evening or Tuesday morning.
Please share this article – Go to very top of page, right hand side, for social media buttons.
Gasoline demand at a 32 week low, gasoline supplies up most in 35 weeks; distillates supplies up most in 31 weeks
Oil prices rose for the ninth time out of the past ten weeks this week, after the Saudis unilaterally cut their oil output…after inching up 0.6% to $48.52 a barrel last week on a weaker dollar and on Trump’s signing of the Covid stimulus bill, the contract price of US light sweet crude for February delivery opened lower on Monday as OPEC delayed their decision on extending their output cuts into February, and fell throughout the trading session to settle 90 cents lower at $47.62 per barrel as U.S. stocks fell 2% on concerns over the outcome of runoff Senate elections in Georgia….oil prices were lower again early Tuesday before OPEC+ resumed their meeting on February’s oil output levels, but then jumped nearly 5% after news that Saudi Arabia would make large voluntary cuts to their oil output to finish $2.31 higher at $49.93 per barrel, as Mideast tensions rose after Iran seized a South Korean-flagged oil tanker in the Strait of Hormuz…oil prices were mostly mixed early Wednesday after the American Petroleum Institute had reported a modest crude draw but large fuel inventory increases but then resumed their climb after the EIA reported the largest withdrawal from crude inventory since August before closing 70 cents higher at $50.63 per barrel…oil prices remained steady on Thursday even after Trump mobs stormed the U.S. Capitol, as oil traders focused on the likelihood of tighter supplies after Saudi Arabia had unilaterally agreed to cut output, and settled 20 cents higher at $50.83 per barrel as demand fears, slow vaccine rollouts, and the US political uncertainty took some wind out of the oil rally’s sails...but the oil rally resumed Friday as traders focused on the Democratic victories in the Georgia elections that would boost the likelihood of a larger government stimulus, and US crude prices settled $1.41, or 2.8%, higher at $52.24 a barrel, thus finishing the week with a 7.7% increase and at the highest price level since February of last year..
Natural gas prices also moved higher this week on forecasts for colder weather and greater heating demand later in the month…after rising 1% to $2.539 per mmBTU last week in volatile trading on equally volatile swings in the weather outlook, the contract price of natural gas for February delivery opened 4% higher on Monday, on strong LNG exports, flat production, and an improved outlook for weather-driven demand, but drifted lower to settle with a 4.2 cent increase at $2.581 per mmBTU…February gas prices extended that increase on Tuesday, however, rising 12.1 cents to $2.702 per mmBTU, as weather models pointed to fresh bouts of cold air over the Midwest and East in the second half of January, and then added 1.4 cents to that gain on Wednesday on continued strength in LNG exports…natural gas prices inched up another 1.3 cents on Thursday after the EIA reported a withdrawal from gas inventories that was well above normal but below expectations, but pulled back 2.9 cents to finished the week with a 6.3% gain at $2.700 per mmBTU on a shift in weather forecasts that pointed to a potential delay in the onset of widespread freezing temperatures from early in the third full week of January to later in the month…
The natural gas storage report from the EIA for the week ending January 1st indicated that the quantity of natural gas held in underground storage in the US decreased by 130 billion cubic feet to 3,330 billion cubic feet by the end of the week, which left our gas supplies 138 billion cubic feet, or 4.2% higher than the 3,192 billion cubic feet that were in storage on January 1st of last year, and 201 billion cubic feet, or 6.4% above the five-year average of 3,129 billion cubic feet of natural gas that have been in storage as of the 1st of January in recent years….the 130 billion cubic feet that were drawn out of US natural gas storage this week was less than the average forecast of a 139 billion cubic foot withdrawal from an S&P Global Platts survey of analysts, but it was higher than the average withdrawal of 115 billion cubic feet of natural gas that have typically been pulled out of natural gas storage during the same week over the past 5 years, and much more than the 48 billion cubic feet withdrawal from natural gas storage seen during the corresponding warmer week ending January 3rd, 2020….
The Latest US Oil Supply and Disposition Data from the EIA
US oil data from the US Energy Information Administration for the week ending January 1st indicated that with our supply of and demand for oil little changed from the prior week, we had to withdraw oil from our stored commercial supplies for the 6th time in the past seven weeks and for the 18th time in the past twenty-four weeks…our imports of crude oil rose by an average of 43,000 barrels per day to an average of 5,369,000 barrels per day, after falling by an average of 238,000 barrels per day during the prior week, while our exports of crude oil rose by an average of 7,000 barrels per day to a forty-one week high of 3,632,000 barrels per day during the week, which meant that our effective trade in oil worked out to a net import average of 1,737,000 barrels of per day during the week ending January 1st, 36,000 more barrels per day than the net of our imports minus our exports during the prior week…over the same period, the production of crude oil from US wells was reportedly unchanged at 11,000,000 barrels per day, and hence our daily supply of oil from the net of our trade in oil and from well production totaled an average of 12,737,000 barrels per day during this reporting week…
US oil refineries reported they were processing 14,376,000 barrels of crude per day during the week ending January 1st, 89,000 more barrels per day than the amount of oil they used during the prior week, while over the same period the EIA’s surveys indicated that a net of 1,144,000 barrels of oil per day were being pulled out of the supplies of oil stored in the US….so based on that reported & estimated data, this week’s crude oil figures from the EIA appear to indicate that our total working supply of oil from net imports, from storage, and from oilfield production was 495,000 barrels per day less than what our oil refineries reported they used during the week…to account for that disparity between the apparent supply of oil and the apparent disposition of it, the EIA just inserted a (+495,000) barrel per day figure onto line 13 of the weekly U.S. Petroleum Balance Sheet to make the reported data for the average daily supply of oil and the data for the average daily consumption of it balance out, essentially a balance sheet fudge factor that they label in their footnotes as “unaccounted for crude oil”, thus suggesting that there must have been an error or errors of that magnitude in the oil supply & demand figures that we have just transcribed….however, since most everyone treats these weekly EIA figures as gospel and since these numbers often drive oil pricing and hence decisions to drill or complete wells, we’ll continue to report them as they’re published, just as they’re watched & believed to be accurate by most everyone in the industry….(for more on how this weekly oil data is gathered, and the possible reasons for that “unaccounted for” oil, see this EIA explainer)….
Further details from the weekly Petroleum Status Report (pdf) indicate that the 4 week average of our oil imports fell to an average of 5,421,000 barrels per day last week, which was 18.1% less than the 6,617,000 barrel per day average that we were importing over the same four-week period last year…..the 1,144,000 barrel per day net withdrawal from our crude inventories was due to a 1,144,000 barrels per day withdrawal from our commercially available stocks of crude oil, while the oil supplies in our Strategic Petroleum Reserve remained unchanged….this week’s crude oil production was reported to be unchanged at 11,000,000 barrels per day because the rounded estimate of the output from wells in the lower 48 states was unchanged at 10,500,000 barrels per day, while a 1,000 barrel per day decrease to 514,000 barrels per day in Alaska’s oil production had no impact on the rounded national total…last year’s US crude oil production for the week ending January 3rd was rounded to 12,900,000 barrels per day, so this reporting week’s rounded oil production figure was 14.7% below that of a year ago, yet still 30.5% more than the interim low of 8,428,000 barrels per day that US oil production fell to during the last week of June of 2016…
Meanwhile, US oil refineries were operating at 80.7% of their capacity while using those 14,376,000 barrels of crude per day during the week ending January 1st, up from 79.4% of capacity during the prior week, and the highest refinery utilization rate since August….however, since refinery utilization averaged the lowest on record through 2020, the 14,376,000 barrels per day of oil that were refined this week were still 14.9% fewer barrels than the 16,897,000 barrels of crude that were being processed daily during the week ending January 3rd of last year, when US refineries were operating at 93.0% of capacity…
Despite the increase in the amount of oil being refined, gasoline output from our refineries was lower for the 5th time in seven weeks, decreasing by 1,181,000 barrels per day to a seven month low of 8,010,000 barrels per day during the week ending January 1st, after our gasoline output had increased by 362,000 barrels per day over the prior week…and since our gasoline production was just beginning to recover from a multi-year low in the wake of this Spring’s covid lockdowns, that drop meant that this week’s gasoline output was 9.9% less than the 8,887,000 barrels of gasoline that were being produced daily over the same week of last year….on the other hand, our refineries’ production of distillate fuels (diesel fuel and heat oil) increased by 146,000 barrels per day to 4,785,000 barrels per day, after our distillates output had increased by 49,000 barrels per day over the prior week….but since it’s also just coming off a three year low, our distillates’ production was also 9.9% less than the 5,311,000 barrels of distillates per day that were being produced during the week ending January 3rd, 2019…
Even with the big drop in our gasoline production, our supply of gasoline in storage at the end of the week increased for the sixth time in eight weeks, for 11th time in 27 weeks, and by the most since the last week of April, rising by 4,519,000 barrels to 241,081,000 barrels during the week ending January 1st, after our gasoline inventories had decreased by 1,192,000 barrels over the prior week…our gasoline supplies increased this week because the amount of gasoline supplied to US users decreased by 687,000 barrels per day to a 32 week low of 7,441,000 barrels per day, and because our exports of gasoline fell by 28,000 barrels per day to 883,000 barrels per day, while our imports of gasoline fell by 156,000 barrels per day to 445,000 barrels per day….but even after this week’s increase, our gasoline supplies were 4.2% lower than last January 3rd’s gasoline inventories of 251,609,000 barrels, and near the five year average of our gasoline supplies for this time of the year…
With the increase in our distillates production, our supplies of distillate fuels increased for the 5th time in 6 weeks, for the 22nd time in the past year, and by the most since May 29th, rising by 6,390,000 barrels to 152,029,000 barrels during the week ending January 1st, after our distillates supplies had increased by 3,095,000 barrels during the prior week….our distillates supplies rose by more this week than last because the amount of distillates supplied to US markets, an indicator of our domestic demand, fell by 653,000 barrels per day to a 15 week low of 2,941,000 barrels per day, even as our imports of distillates fell by 317,000 barrels per day to 302,000 barrels per day and as our exports of distillates rose by 10,000 barrels per day to 1,232,000 barrels per day….after this week’s inventory increase, our distillate supplies at the end of the week were 13.9% above the 139,050,000 barrels of distillates that we had in storage on January 3rd, 2019, and about 4% above the five year average of distillates stocks for this time of the year…
Finally, with the decrease in our oil imports and the increase in our oil exports, our commercial supplies of crude oil in storage (not including the commercial oil being stored in the SPR) fell for the 19th time in the past thirty weeks but for just the 23rd time in the past year, decreasing by 8,010,000 barrels, from 493,469,000 barrels on December 25th to 485,459,000 barrels on January 1st.…but even after that big decrease, our commercial crude oil inventories were still about 9% above the five-year average of crude oil supplies for this time of year, and about 48% above the prior 5 year (2011 – 2015) average of our crude oil stocks as of the first weekend of January, with the disparity between those comparisons arising because it wasn’t until early 2015 that our oil inventories first topped 400 million barrels….since our crude oil inventories had generally been rising over the past two years, except for this autumn and during the past two summers, after generally falling over the year and a half prior to September of 2018, our commercial crude oil supplies as of January 1st were still 12.6% above the 431,060,000 barrels of oil we had in commercial storage on January 3rd of 2020, and also 10.4% more than the 439,738,000 barrels of oil that we had in storage on January 4th of 2019, and 15.7% above the 419,515,000 barrels of oil we had in commercial storage on January 5th of 2018…
This Week’s Rig Count
Note: Last week’s rig count was released on Wednesday, December 30th, ahead of the New Year’s weekend, so this week’s rig count covers 9 days…that said, the US rig count rose for the 16th time in the past seventeen weeks during the period ending January 8th, but for just the 18th time in the past 43 weeks, and hence it is still down by 54.6% over that forty-three week period….Baker Hughes reported that the total count of rotary rigs running in the US rose by 9 to 360 rigs this past week, which was still down by 421 rigs from the 781 rigs that were in use as of the January 10th report of 2020, and was also still 44 fewer rigs than the all time low rig count prior to 2020, and 1,569 fewer rigs than the shale era high of 1,929 drilling rigs that were deployed on November 21st of 2014, the week before OPEC began to flood the global oil market in their first attempt to put US shale out of business….
The number of rigs drilling for oil increased by 8 rigs to 275 oil rigs this week, after rising by 3 oil rigs the prior week, leaving us with 384 fewer oil rigs than were running a year ago, and still less than a fifth of the recent high of 1609 rigs that were drilling for oil on October 10th, 2014….at the same time, the number of drilling rigs targeting natural gas bearing formations was up by 1 to 84 natural gas rigs, which was still down by 35 natural gas rigs from the 119 natural gas rigs that were drilling a year ago, and just 5.2% of the modern era high of 1,606 rigs targeting natural gas that were deployed on September 7th, 2008…in addition to those rigs drilling for oil or gas, one rig classified as ‘miscellaneous’ continue to drill in Lake County, California this week, while a year ago there were three such “miscellaneous” rigs deployed…
The Gulf of Mexico rig count remained unchanged at 17 rigs this week, with 14 of those rigs drilling for oil in Louisiana’s offshore waters and three drilling for oil offshore from Texas…that was 4 fewer Gulf rigs than the 21 rigs drilling in the Gulf a year ago, when 19 Gulf rigs were drilling for oil offshore from Louisiana, one rig was drilling for natural gas in the Mississippi Canyon offshore from Louisiana, and one rig was drilling for oil offshore from Texas…since there are no rigs operating off of other US shores at this time, nor were there a year ago, this week’s national offshore rig figures are equal to the Gulf rig counts….however, in addition to those rigs offshore, two rigs continue to drill through inland bodies of water this week, one in St Mary parish in southern Louisiana and the other in Chambers County, Texas, just east of Houston, while a year ago there was just one rig drilling on US inland waters..
The count of active horizontal drilling rigs was up by 7 to 320 horizontal rigs this week, which was still 378 fewer horizontal rigs than the 698 horizontal rigs that were in use in the US on January 10th of last year, and less than a quarter of the record of 1372 horizontal rigs that were deployed on November 21st of 2014…at the same time, the directional rig count was up by 1 to 22 directional rigs this week, but those were still down by 23 from the 45 directional rigs that were operating during the same week a year ago….in addition, the vertical rig count was up by one to 18 vertical rigs this week, and those were also still down by 20 from the 38 vertical rigs that were in use on January 10th of 2020….
The details on this week’s changes in drilling activity by state and by major shale basin are shown in our screenshot below of that part of the rig count summary pdf from Baker Hughes that gives us those changes…the first table below shows weekly and year over year rig count changes for the major oil & gas producing states, and the table below that shows the weekly and year over year rig count changes for the major US geological oil and gas basins…in both tables, the first column shows the active rig count as of January 8th, the second column shows the change in the number of working rigs between last week’s count (December 30th) and this week’s (January 8th) count, the third column shows last week’s December 30th active rig count, the 4th column shows the change between the number of rigs running on Friday and the number running during the count before the same weekend of a year ago, and the 5th column shows the number of rigs that were drilling at the end of that reporting week a year ago, which in this week’s case was the 10th of January, 2020..
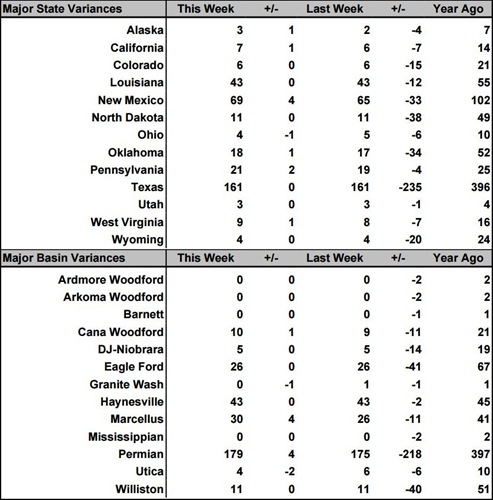
Ss you can see, there were more changes in drilling activity this week than recently, with two basins showing 4 rig increases…checking for the details on the Permian in Texas from the Rigs by State file at Baker Hughes, we find that there were no changes in any Permian Texas Oil District, which thus means that the 4 rigs that were added in New Mexico must have been added in the far west reaches of the Permian Delaware to account for the national Permian basin rig increase… since the rig count in all other Texas oil districts also remained unchanged, that means that the rig that was pulled out of the panhandle region Granite Wash basin came out of Oklahoma, which had a rig added in the Cana Woodford and in some other oil basin that Baker Hughes doesn’t aggregate at the same time…for natural gas seeking rigs, we had two rigs pulled out of the Utica shale, one from Ohio and one from Pennsylvania, while four rigs were added in the Marcellus, three in Pennsylvania and one in West Virginia…at the same time, a natural gas rig was pulled out of the Haynesville shale in DeSoto Parish, Louisiana, while an oil rig began drilling in nearby at the same time, in the first Haynesville shale oil drilling since November 2019…
NEXUS appeal puts eminent domain in the crosshairs – Land was improperly seized to make way for the NEXUS pipeline, according to lawyers for the city of Oberlin. City Council voted Monday to pledge another $18,500 toward its ongoing legal battle over the natural gas line. The funds will go to attorney Carolyn Elefant, who has filed for a rehearing of a case against the Federal Energy Regulatory Commission in the U.S. Court of Appeals for the District of Columbia Circuit. The case could potentially go to the U.S. Supreme Court, according to Oberlin Law Director Jon Clark. The city first retained Elefant in January 2016 as its representative in proceedings that ultimately led to NEXUS’ authorization. Now she will argue that the pipeline company’s use of eminent domain to take land from residents and other communities along its 257-mile path was improper. Clark said there is a question about whether eminent domain – using the court system to force sale of private property – could be used, since NEXUS may serve markets in Canada. The Natural Gas Act applies differently when exports are involved, he said. The city’s appeal will also focus on the safety of residents who live in the “impact zone” should there be an explosion, Clark said. Some on Reserve Avenue are within 50 feet of the pipeline. NEXUS’ impact on the environment will also play a role in the appeal, he said. FERC must balance environmental interests when authorizing energy projects. Clark said the NEXUS pipeline carries fracked gas, “and as everyone knows, fracking is a contributor to global warming.” The appeal is likely to take at least a year to reach oral arguments, Clark said. The NEXUS pipeline transports gas from eastern Ohio through Michigan. It does not extend into Canada. Oberlin’s suit claims the project “lack(s) any discernible public benefits” and “the adverse effects on landowners and communities are not outweighed by public benefits and that no public use justifies the exercise of eminent domain.”
Pennsylvania’s impact fee collection anticipated down 28% – Pennsylvania’s total impact fee for last year’s natural gas production is expected to be down 28% when it is collected in April, according to an estimate from the Independent Fiscal Office. The expected $144.85 million will make it the lowest amount for a year of natural gas production since the commonwealth imposed the impact fee in lieu of a severance tax on production in 2011. The previous record was $173 million in the midst of an industry downturn in the 2016. Most of the $55.9 million decline over 2019’s collections – which had been $200.4 million – was due to a sharp drop in NYMEX natural gas pricing and falling below the $2.25 mark. The average price last year was $2.08 per million British Thermal Unit, which because it was below $2.25 it dropped the fee schedule by $5,000 per well. It’s based on unconventional natural gas production of 7 billion cubic feet in Pennsylvania, up from 6.8 billion cubic feet in 2019. The fall in the impact fee collections will mean that the share going to counties and municipalities – many in southwestern Pennsylvania where drilling is among the heaviest in the state – will also fall. It’s estimated to drop from $109.2 million to $75.9 million. The Marcellus Legacy Fund, which also benefits local communities by paying for infrastructure and environmental projects, will also see a cut from $72.8 million to $50.6 million. The state’s share, $10.5 million for commonwealth agencies and $7.9 million for conservation districts, remain unchanged.
Lt. Gov. John Fetterman should stand with East Pittsburgh against fracking | Opinion – Fracking in Pennsylvania was one of the big stories of the presidential election. While Donald Trump attempted to whip up fears about a fracking ban here, the national media – with the help of leaders like Fetterman, who has sidestepped fracking as a “complicated” issue – often portrayed Pennsylvania as being strongly protective of the drilling industry. In such a telling, the fracking boom had created desperately needed jobs. However, the truth is that the supposed surge in fossil fuel employment has always been massively overstated. Before the dramatic drop in fossil fuel employment due to the pandemic, fracking accounted for just about 26,000 jobs in Pennsylvania – a far cry from the hundreds of thousands claimed by the drilling industry and pro-fracking politicians. Over the last few years, job growth in the clean energy industries has outpaced gas and coal. Our recent research shows that public investment in wind and solar manufacturing is a more efficient way to create local jobs than betting on a drilling-linked petrochemical boom.For many of us, the important stories about fracking right now are the local communities organizing to rein it in to protect their neighborhoods. It’s easy to understand why this is happening: mountains of evidence show how fracking harms our health, our air, and our water. People who live near fracking wells are more likely to suffer from increased asthma attacks, headaches, and severe fatigue, while recent studies point to lower birth weights and infant health problems in communities near wells. Fracking exacerbates air pollution problems like ground-level ozone and has been linked to hundreds of cases of water contamination or other drinking water impacts, as well as pollution of streams and rivers.The fracking well proposed right in Fetterman’s backyard could be even more dangerous. A New Mexico-based company called Merrion Oil & Gas proposed to drill a new fracking well in East Pittsburgh dangerously close to the densely populated communities of East Pittsburgh, Braddock, and North Braddock, which have all been forced to deal with a history of air pollution from the steel industry.This new fracking well proposal was set to be the next in a long line of environmental injustices that our region has faced – until the people of the Mon Valley simply said no. North Braddock Residents for Our Future have organized their friends and neighbors for years, and that hard work has paid off. In a poll of Democratic voters we commissioned in April to cover the region (where Democrats outnumber Republicans almost four to one), 70% opposed the well.
Corporate diligence topic of W&J energy webinar — Corporate responsibility in the natural gas industry will be the theme of the next virtual webinar presented by Washington & Jefferson College’s Center for Energy Policy and Management. Executives from two regional production companies – Carrie Crumpton of Southpointe-based CNX Resources and Will Jordan of EQT Corp. – will speak beginning at 11 a.m. Jan. 13. They will focus on responsibility and environmental, social and governance goals their companies have established while operating in the Marcellus and Utica shales, and elsewhere. Crumpton, a Washington resident, is responsible for permitting and reporting compliance at CNX, where she is vice president of Environmental Strategy & Permitting. She also is involved with strategy development for emerging issues and external stakeholder/regulatory engagement. Jordan is executive vice president and general counsel for EQT. Mason Gregory, a senior analyst for MFS Investment Management, also will participate. He specializes in environmental, social and governance topics, and will provide an overview of what they encompass. The free webinar is part of the CEPM’s Shale Gas Knowledge Hub initiative.
UGI to Acquire Mountaineer Energy, including West Virginia LDC, in Deal Valued at $540M – UGI Corp. said Monday it would acquire Mountaineer Energy Holdings LLC, which owns the largest natural gas local distribution company (LDC) in West Virginia, for an enterprise value of $540 million, including about $140 million of debt. The acquisition would hand UGI control of Mountaineer Gas Co., a single-state LDC adjacent to UGI’s existing utility footprint and the largest in West Virginia. UGI’s regulated utility rate base would climb by 14%, while customers served would increase by around 30%. Mountaineer serves close to 215,000 customers in 50 of West Virginia’s 55 counties. Ninety percent of the customer base is residential, with the remainder made up of commercial and industrial customers. Mountaineer has almost 6,000 miles of regulated distribution, transmission and gathering pipelines. “Over the past two years, we have indicated our intention to rebalance our business mix by investing more to build out our natural gas businesses,” UGI President John L. Walsh said. “This transaction is an important step in the rebalancing efforts and will support UGI’s long-term annual commitments” to grow earnings per share by 6-10% and dividends by 4%. “We see significant investment opportunities to continue, if not accelerate, the replacement of over 1,500 miles of bare steel pipelines and expand the reach of natural gas in West Virginia to both unserved and underserved areas,” Walsh said. “These investments will improve the safety and reliability of the distribution system and align with our environmental efforts” to lower methane and other greenhouse gas emissions. “We expect Mountaineer’s rate base to grow by a compound annual growth rate of approximately 10-12% over the long term.”
State tax collections dip in December as income, severance taxes come up short – West Virginia tax collections came up short in December, missing estimates of $386.76 million by $4.5 million, according to figures released by the Senate Finance Committee and the state Auditor’s Office. December revenue collections of $382.2 million also were down $46.03 million from December 2019 collections, as personal income taxes and severance taxes fell short of expectations. One of the two key pillars of state tax revenue, December income tax collections of $159.6 million came in $10.85 million under estimates, and were down $15.17 million from December 2019 collections. The other key revenue source, consumer sales taxes, met expectations, exceeding estimates of $130.2 million by $182,000. December severance tax collections on coal, oil and natural gas production came in at barely half of revenue estimates at $15.63 million. That was also down 62% from December 2019 collections of $42.95 million. At a budget briefing in October, Gov. Jim Justice noted that severance tax collections have shrunk to a point where they are no longer a major component of the state budget.
Atlantic Coast Pipeline restoration planned to start later in WV than other states – It died six months ago, and its burial will remain intact. That doesn’t mean the Atlantic Coast Pipeline will rest in peace anytime soon. The West Virginia wetlands and mountain ranges disturbed by the project won’t, either. The restoration plan that Atlantic Coast Pipeline LLC proposed in a filing with the Federal Energy Regulatory Commission made public Tuesday after developers canceled the $8 billion project in July amid legal and regulatory challenges details a nearly three-year time frame for concluding cleanup along the West Virginia portion of the pipeline route through Harrison, Lewis, Upshur, Randolph and Pocahontas counties. The pipeline would have transported natural gas supplies from West Virginia to public utilities in Virginia and North Carolina and was designed to span 600 miles. West Virginia will be the last of the three states to see cleanup and restoration begin, according to the plan. Cleanup is scheduled to begin in West Virginia in April 2022 and finish in December 2022, with a seeding and mulching phase taking place from May 2022 to January 2023 and a monitoring and maintenance phase lasting from May 2022 until November 2023. But in Virginia and North Carolina, all three phases are slated to start before the end of 2021. The project sequencing is mostly based on weather conditions, according to Aaron Ruby, media relations manager for Dominion Energy, which partnered with Duke Energy in developing and later canceling the project. “We’ll start in the south this fall and then make our way north the following spring once it’s warmer in West Virginia,” . The proposed later start for the Mountain State disappointed Angie Rosser, executive director of the West Virginia Rivers Coalition. The conservation group opposed the ACP, joining individuals and other environmental groups in voicing concerns about the impact of a 42-inch pipeline crossing through steep slopes, hundreds of streams and the Monongahela National Forest before continuing into Virginia and North Carolina. Rosser is also concerned about properly controlling erosion in the restoration effort. . “What we’ve seen in other pipelines even smaller than this one is land subsidence or landslides, a catastrophic effect,” Rosser said. “[It’s] not just a runoff effect but a whole side of a mountain running down into a stream. Stabilization and revegetation, it’s really important that it’s done and done quickly.” The restoration plan notes that work in steep West Virginia terrain may require cut-and-fill grading to create a flat surface for vehicles and equipment, a process that usually requires additional workspace and stabilization efforts.
Proposed Virginia rules may delay Mountain Valley natgas pipeline (Reuters) -Virginia environmental regulators have proposed stream-crossing rules that analysts say may delay startup of the Mountain Valley natural gas pipeline to 2022, but the companies involved said on Tuesday they were sticking with their late-2021 target. Natalie Cox, a spokeswoman at Equitrans Midstream Corp, one of the companies building the pipeline from West Virginia to Virginia, said the Mountain Valley team was aware of the revised state regulations but “remains confident in achieving its targeted in-service date of late 2021, at a total cost estimate of $5.8-$6.0 billion.” The Virginia Department of Environmental Quality (DEQ) released a letter this week that would bar gas pipes with a diameter of 36 inches (91.4 cm) or more from using the U.S. Army Corp’s proposed 2020 Nationwide Permits to cross streams. Mountain Valley, currently under construction, will use pipe 42 inches in diameter to transport 2.0 billion cubic feet per day of gas from the Marcellus/Utica shale formation in West Virginia, Pennsylvania and Ohio to Virginia. One billion cubic feet is enough to supply about 5 million U.S. homes for a day. Mountain Valley is one of several oil and gas pipes delayed in recent years by regulatory and legal fights with states and environmental groups that found problems with permits issued by the Trump administration. Instead of using the Nationwide Permit program, which would cover all stream crossings with one permit, the Virginia DEQ wants big gas pipes to seek individual stream-crossing permits, which analysts at Height Capital Markets said would likely push the in-service date for Mountain Valley into 2022. When construction of Mountain Valley started in February 2018, Equitrans estimated the 303-mile (487.6-km) pipe would cost about $3.5 billion and be completed by the end of 2018. Mountain Valley is owned by units of Equitrans, NextEra Energy Inc, Consolidated Edison Inc, AltaGas Ltd and RGC Resources Inc.
‘That Terrifies Me’: Trump Rule Allows Natural Gas Transport By Rail In Dense Areas – In an effort to boost natural gas exports, the Trump administration has reversed longstanding federal policy and approved transport of gas by rail anywhere in the country. Opposition has come from Hollywood stars, state attorneys general and local residents who worry about the danger this poses. But plans are moving ahead for a New Jersey project that calls for one of the longest such transport routes in the country: 200 miles through densely populated areas of the East Coast. The gas from Pennsylvania’s Marcellus Shale would first be sent by pipeline to a new liquefaction plant in the rural northeast part of the state. Refrigeration units would chill it to negative-260 degrees Fahrenheit, at which point it becomes liquid and easier to ship. The part of the plan that scares a lot of people is the next step – transporting the gas by truck or rail down the busy I-95 corridor to a planned export terminal along the Delaware River in Gloucester County, New Jersey. “That terrifies me,” says Vanessa Keegan, who lives nearby with her family, including her three-year-old son Theo. She points to where rail cars full of highly flammable liquefied natural gas – or LNG – would roll about a block and a half away from her house. “That train track that you could skip on down to in about a minute and a half.” A daycare center sits right next to the gate of the planned export terminal. Pipelines are the more common way to move gas long distances, but battles over them have delayed or even scrapped some projects. Trucks are also allowed to transport LNG. But using rail cars in densely populated areas had been limited until the new rule took effect in August. Even before that, Delaware River Partners, a subsidiary of New Fortress Energy, which has ties to President Trump, secured a special federal permit to move the LNG by rail. It allows two 100-car trains to transport the gas each day.In this rust-belt region of New Jersey the project does have support, including from building trade unions and powerful state lawmakers. State Assemblyman John Burzichelli says his grandfather worked at a shuttered DuPont dynamite plant that will house the planned LNG export terminal.
Opponents of New Fortress Energy’s LNG project in Gibbstown, N.J., hope Biden administration will stop project – The Washington Post – Environmental organizations have so far been unable to stop a proposed liquefied natural gas export terminal on the Delaware River but are hoping to find allies in the incoming Biden administration. The terminal, in the New Jersey community of Gibbstown, would receive liquefied natural gas from the fracking fields of northeastern Pennsylvania by train or truck and dispatch it to the Caribbean by ship.
Gas South’s Infinite Energy Acquisition Expands Southeastern Footprint – – Atlanta-based natural gas marketer Gas South said it has completed its takeover of Infinite Energy, creating the largest retail natural gas provider in the Southeast. With the acquisition, Gas South expects to double its annual revenue to $1 billion, providing natural gas to around 425,000 customers in Florida, Georgia, North Carolina and South Carolina. Gas South is owned by Cobb EMC, a nonprofit, member-owned electric cooperative. Cobb delivers to nearly 200,000 residential and commercial customers in Georgia’s Cobb, Bartow, Cherokee, Fulton, and Paulding counties. Under the terms of the deal that was announced in October, Gas South acquired Infinite’s wholesale and retail natural gas business and customer list, primarily in Georgia and Florida. Gas South expects to maintain a presence in Gainesville, FL, where Infinite is headquartered. The transaction did not include Infinite’s electricity business in Texas.
Disinterest In Appalachia Could Mean The Rise Of Haynesville Shale – Appalachia, without question, is the current king of dry gas production. The incredible rise in volumes from the Marcellus and Utica shale fundamentally changed the energy landscape in the United States permanently. For context, more than 40% of domestic natural gas production is sourced there, a percentage that has grown without fail, year after year, since horizontal drilling began in earnest. That has often led to some interesting questions, including where benchmark natural gas should be priced. Today, that continues to be via the Henry Hub in Louisiana. Does that small area in Louisiana deserve to be the de-facto benchmark price nationwide, particularly as the area is losing relevance? No doubt that at least for the Eastern United States, Henry Hub has little relevance compared to more local hubs. Perhaps there needs to be change. . For a multitude of reasons such as its proximity to nearly all current liquefied natural gas (“LNG”) export terminals and core industrial / commercial consumers along the Gulf Coast, Henry Hub has proven to be the more stable demand center. In-basin pricing issues, something I talked about in depth recently in its own focus article (“Appalachian Producers: Henry Hub Pricing Matters Less Than You Think“) has led to wide differentials and poor spot pricing in local Northeastern markets. With most Northeastern natural gas volumes being used in the production of electricity and for heating, the current warm winter has led to a lot instability.So much so that production curtailments have been a major thing, something nearly all Appalachian producers (Range Resources (RRC), Antero Resources (AR), EQT Corporation (EQT), Cabot Oil & Gas (COG)) have participated in to some degree. With wells being shut in, it’s also no surprise that permitting activity has tanked – which actually might be an understatement. Monthly permit issuance fell to levels not seen in more than a decade. After all, why would a producer file for permits to drill new wells if those very same producers are considering cutting existing volumes? While there’s a healthy backlog of drilled but uncompleted (“DUC”) wells to work through, this will have to change soon. Even the advances in technology which have boosted estimated ultimate recoveries (“EURs”) cannot offset this. Haynesville shale, located nearby to Henry Hub, has seen much more steady permitting interest. Better local demand, plus the benefit of a little less deluge of associated gas production from the major basins in Texas, has really helped boost the prospects for Haynesville shale in 2021. While there’s little chance of Haynesville overtaking production from its Appalachian competitor – current production is one third the rate – it could very well be the more stable basin in the coming years, perhaps even returning to incremental growth.
Natural Gas Futures Kick off New Year with Solid Gain; Spot Prices Jump — Natural gas futures advanced Monday – the first trading session of 2021 – building on the nearly 12-cent gain to finish last year, with U.S. liquefied natural gas (LNG) exports strong, production flat and the weather-driven demand outlook improved. The February Nymex gas futures contract settled at $2.581/MMBtu, up 4.2 cents day/day. March rose 3.5 cents to $2.561. NGI’s Spot Gas National Avg. climbed 18.5 cents to $2.625. Bespoke Weather Services said forecasts over the holiday weekend shifted “materially colder,” tacking on about 20 gas-weighted degree days to the outlook through mid-January. “While the 15-day period as a whole remains solidly warmer than normal, we have chipped away at a good deal of the warmth, and it is important, in our view, to note that the colder changes are focused over the next eight to 10 days,” Bespoke said. “This signals risk that models toward mid-month and beyond could again be too warm.” LNG volumes, meanwhile, hovered above 11 Bcf/d on Monday – near record levels – according to NGI data, while production levels were essentially even with a week earlier. EBW Analytics Group analysts said demand from destinations in both Europe and Asia for U.S. exports is holding strong. “With continued cold weather expected in Asia and Western Europe during the first two weeks of this year, prices at major global hubs continued to climb over the holidays and reached multi-year highs,” EBW said Monday. Demand, the analysts said, could further intensify in Europe. With “record European Union carbon prices discouraging coal use, poor performance by France’s nuclear fleet, Russian supply trailing 2019 levels and strong Asian demand diverting LNG cargoes away from Europe, European gas storage has begun to decline rapidly,” EBW said. Gas storage in Europe “could drop below five-year average levels by mid-January and end the winter several hundred Bcf below 2020 levels, buttressing injection-season demand for U.S. LNG.”
Natural Gas Futures Extend Early 2021 Gains Amid Winter Chill and Solid Export Demand – Natural gas prices spiked Tuesday, extending the gain made a day earlier to jumpstart 2021 trading, as weather models pointed to fresh bouts of cold air over the Midwest and East in the second half of January. The February Nymex gas futures contract jumped 12.1 cents day/day and settled at $2.702/MMBtu. March advanced 11.2 cents to $2.673. NGI’s Spot Gas National Avg. climbed again Tuesday, rising 8.5 cents to $2.710 after advancing more than 18 cents a day earlier. Midday weather models were not as bullish as those overnight, NatGasWeather said Tuesday, but they still favored chilly patterns across the central United States and into the eastern third of the country Jan. 17-20. “With this winter again playing out much warmer than normal so far, it’s critical colder air come through,” the firm said. Should freezing winter conditions ultimately pervade January, analysts expect that underground stockpiles of natural gas could decline quickly, particularly if demand of U.S. liquefied natural gas (LNG) remains elevated. LNG volumes held near 11 Bcf/d most of December, and they have remained close to that level this month amid robust export demand from destinations in Asia and Europe. EBW Analytics Group analysts said Tuesday the current gas surplus “may vanish entirely” by the storage week ending Jan. 14, “implying a tightening versus year-ago conditions of a startling 12.1 Bcf/d.” The year-over-year storage comparison has not been in a deficit since April 2019, EBW said. “It is possible that the emerging deficit may finally shock the gas market into recognizing the extent of tight underlying supply/demand balances,” the firm said. “Over the back half of winter, the storage trajectory may tighten by more than 600 Bcf versus year-ago levels.” Early 2021 advances in futures prices “are consistent with the market’s nascent recognition of long-term undersupplied conditions.” The Energy Information Administration (EIA) most recently reported a 114 Bcf withdrawal for the week ended Dec. 25. That fell on the bearish side of market expectations. Ahead of the report, major surveys had clustered around a pull in the mid-120s Bcf, while NGI had forecast a draw of 124 Bcf. Total working gas in storage fell to 3,460 Bcf, but it was still 251 Bcf above year-earlier levels and 206 Bcf above the five-year average. Early estimates for the week ended Jan. 1 call for a steeper withdrawal. Bespoke Weather Services, for example, modeled a 135 Bcf pull. Potentially adding to demand early this year is the still-raging coronavirus pandemic. With virus outbreaks widespread, more people are working from home and, as a result, cranking their gas-fired furnaces more hours of the day and fueling residential demand.
US working natural gas volumes in underground storage decline 130 Bcf: EIA | S&P Global Platts – US natural gas in storage fell by 130 Bcf last week, with an even larger draw likely for the week in progress due to continued strong LNG export demand coupled with production losses in Texas. Henry Hub futures remain stagnant, however, as the storage surplus looks to expand in the weeks ahead. Storage inventories decreased to 3.330 Tcf for the week ended Jan. 1, the US Energy Information Administration reported Jan. 7. The withdrawal was less than an S&P Global Platts survey of analysts calling for a 139 Bcf pull. Responses to the survey ranged from a 121 to 157 Bcf withdrawal. The pull was much stronger than the 48 Bcf draw reported during the same week last year as well as the five-year average withdrawal of 115 Bcf, according to EIA data. The draw also proved stronger than the 114 Bcf pull reported for the week prior. Gas prices were bid up this week heading into the EIA storage report as both the European and American ensemble weather models gained heating degree days for January compared with last week. In focus is the weakening of the polar vortex and the potential for a colder base state in the back half of the month. The NYMEX Henry Hub February contract slipped 4 cents to $2.68/MMBtu in trading following the release of the weekly storage report at 10:30 am ET. US supply and demand balances were tighter as HDDs increased 10% week on week. Colder weather pushed residential and commercial demand 4.1 Bcf/d higher week on week – leading to a 3.9 Bcf/d increase in total US demand relative to the prior week, according to S&P Global Platts Analytics. Higher demand was met with flat total supply, increasing the call on storage to balance. Storage volumes now stand 138 Bcf, or 4.3%, more than the year-ago level of 3.192 Tcf and 201 Bcf, or 6.4%, more than the five-year average of 3.129 Tcf. S&P Global Platts Analytics’ supply and demand model currently forecasts a 139 Bcf withdrawal for the week ending Jan. 8, which would increase the surplus to the five-year average by 22 Bcf. The week in progress has seen balances loosen as milder weather pushed residential and commercial demand 3.8 Bcf/d lower week on week – leading to US demand declines of 2.5 Bcf/d. Lower demand was met with higher total supply gains of 600 MMcf/d week on week as LNG exports and net Canadian imports rose 200 and 300 MMcf/d, respectively. Sample storage withdrawals for the US retracted just 4.6% for the week in progress, dropping to 52.2 Bcf from 54.7 Bcf, according to Platts Analytics. Every region across the US, except for the Midwest, saw a reduced call on storage. The East and Pacific samples led the declines, falling by 2 and 3 Bcf, respectively, largely as a result of temperatures climbing 3 degrees Fahrenheit in both regions, dampening demand.
Warmer Weather Outlook Snaps 2021 Win Streak for Natural Gas Futures – Natural gas futures faltered on Friday, ending a five-day streak of positive finishes. Traders focused on a shift in weather forecasts that pointed to a potential delay in the onset of widespread freezing temperatures from early in the third full week of January to later in the month. The February Nymex gas futures contract settled at $2.700/MMBtu, down 2.9 cents day/day. March shed 3.5 cents to $2.656.NGI’s Spot Gas National Avg. eked out a modest gain, rising 1.5 cents to $2.780.Bespoke Weather Services said Friday its latest outlook drifted warmer than forecasts earlier in the week. “This not only has warmed up the nearer-term outlook but has delayed the attempt in the 11- to 15-day to generate a true cold air mass up in Canada,” the firm said. “The market is clearly tiring from the can getting kicked down the road. We do still think a colder period can come late month, but damage to the bull weather case is being done by virtue of this nearer-term warming, for now.”Bespoke said the latest forecast overshadowed reports of flat production and continued robust demand for liquefied natural gas (LNG) exports. LNG volumes on Friday were above 11 Bcf and near record levels for a fourth consecutive day, according to NGI data. Frigid temperatures and low domestic supplies in Asia are propelling strong demand for U.S. LNG. Markets entered January anticipating strong heating demand in January, following relatively mild conditions in December. Analysts say harsher winter temperatures in the Lower 48 are needed to complement export demand and drive steady, steep declines in gas stockpiles over the next several weeks.The U.S. Energy Information Administration (EIA) on Thursday reported a withdrawal of 130 Bcf from storage for the week ended Jan. 1. Though substantial, it was shy of the mid-130s Bcf decrease forecast in major polls. The latest withdrawal reduced inventories to 3,330 Bcf, yet stocks remained above the year-earlier level of 3,192 Bcf and above the five-year average of 3,129 Bcf. Analysts at Tudor, Pickering, Holt & Co. (TPH) estimated a roughly 2 Bcf/d oversupplied market for the period based on historical degree day correlations.
U.S. LNG exports set another record in December – U.S. exports of liquefied natural gas (LNG) set a new record in December after a record-breaking November 2020, averaging 9.8 billion cubic feet per day (Bcf/d), according to the U.S. Energy Information Administration (EIA) estimates based on the shipping data provided by Bloomberg Finance, L.P. U.S. LNG exports in December were more than three times higher than the reduced export levels in the summer of 2020.Several factors have contributed to higher levels of U.S. LNG exports in recent months. LNG demand increased due to colder-than-normal winter temperatures in key Asian LNG-consuming markets. Moreover, supplies of LNG decreased because of unplanned outages at LNG export facilities in Australia, Malaysia, Qatar, Norway, Nigeria, and Trinidad and Tobago. Reduction in LNG supply led to higher international natural gas and LNG prices in Asia and Europe, attracting higher volumes of flexible LNG supplies from the United States.From April to July 2020, natural gas and LNG prices in Asia and Europe have declined to all-time historical lows, which affected economic viability of flexible U.S. LNG exports and led to numerouscargo cancelations. Prices began to recover in August, and by December, prices have more than quadrupled compared to the low levels of the summer months. The JKM price benchmark (representing spot and forward LNG prices in Japan, South Korea, Taiwan, and China) averaged $10.82 per million British thermal units (MMBtu) in December 2020, and the TTF – a key European price benchmark – averaged $5.80/MMBtu. By the end of December, JKM prices continued to increase and reached $15.10/MMBtu on December 31, 2020 – the highest level in the last seven years, according to pricing data provided by S&P Global Platts.Since mid-October, natural gas and LNG prices in global spot and futures markets have exceeded prices in crude oil-indexed long-term LNG contracts. Although deliveries under long-term contracts (which account for 70% of global LNG trade) have been increasing since September 2020, supply shortages caused by unplanned outages at various LNG export facilities worldwide reduced contractual export volumes. Higher global prices and reduced exports under term contracts resulted in higher export volumes of flexible LNG, particularly from the United States. The majority of U.S. LNG export contracts do not have fixed destinations in contractual clauses, allowing exporters of U.S. LNG to ship it on a spot and short-term basis to the highest-priced markets worldwide. Since June 2020, more than 50% of U.S. LNG exports went to countries in Asia, about 30% to countries in Europe, and the remaining volumes to countries in the Middle East, Africa, and Latin America, according to the U.S. Department of Energy’s LNG Reports and EIA’s data for November 2020. EIA expects U.S. LNG exports to remain at record-high levels this winter. In the December 2020 Short Term Energy Outlook (STEO), EIA forecasts that U.S. LNG exports will average 9.5 Bcf/d in the first quarter of 2021 and 8.5 Bcf/d on an annual basis this year, a 30% increase from 2020.
DOE Continues Push, Extends Another Five LNG Export Licenses – The U.S. Department of Energy (DOE) has extended another five long-term liquefied natural gas (LNG) export licenses through 2050 in a last minute push by the Trump administration to execute on a policy change it implemented last year. “The Trump Administration and DOE have delivered on our commitment to ensure that U.S. LNG holds a prominent place in the global energy market,” said DOE Secretary Dan Brouillette. “The 2050 policy and subsequent extended authorizations lock in the long-term benefits of U.S. LNG exports and provide yet another way to support the success of U.S. LNG exporters abroad.”The authorizations issued on New Year’s Eve extend the export terms of Kinder Morgan Inc.’s Elba Island LNG terminal operating in Georgia and the Cameron LNG facility operating in Louisiana. DOE also extended the export terms of the proposed 6.5 million metric tons/year Annova LNG project under development on the Brownsville Ship Channel in Texas and two small-scale liquefaction terminals in Florida. Eagle LNG Partners currently operates one of those plants just outside Jacksonville and has proposed another for Jacksonville. The approvals extend each project’s long-term LNG export authorizations to non-free trade agreement (FTA) countries through Dec. 3, 2050.In an effort to strengthen and promote natural gas exports, the Trump administration in July extended export authorizations to non-FTA countries through 2050. From 2011 until the policy change was implemented in July, the DOE limited such licenses to 20 years. Last month, the department extended seven long-term LNG export licenses after completing another 10 extensions in October.
Permian Basin natural gas pipeline goes into service, connects to markets on Gulf Coast » Albuquerque Journal – = A major pipeline to transport natural gas out of the Permian Basin to market went into service at the start of 2021, as the fossil fuel markets continued to show gradual signs of recovery from an historic collapse last spring created by the COVID-19 health crisis.The Permian Highway Pipeline, owned by Kinder Morgan, went into full service on Jan. 1, delivering natural gas from the Waha Hub on the Texas side of the Permian to Katy, Texas near Houston with connections to the refinery and export markets on the Gulf Coast.The pipeline was in operation for several weeks ahead of full commercial service while capacity was being commissioned by shippers.More: Hearings begin on New Mexico’s proposed oil and gas methane venting and flaring rulesADVERTISEMENTSKIPFully subscribed, the Permian Highway Pipeline brought about 2.1 billion cubic feet per day of transport capacity for natural gas, which could improve takeaway in the region – known as one the U.S.’ and the world’s most prolific shale plays – and see a reduction in releasing excess gas through venting or flaring.Kinder Morga Natural Gas Midstream President Sital Mody said the project’s completion would provide an economic boon for Texas and the Permian Basin region which straddles West Texas and southeast New Mexico, as the basin continues to provide vast fossil fuel resources in the coming decades.”We are extremely pleased to have placed (the Permian Highway Pipeline) in service. We are very proud of our team’s ability to execute and that we were able to complete this critical infrastructure project in the midst of a global pandemic,” Mody said.”(Permian Highway Pipeline) will continue to provide environmental benefits and economic value to the State of Texas for many years to come.”More: New Mexico oil and gas industry condemns Deb Haaland nomination as secretary of interiorHe said once the COVID-19 health crisis subsides and the fossil fuel market stabilizes, the pipeline will allow the company and other operators to capitalize on any future booms in production.”We believe that the Permian Basin will remain an important supply basin for decades, and our strong network of pipelines provides the ability to connect this supply to critical markets along the Gulf Coast,” Mody said.
Permian Highway Pipeline Commences Full Commercial In-Service to Gulf Coast -Kinder Morgan Inc. (KMI) on Monday announced that the Permian Highway Pipeline (PHP) began full commercial in-service on Jan. 1, delivering natural gas from the Waha in West Texas to the Katy area near Houston, with connections to the Gulf Coast and Mexico markets.The pipeline, which has multiple ownership interests but is operated by KMI subsidiary Kinder Morgan Texas Pipeline (KMTP), is fully subscribed under long-term contracts. KMI said PHP provides approximately 2.1 Bcf/d of natural gas capacity, helping to reduce gas flaring in the Permian Basin.The new pipeline had been flowing volumes during the commissioning process for several weeks prior to full commercial in-service, KMI said. “We believe that the Permian Basin will remain an important supply basin for decades, and our strong network of pipelines provides the ability to connect this supply to critical markets along the Gulf Coast.” In addition to EagleClaw, shippers include Apache Corp. and XTO Energy Inc., a subsidiary of ExxonMobil Corp. The pipeline is Kinder’s second out of the Permian. Gulf Coast Express went into service in September 2019. Kinder was planning a third Permian pipeline, prior to the Covid-19 pandemic, but the pandemic-induced oil market collapse of 2020 delayed those plans. RBN Energy LLC analysts, however, have noted that by late 2020 Permian production had generally recovered from the depths reached last summer.
Crude Exports Begin from Second Deepwater Dock at South Texas Gateway Terminal – Crude oil exports have begun from the second deepwater dock at the South Texas Gateway (STG) terminal, according to Buckeye Partners LP, the terminal’s 50% owner. With the second dock now complete, STG can accommodate the simultaneous berthing and loading of two very large crude carrier (VLCC) vessels, Buckeye said last Wednesday. STG is in Ingleside, at the mouth of the Corpus Christi Ship Channel in South Texas. Subsidiaries of Phillips 66 Partners LP and Marathon Petroleum Corp. each hold 25% stakes in STG. The terminal’s marine facilities are now fully operational, with construction of storage facilities set to conclude by the end of March, Buckeye said. Once fully operational, STG would boast 8.6 million bbl of petroleum products storage capacity, with the potential to expand to 10 million bbl. CEO Sean Strawbridge of the Port of Corpus Christi, added, “As Texas moves into the next phase of economic recovery from the Covid-19 pandemic, partnerships like those between the Port of Corpus Christi and its customers such as STG are critical to the continuance of American leadership in the global energy marketplace.” U.S. petroleum exports averaged 3.63 million b/d for the week ended Dec. 25, up from 3.1 million b/d in the previous week, the Energy Information Administration said in its latest Weekly Petroleum Status Report. However, the figure was down from 4.46 million b/d in the comparable week a year ago. Rystad Energy is forecasting that the global crude oil market will remain oversupplied through April 2021, before swinging to a supply deficit the following month as the Covid-19 vaccine is distributed and pandemic restrictions are eased.
Double E Natural Gas Pipeline Wants OK to Construct 1.35 Bcf/d Permian-to-Gulf Coast Conduit – Natural Gas Intelligence The owners of the Double E natural gas pipeline have asked federal regulators for permission to begin construction on the 135-mile Permian Basin conduit.In a Monday filing, Double E Pipeline LLC asked FERC to approve the start of construction by Friday. The Federal Energy Regulatory Commissionauthorized the pipeline in October.Project backer Summit Midstream Partners LP sanctioned Double E in June 2019, with an eye on moving 1.35 Bcf/d from the Permian’s Delaware sub-basin to the Waha hub in West Texas and beyond.The midstreamer moved forward with the project after securing “sufficient” binding commitments for long-term, firm transportation service. Summit Permian Transmission LLC held an open season for Double E in 2018 to test support for service to various receipt points in New Mexico’s Eddy and Lea counties and the West Texas counties of Loving, Ward, Reeves and Pecos. From Waha, the system plans to connect with “multiple current and planned takeaway pipelines” to demand centers south, according to Summit. It also secured a joint venture (JV) agreement with ExxonMobil, an anchor shipper on the project with a 30% stake in the project. ExxonMobil’s XTO Energy Inc. and Summit teamed up in 2017 to develop and operate an associated gas gathering and processing system to serve Permian operators in New Mexico. Double E would be among a handful of other pipeline projects aimed at transporting supply out of the once-constrained Permian. Kinder Morgan Inc. brought the Gulf Coast Express pipeline into service in September 2019 and the Permian Highway Pipeline online Jan. 1. The 2 Bcf/d Whistler project, backed by MPLX LP, WhiteWater Midstream and a JV between Stonepeak Infrastructure Partners and West Texas Gas Inc., would be the third greenfield project out of the basin when it comes online in the summer. Meanwhile, once a heavily constrained market, the Permian now has spare capacity, and Double E’s in-service would add to the competition among pipelines vying for molecules.
185 Texas workers laid off from metal supplier – Boomerang Tube LLC has laid off 185 workers at its plant in Liberty, Texas, according to a notice sent to state officials Thursday. The company, a maker and shipper of pipes and tubing for oil and natural gas companies, said, “Boomerang does not know if this layoff will exceed six months or otherwise result in an ’employment loss’ as defined by the Worker Adjustment and Retraining Notification Act.” Chesterfield, Missouri-based Boomerang Tube’s manufacturing operations are located at plants in Houston and Liberty. Before the layoffs, the company employed more than 340 people at the two Texas plants, including more than 235 in Liberty. Boomerang in Liberty laid off 50 salaried employees and 135 hourly workers. Liberty is located about 40 miles northeast of Houston.
US oil, gas rig count slips by 1 to 406; Permian posts 6-rig loss – The US oil and gas rig count slipped by one to 406 in the week week ending Jan. 6, rig data provider Enverus said, with the Permian Basin posting a six-rig loss in the biggest change of all major basins. As industry looks forward to a more stable year following a 2020 thrashed by the pandemic and low crude prices, rigs in the Permian of West Texas/New Mexico fell to 176 to start 2021, dialing activity back to month-ago levels. Still, Permian activity rose in December to average 181 rigs, besting the November average of 165, even with holiday fallbacks in the basin’s rig count. “The Permian dropping a few rigs this week isn’t going to shift the scale of [the basin’s] production,” said analyst Andrew Cooper of S&P Global Platts Analytics. “However, over the past few weeks their recovery has slowed, which might be hinting at a trend possibly developing. “With price-to-drilling lag time at something like eight weeks – the price goes up, rigs usually take one to three months to react – it will be interesting to see what $50/b WTI does for West Texas operators, but we won’t see a response likely until February or March.” WTI was $50.60/b Jan. 6, up $2.20 on the week, according to S&P Global Platts data, crossing the $50/b threshold for the first time since February 2020. WTI Midland was $52/b, and Bakken Composite was $47.70/b, both up $2.50 on the week. Gas prices averaged $2.70/MMBtu at Henry Hub and $2.30/MMBtu at Dominion South on Jan. 6, each up 30 cents on the week, Platts data shows. US upstream operators’ rig fleets held pretty steady in the past week, with just a few gaining or losing a rig. Much-watched ExxonMobil gained one rig this week, for a total of 12, after steadily shedding rigs for months in 2020 as the pandemic’s impacts worsened. The major had as many as 70 rigs running in January 2020.
US oil, gas rigs fall six to 407, ending 2020 50% lower year on year: Enverus – The US oil and gas rig count fell by six to 407 in the week ended Dec. 30 as 2020 ended with activity down slightly more than 50% from the prior-year point, rig data provider Enverus said. Total oil rigs dropped by seven to 293 on the week, while total gas rigs rose by one to 114. The number of horizontal rigs, which generally indicate high-producing shale/unconventional formations, was up by five to 335. At end-2019, before the pandemic set in, 840 rigs were operating in the US. But even as rig activity ended 2020 at a much lower level than where it began, total oil and gas rigs were up 30% in Q4 from Q3. The industry’s confidence has been buoyed with new vaccines against the coronavirus pandemic beginning to be distributed. The current week’s drop in rigs, which followed a decrease of one rig in the prior week, comes after what was otherwise a streak of weekly adds that began in October at a time when US operators, concerned about their output targets, began boosting activity. Consequently, the current decreases may just be seasonal noise, according to analyst Andrew Cooper of S&P Global Platts Analytics. In fact, Platts Analytics sees the rig count rising in 2021 to around 630 by December 2021, Cooper said. In fact, Platts Analytics sees the shale rig count, which currently averages about 410 and excludes conventional rigs, rising in 2021 to around 630 by December. Other analysts generally agree that the direction is up for not only total rigs but horizontals. “Looking ahead to 2021, our initial outlook calls for roughly 400 horizontal rigs working by the end of the year versus [335] horizontal rigs which are active today,” investment bank Tudor Pickering Holt said in a Dec. 28 investor note. In response to the pandemic, upstream operators reined in activity, cutting back drilling rigs and slashing capital spending. As a result, the 836 US oil and gas working across the US at the start of 2020 dropped sharply starting in March as the pandemic’s impact began to be felt in the form of plummeting crude demand and oil prices. Oil prices especially have recovered from March, when levels in the high $40s/b plunged to half that level by the end of month and later to the $20s/b and teens. For the week ended Dec. 30, WTI averaged $48.03/b, up a penny on week; while WTI Midland averaged $49.07/b, up 14 cents; and the Bakken Composite price averaged $44.86/b, up 10 cents, according to S&P Global Platts.
Permian, Marcellus Totals on Rise as US Rig Count Surges – Amid large gains in the Permian Basin and the Marcellus Shale, the U.S. rig count surged 9 units higher to 360 for the period ending Friday (Jan. 8), according to the latest weekly numbers published Friday by oilfield services provider Baker Hughes Co. (BKR). shale rigs Jan 8 The rise in domestic drilling included an increase of eight oil-directed rigs, along with one natural gas-directed unit. The combined U.S. count ended the week 421 rigs behind the 781 rigs active a year ago, according to the BKR numbers, which are based on data provided in part by Enverus. Land drilling increased by nine rigs week/week, while the Gulf of Mexico held steady at 17 rigs, down from 21 a year ago. Horizontal units increased by seven, while one directional unit and one vertical unit were also added. The Canadian rig count surged 58 units higher to 117 for the week, still lagging the 203 rigs active at this time last year. Gains included 35 oil-directed units and 23 gas-directed. The combined North American rig count ended the week at 477, versus 984 in the year-ago period. Broken down by major play, the Permian added four rigs to grow its total to 179, versus 397 a year ago. The Marcellus also posted a net increase of four rigs, upping its total to 30, versus 41 a year ago. Also among plays, the Cana Woodford added one rig for the week, while the Utica Shale dropped two rigs and the Granite Wash declined by one. Among states, New Mexico led with an increase of four rigs on the week, while Pennsylvania added two and Alaska, California, Oklahoma and West Virginia each added one. Ohio posted a net decrease of one rig for the period, BKR data show. News from Saudi Arabia early in the week provided oil markets with an injection of optimism, as the leader of the Organization of the Petroleum Exporting Countries revealed plans to cut oil production by 1 million b/d in February and March. “If there is one way to describe what its voluntary cut means for the market, ‘happy hour’ is a pretty fitting term,” Still, U.S. energy executives remain wary about the outlook for the oil and natural gas markets this year, and are relying on moderate commodity prices as they finesse their 2021 capital spending plans, according to the latest quarterly survey conducted by the Federal Reserve Bank of Dallas.
U.S. crude stockpiles tumble last week; 2020 fuel demand slumps – EIA (Reuters) -U.S. crude oil stockpiles fell sharply last week while fuel inventories rose, the Energy Information Administration said on Wednesday, and 2020 came to a close with a sharp decline in overall demand due to the coronavirus pandemic. Fuel demand was impaired as well. Overall motor gasoline product supplied, a proxy for demand, dropped by 8.5% to 7.4 million bpd. Overall product supplied fell 12% on the year, and jet fuel consumption slumped by 43%. “The story for the next several months will be how quickly demand will recover in light of the vaccine rollout,” said Andrew Lipow, president of Lipow Oil Associates in Houston. U.S. gasoline stocks rose by 4.5 million barrels last week, the biggest increase since April, the EIA said, ahead of expectations for a 1.5 million-barrel rise. Distillate stockpiles, which include diesel and heating oil, rose by 6.4 million barrels, versus expectations for a 2.3 million-barrel rise. Refinery crude runs rose by 89,000 bpd in the week, with utilization rates up 1.3 percentage points to 80.7% of capacity, their highest since August. “We’ve burned through a lot of crude oil to make a lot of product, and there’s no demand for the product,”
Canada pressing Michigan to avert shutdown of pipeline critical to fuel needs in Ontario and Quebec – The Canadian Chamber of Commerce warns of significant disruption to fuel supplies to Canada’s two most populous provinces if the Enbridge Line 5 pipeline ceases operation this spring. Line 5 carries petroleum from Western Canada through Great Lakes states to Ontario, where much of the crude is turned into gasoline and other fuels before the remainder is shipped via the Line 9 pipeline to Quebec refineries. In November, Michigan Governor Gretchen Whitmer, citing the risk of an oil spill, announced she would revoke an easement granted in 1953 that allows Line 5 to cross the Straits of Mackinac, a waterway in her state. “This has got very serious ramifications,” Joe Comartin, the Canadian government’s consul-general in Detroit, said in an interview. He noted the pipeline’s waterway crossing received a “clean bill of health” from the U.S. Department of Transport’s Pipeline and Hazardous Materials Safety Administration last year. Aaron Henry, senior director of natural resources and sustainability at the Canadian Chamber of Commerce, this country’s biggest business lobby group, said the fate of Line 5 “needs to be on the table” in conversations between the Canadian government and the incoming U.S. administration of president-elect Joe Biden. He said consumers in Ontario and Quebec would “see an increase at the gas pumps” if the shutdown persists. Without this pipeline, Ontario would be about 45-per-cent short of the crude oil it requires, according to Enbridge Inc. Line 5s supply is used, among other things, to produce gasoline and diesel for Ontario as well as 100 per cent of the jet fuel used at Pearson International Airport. The pipeline from Michigan is also a critical source of supply for the Line 9 pipeline that runs from Ontario to Quebec and provides 40 per cent to 50 per cent of the crude oil that is used by Quebec refineries to make gasoline and other fuels. Mr. Henry said a shutdown could cause significant layoffs of refinery jobs in Sarnia, Ont., and would also be a blow to Western Canadian crude producers. “It would not only hurt Alberta, but Saskatchewan would find it very challenging to transport its crude.” Analysts say a shutdown would force Ontario and Quebec to find other sources of crude oil for refining and import this petroleum by rail or truck or ship – a potentially more dangerous and environmentally damaging method of transport.
Ojibwe bands ask for halt on Line 3 construction –The Red Lake and White Earth Bands of Ojibwe have asked the Minnesota Court of Appeals to pause the ongoing construction of the Line 3 oil pipeline replacement project until lawsuits challenging the project’s approval can be heard. The bands, along with several nonprofit groups and the Minnesota Department of Commerce, have filed lawsuits challenging the project in both federal and state court. But construction has already begun in earnest on the pipeline, which stretches for more than 300 miles across northern Minnesota. More than 3,000 people from around the country are currently working on the project, with another thousand expected to join them soon. The tribes argue that if a stay is not granted to temporarily stop construction, then their lawsuits will be “pointless and moot,” because they anticipate that the state appeals court would not issue a final order on their legal challenges until July 2021. At that point, construction on Line 3 would likely be largely completed. Enbridge began work on the pipeline on Dec. 1, and has said it anticipates that construction will take six to nine months. Even if pipeline opponents prevailed in court, and state utility regulators were required to hold additional proceedings on the merits of the project, “the outcome of new hearings to determine the need for the pipeline, or to properly analyze its environmental effects before selection of a route, would have no practical purpose,” the tribes say in their brief to the court. The Minnesota Public Utilities Commission approved Line 3 – for a second time – earlier this year, when it approved a revised environmental analysis of the pipeline’s impacts, and granted the project a Certificate of Need and route permit. . Earlier this month the PUC rejected a similar request from project opponents for a construction stay, concluding that “the risks of continuing to transport oil through existing Line 3 are greater than those caused by construction and operation of the project.” The current pipeline is corroding and requires extensive maintenance. Enbridge has argued – and regulators have agreed – that it’s safer for the environment, and will reduce the risk of potential oil spills, to replace the pipeline with a new pipe along a different route across northern Minnesota. The new pipeline will also allow Enbridge to nearly double the amount of oil it currently transports through Line 3. But opponents argue the project exposes new areas of water-rich northern Minnesota to risks of an oil spill, and also would greatly exacerbate the impacts of climate change by transporting nearly 800,000 barrels of heavy Canadian oil every day to refineries in the Midwest and Gulf Coast. The Red Lake and White Earth bands argue that construction of Line 3 would destroy their “treaty-protected interest” in the land, waters, plants and animals, as well as their “cultural and religious rights.”
Forest Service finalizes grassland oil leasing plan; conservationists raise concerns – The U.S. Forest Service has finalized a plan designating where oil wells can be built within 845,000 acres of the Little Missouri National Grassland, a broad swath of western North Dakota that encompasses much of the Badlands. The plan offers protections for sage grouse, rare plants and bighorn sheep during lambing season, but conservationists are frustrated by a provision allowing oil wells near roads in certain pristine areas. The decision and accompanying Supplemental Environmental Impact Statement were released earlier this month and apply to land where the federal government owns both the surface and mineral rights. Those parcels are a patchwork, intermixed with state and private land where the new provisions do not apply. “What prompted this process was the recognition of changes in the pace and type of oil and gas development here in North Dakota,” Grasslands Supervisor Bennie South said. “It’s an attempt to try to balance being productive with the resources we have but sustaining those resources and grasslands for the American people so the people can come out and enjoy those lands.” The supplemental EIS process took place over the course of eight years, after horizontal drilling and hydraulic fracturing ushered in the Bakken oil boom more than a decade ago. The Forest Service and the U.S. Bureau of Land Management both play a role in oil leasing. Conservationists say they were surprised by a provision that emerged this past summer in the EIS allowing for oil well pads within a quarter-mile of existing roads in what are known as “inventoried roadless areas” where new roads generally cannot be built. “It obviously got me riled up, and it’s gotten a lot of people riled up,” said Dave Pieper, a former grasslands supervisor who retired in 2011 after a lengthy career in the Forest Service. Some of that land, he said, “is the best of what’s left, and there’s not much left.” Badlands Conservation Alliance members often camp, hunt and bird watch in the grassland. “A lot of our members really appreciate the remoteness and natural beauty and being able to get away,” Executive Director Elizabeth Loos said. “Being able to get away from oil and gas is important to members.””We go all over and it’s not a great experience when you’re camping and you hear a pump jack all night,”
My tribe holds a funeral every week for people killed by fossil fuels. This isn’t progress – it’s environmental genocide – My grandfather was eight years old when he was walked at the point of a bayonet from South Dakota with his parents and grandparents. Hundreds of tribes were forced to walk along many “Trails of Tears” nationwide. Millions did not survive the journey, but the devastation of spirit and culture remains part of our genetic memory. So too, does our ancestral knowledge of living in balance with the Earth and philosophy of caring for the next seven generations to come. Fast forward to today. The “Land Back” movement is gaining mainstream recognition, and racist statues and sports team names are disappearing. Amid this progress, however, the Trump administration, state governments and the fossil fuel industry are attempting the largest Indigenous land grab since the 1830 Indian Removal Act. On top of this, the climate clock is running out as Americans continue to reel under the continuing saga of the election and rising deaths from Covid-19. Under the cover of pandemic and anxious for a last gasp, the fossil fuel industry is striking deals for control of Indigenous lands with the outgoing Trump administration, and his GOP allies in Congress. From the Arctic refuge to the Bayou, it is nothing new to Native peoples that so much oil and gas activities are placed on or near tribal land, contaminating soil, rivers, aquifers and air while adding to the climate crisis and directly impacting community health. We are considered “sacrifice communities”.Oklahoma has become a fossil-fuel dependent state. Today it is home to the world’s largest convergence of aging oil and gas pipelines and thousands of manmade earthquakes owing to fracking. In my small Ponca tribe, we hold a funeral nearly every week from fossil fuel-related illnesses. All our families have multiple cases of asthma, cardiovascular disease and industry-specific cancers. Our wells are so polluted our tribe must now buy water. Our land is so toxic, organic food can’t be grown within 16 miles. They call it economic progress. We call it environmental genocide.
Multiple tribes protest drilling of 5,000 oil and gas wells in Wyoming – A landmark decision delivered by the Trump administration late last month gives five oil and gas companies the green light to forge ahead in drilling 5,000 wells over the next decade in northeastern Wyoming. Though cheered by state officials and industry groups, leaders of several tribal nations with enduring ties to the land remain concerned the development will compromise air and water quality, violate existing treaty rights and destroy cultural resources. The Oglala Sioux Tribe maintains that U.S. regulators “failed their duty” to uphold federal law and properly consult with tribes, calling the environmental reviews associated with the project “deficient,” according to recent protests. The U.S. Bureau of Land Management issued a final record of decision for the Converse County oil and gas project on Dec. 23. The order followed the BLM’s completion of a roughly seven-year environmental analysis and allows for year-round drilling on federal leases in Converse County. Yet, the southern Powder River Basin carries significant meaning for over a dozen tribes with extensive history in the region. The colonization of the area by white settlers displaced Indigenous people onto reservations in the 19th century, severing them from their land. But cultural resources and sacred sites in the region remain. Multiple treaties also grant tribes rights to the land. Rivers within the project area serve as an important water source for the Oglala Sioux Tribe, among other tribes of the Sioux Nation. Many tribal members said they fear the worst for the land, headwaters and cultural history in the region if drilling occurs at the scale proposed by the team of operators. The BLM’s record of decision approves the construction of up to 5,000 oil and natural gas wells, 1,500 multi-well pads and hundreds of miles of gas and water pipelines, along with roads, electrical lines and other infrastructure on federal leases in the Powder River Basin. The operator group plans to use a variety of drilling techniques within the 1.5 million acre project area, cutting through federal, state and private minerals. About 53,000 acres, or 3.5% of the total area, are expected to sustain surface disturbance. Wyoming lawmakers have expressed sustained and ardent support for the Converse County oil and gas project. It promises to bring up to 8,000 jobs and $18 billion to $28 billion in state and federal revenue, at a time when Wyoming’s fiscal outlook is dark.
TC Energy launches open season to add 80,000 b/d to base Keystone system in 2023 – TC Energy said Jan. 6 it is launching an open season to add 80,000 b/d of crude capacity to the existing Keystone Pipeline system no sooner than 2023. TC Energy, which already plans to add 50,000 b/d of capacity to Keystone this year, would then initiate the extra contracts and volumes in 2023 to coincide with the planned completion of the Keystone XL Pipeline. If President-elect Joe Biden rejects the Keystone XL project as promised, TC Energy could still add the 80,000 b/d to the existing pipeline system in 2023 or beyond, or simply cancel the expansion. TC Energy said it wants to replenish the existing Keystone pipeline from Hardisty, Alberta, to Pakota, Illinois, once volumes are switched over to the proposed Keystone XL Pipeline. But this approach would still allow for some capacity expansion even if the Keystone XL project is killed or, at least, delayed until after the Biden presidency. Last year, outgoing President Donald Trump issued a permit to allow the existing Keystone system to expand its capacity from the current 590,000 b/d of heavy Canadian crude oil up to 760,000 b/d. At some point in 2021, TC Energy plans to up the capacity to 640,000 b/d, and the addition of another 80,000 b/d would eventually bring the system to 720,000 b/d even without Keystone XL. If it is not canceled, the $8 billion Keystone XL pipeline project would move up to 830,000 b/d of heavy Canadian crude ultimately to Texas through the entire Keystone system. The 1,200-mile XL pipeline from Alberta to Nebraska would connect to the existing Keystone system. With the cancelation of Keystone XL the most likely scenario under Biden, the new open season appears to be a reaction to low crude oil demand in the current environment and the optimism that crude consumption should rise after 2023, said Sandy Fielden, director of oil research at Morningstar. Keystone XL is also competing with Enbridge’s Line 3 replacement project, which is slated for completion in the fourth quarter of 2021. The $6.75 billion Line 3 project would increase crude pipeline capacity from 370,000 b/d now up to 760,000 b/d as it moves Canadian crude from Alberta to Superior, Wisconsin. The pipeline runs more than 1,000 miles, including its largest 337-mile segment in Minnesota. The competing pipelines are key pending projects that would serve as larger arteries to move more heavy crude oil from Canada to Midwestern US and, ultimately, to the major refining corridor along the US Gulf Coast.
.
include(“/home/aleta/public_html/files/ad_openx.htm”); ?>


