by rjs, MarketWatch 666
 Here are some selected news articles from the week ended 02 January 2021. Part 2 is available here.
This is a feature at Global Economic Intersection every Monday evening or Tuesday morning.
Please share this article – Go to very top of page, right hand side, for social media buttons.
Oil ends 2020 down 20%; natural gas ends up 15%; oil exports at 40 week high
Oil prices ended higher for the eighth week in the past nine this week, as a new stimulus bill and a weaker dollar supported prices…after falling 2.1% to $48.24 per barrel last week as a new mutant strain of the coronavirus spreading in the UK worried traders that it would hurt demand for energy, the contract price of US light sweet crude for February delivery rose more than 1% early on Monday after Trump signed the Covid stimulus bill, backing down from his earlier threat to block the $2.3 trillion package, but resumed their slide of the prior week by the afternoon on worries about how the new variant of the Covid-19 would impact demand for energy to end the day down 61 cents at $47.62 a barrel…but oil prices opened higher on Tuesday on progress on a final Brexit deal, which would stabilize trade between Europe and the UK, and finished with a gain of 38 cents at $48.00 a barrel on hopes that a larger pandemic aid payment to US consumers would spur fuel demand and stimulate economic growth…oil prices opened higher again on Wednesday after a bigger-than-anticipated draw from U.S. crude inventories was reported late Tuesday by the American Petroleum Institute, but then fluctuated between gains and losses even after the EIA data showed a larger-than-expected drop in U.S. crude inventories, before settling 40 cents higher at $48.40 a barrel, with gains limited by the detection in Colorado of the more contagious variant of the coronavirus that causes Covid-19…oil then traded in a narrow range in light trading on New Years Eve before settling 12 cents higher at $48.52 a barrel, thus posting a 0.6% gain on the week…while finishing the month of December 6.6% higher, oil contracts still lost more than a fifth of their value in 2020, as lockdowns to combat the coronavirus depressed economic activity and sent oil markets reeling…
Natural gas prices also ended slightly higher in volatile trading this week, as prices first tumbled, and then rallied, on swings in the weather outlook…after falling 6.7% to $2.518 per mmBTU last week as the weather turned milder and inventory withdrawals failed to meet expectations, the contract price of natural gas for January delivery opened more than 8% lower on Monday and quickly fell to an 11% loss on weather models that suggested temperatures for much of the country could be well above normal for early January, before recovering a bit to close down 8 1/2% at $2.305 per mmBTU…but almost as quickly as it fell, the January Nymex natural gas futures contract rebounded sharply ahead of its expiration on Tuesday to post a 7% gain at $2.467 per mmBTU, as robust LNG demand took center stage…now quoting the contract price of natural gas for February delivery, which had ended last week at $2.512 per mmBTU and fell 18 cents monday before bouncing back11.8 cents Tuesday, natural gas prices fell 2.2 cents to $2.422 per mmBTU on Wednesday on a continued bearish weather outlook and a slip in LNG demand, before jumping 11.7 cents or nearly 5% higher to $2.539 per mmBTU on Thursday despite a bearish storage report, after weather models flipped colder for the next couple of weeks and gas production dipped back below 90 billion cubic feet per day ..natural gas price quotes thus finished the week 0.8% higher, with the February contract showing a 1.0% gain, as natural gas prices posted their strongest year since 2016…
The natural gas storage report from the EIA for the week ending December 25th indicated that the quantity of natural gas held in underground storage in the US decreased by 114 billion cubic feet to 3,460 billion cubic feet by the end of the week, which still left our gas supplies 251 billion cubic feet, or 7.8% higher than the 3,209 billion cubic feet that were in storage on December 25th of last year, and 206 billion cubic feet, or 6.3% above the five-year average of 3,254 billion cubic feet of natural gas that have been in storage as of the 25th of December in recent years….the 114 billion cubic feet that were drawn out of US natural gas storage this week was less than the average forecast of a 123 billion cubic foot withdrawal from an S&P Global Platts survey of analysts, but it was higher than the average withdrawal of 105 billion cubic feet of natural gas that have typically been pulled out of natural gas storage during the same week over the past 5 years, and much more than the 87 billion cubic feet withdrawal from natural gas storage seen during the corresponding week of 2019….
The Latest US Oil Supply and Disposition Data from the EIA
US oil data from the US Energy Information Administration for the week ending December 25th indicated that because of a decrease in our oil imports and another increase in our oil exports, we had to withdraw oil from our stored commercial supplies for the 16th time in the past twenty-three weeks and for the 22nd time in the past fifty weeks …our imports of crude oil fell by an average of 238,000 barrels per day to an average of 5,326,000 barrels per day, after risng by an average of 140,000 barrels per day during the prior week, while our exports of crude oil rose by an average of 526,000 barrels per day to a forty week high of 3,625,000 barrels per day during the week, which meant that our effective trade in oil worked out to a net import average of 1,701,000 barrels of per day during the week ending December 25th, 764,000 fewer barrels per day than the net of our imports minus our exports during the prior week…over the same period, the production of crude oil from US wells was reportedly unchanged at 11,000,000 barrels per day, and hence our daily supply of oil from the net of our trade in oil and from well production totaled an average of 12,701,000 barrels per day during this reporting week…
US oil refineries reported they were processing 14,287,000 barrels of crude per day during the week ending December 25th, 273,000 more barrels per day than the amount of oil they used during the prior week, while over the same period the EIA’s surveys indicated that a net of 866,000 barrels of oil per day were being pulled out of the supplies of oil stored in the US….so based on that reported & estimated data, this week’s crude oil figures from the EIA appear to indicate that our total working supply of oil from net imports, from storage, and from oilfield production was 719,000 barrels per day less than what our oil refineries reported they used during the week…to account for that disparity between the apparent supply of oil and the apparent disposition of it, the EIA just inserted a (+719,000) barrel per day figure onto line 13 of the weekly U.S. Petroleum Balance Sheet to make the reported data for the average daily supply of oil and the data for the average daily consumption of it balance out, essentially a balance sheet fudge factor that they label in their footnotes as “unaccounted for crude oil”, thus suggesting that there must have been an error or errors of that magnitude in the oil supply & demand figures that we have just transcribed….however, since most everyone treats these weekly EIA figures as gospel and since these numbers often drive oil pricing and hence decisions to drill or complete wells, we’ll continue to report them as published, just as they’re watched & believed to be accurate by most everyone in the industry….(for more on how this weekly oil data is gathered, and the possible reasons for that “unaccounted for” oil, see this EIA explainer)….
Further details from the weekly Petroleum Status Report (pdf) indicate that the 4 week average of our oil imports slipped to an average of 5,698,000 barrels per day last week, which was 14.4% less than the 6,657,000 barrel per day average that we were importing over the same four-week period last year…..the 866,000 barrel per day net withdrawal from our crude inventories was due to a 866,000 barrels per day withdrawal from our commercially available stocks of crude oil, while the oil supplies in our Strategic Petroleum Reserve remained unchanged….this week’s crude oil production was reported to be unchanged at 11,000,000 barrels per day because the rounded estimate of the output from wells in the lower 48 states was unchanged at 10,500,000 barrels per day, while a 2,000 barrels per day decrease to 512,000 barrels per day in Alaska’s oil production had no impact on the rounded national total…last year’s US crude oil production for the week ending December 27th was rounded to 12,900,000 barrels per day, so this reporting week’s rounded oil production figure was 14.7% below that of a year ago, yet still 30.5% more than the interim low of 8,428,000 barrels per day that US oil production fell to during the last week of June of 2016…
Meanwhile, US oil refineries were operating at 79.4% of their capacity while using those 14,287,000 barrels of crude per day during the week ending December 25th, up from 78.0% of capacity during the prior week, but excluding the covid collapse earlier this year and the 2005, 2008, and 2017 hurricane-related refinery interruptions, still one of the lowest refinery utilization rates of the past twenty-eight years….hence, the 14,287,000 barrels per day of oil that were refined this week were still 17.3% fewer barrels than the 17,283,000 barrels of crude that were being processed daily during the week ending December 27th of last year, when US refineries were operating at 94.5% of capacity…
With the increase in the amount of oil being refined, gasoline output from our refineries was higher for the 2nd time in six weeks, increasing by 362,000 barrels per day to 9,191,000 barrels per day during the week ending December 18th, after our gasoline output had increased by 307,000 barrels per day over the prior week…but since our gasoline production is still recovering from a multi-year low in the wake of this Spring’s covid lockdowns, this week’s gasoline output was still 9.7% less than the 10,173,000 barrels of gasoline that were being produced daily over the same week of last year….at the same time, our refineries’ production of distillate fuels (diesel fuel and heat oil) increased by 49,000 barrels per day to 4,639,000 barrels per day, after our distillates output had decreased by 14,000 barrels per day over the prior week….but since it’s also just coming off a three year low, our distillates’ production was 12.7% less than the 5,311,000 barrels of distillates per day that were being produced during the week ending December 27th, 2019…
Even with the increase in our gasoline production, our supply of gasoline in storage at the end of the week decreased for the second time in seven weeks and for 16th time in 26 weeks, falling by 1,192,000 barrels to 237,754,000 barrels during the week ending December 25th, after our gasoline inventories had decreased by 1,125,000 barrels over the prior week…our gasoline supplies decreased this again week because the amount of gasoline supplied to US users increased by 106,000 barrels per day to 8,128,000 barrels per day, and because our exports of gasoline rose by 154,000 barrels per day to 911,000 barrels per day, while our imports of gasoline rose by 30,000 barrels per day to 601,000 barrels per day….after this week’s decrease, our gasoline supplies were 2.4% lower than last December 27th’s gasoline inventories of 242,472,000 barrels, but still about 1% above the five year average of our gasoline supplies for this time of the year…
Meanwhile, with the modest increase in our distillates production, our supplies of distillate fuels increased for the 4th time in 15 weeks, and for the 22nd time in the past year, rising by 3,095,000 barrels to 152,029,000 barrels during the week ending December 25th, after our distillates supplies had decreased by 2,325,000 barrels during the prior week….our distillates supplies rose this week because the amount of distillates supplied to US markets, an indicator of our domestic demand, fell by 580,000 barrels per day to 3,594,000 barrels per day, and because our imports of distillates rose by 175,000 barrels per day to 444,000 barrels per day, while our exports of distillates rose by 29,000 barrels per day to 1,222,000 barrels per day….after this week’s inventory increase, our distillate supplies at the end of the week were 13.7% above the 133,720,000 barrels of distillates that we had in storage on December 27th, 2019, and about 6% above the five year average of distillates stocks for this time of the year…
Finally, with the decrease in our oil imports and the increase in our oil exports, our commercial supplies of crude oil in storage (not including the commercial oil being stored in the SPR) fell for the 18th time in the past twenty-nine weeks but for just the 22nd time in the past year, decreasing by 6,065,000 barrels, from 499,534,000 barrels on December 18th to 493,469,000 barrels on December 25th.…but even after that big decrease, our commercial crude oil inventories were still about 11% above the five-year average of crude oil supplies for this time of year, and about 50% above the prior 5 year (2010 – 2014) average of our crude oil stocks as of the last weekend of December, with the disparity between those comparisons arising because it wasn’t until early 2015 that our oil inventories first topped 400 million barrels….since our crude oil inventories had generally been rising over the past two years, except for this autumn and during the past two summers, after generally falling over the year and a half prior to September of 2018, our commercial crude oil supplies as of December 25th were still 14.8% above the 429,896,000 barrels of oil we had in commercial storage on December 27th of 2019, and also 11.8% more than the 441,418,000 barrels of oil that we had in storage on December 28th of 2018, and 16.3% above the 424,463,000 barrels of oil we had in commercial storage on December 29th of 2017…
This Week’s Rig Count
Note: This week’s rig count was released on Wednesday ahead of the New Year’s weekend, just as last week’s rig count was released on Wednesday ahead of Christmas, which thus means that this week’s count still covers 7 days, albeit not the usual 7 days ending on a Friday…that said, the US rig count rose for the 15th time in the past sixteen weeks during the period ending December 30th, but for just the 17th time in the past 42 weeks, and hence it is still down by 55.7% over that forty-two week period….Baker Hughes reported that the total count of rotary rigs running in the US rose by 3 to 351 rigs this past week, which was still down by 445 rigs from the 769 rigs that were in use as of the January 3rd report of 2020, and was also still 53 fewer rigs than the all time low rig count prior to this year, and 1,578 fewer rigs than the shale era high of 1,929 drilling rigs that were deployed on November 21st of 2014, the week before OPEC began to flood the global oil market in their first attempt to put US shale out of business….
The number of rigs drilling for oil increased by 3 rigs to 267 oil rigs this week, after rising by 1 oil rig the prior week, leaving us with 403 fewer oil rigs than were running a year ago, and still less than a sixth of the recent high of 1609 rigs that were drilling for oil on October 10th, 2014….at the same time, the number of drilling rigs targeting natural gas bearing formations remained unchanged at 83 natural gas rigs, which was still down by 40 natural gas rigs from the 123 natural gas rigs that were drilling a year ago, and just 5.3% of the modern era high of 1,606 rigs targeting natural gas that were deployed on September 7th, 2008…in addition to those rigs drilling for oil or gas, one rig classified as ‘miscellaneous’ continue to drill in Lake County, California this week, while a year ago there were three such “miscellaneous” rigs deployed…
The Gulf of Mexico rig count remained unchanged at 17 rigs this week, with 14 of those rigs drilling for oil in Louisiana’s offshore waters and three drilling for oil offshore from Texas…that was 5 fewer Gulf rigs than the 22 rigs drilling in the Gulf a year ago, when 20 Gulf rigs were drilling for oil offshore from Louisiana, one rig was drilling for natural gas in the Mississippi Canyon offshore from Louisiana, and one rig was drilling for oil offshore from Texas…since there are no rigs operating off of other US shores at this time, nor were there a year ago, this week’s national offshore rig figures are equal to the Gulf rig counts….however, in addition to those rigs offshore, two rigs continue to drill through inland bodies of water this week, one in St Mary parish in southern Louisiana and the other in Chambers County, Texas, just east of Houston, while a year ago there was just one rig drilling on US inland waters..
The count of active horizontal drilling rigs was up by 4 to 313 horizontal rigs this week, which was still 388 fewer horizontal rigs than the 701 horizontal rigs that were in use in the US on January 3rd of last year, and less than a quarter of the record of 1372 horizontal rigs that were deployed on November 21st of 2014…on the other hand, the directional rig count was down by 1 to 21 directional rigs this week, and those were also down by 30 from the 51 directional rigs that were operating during the same week a year ago….meanwhile, the vertical rig count was unchanged at 17 vertical rigs this week, and those were still down by 27from the 44 vertical rigs that were in use on January 3rd of 2020….
The details on this week’s changes in drilling activity by state and by major shale basin are shown in our screenshot below of that part of the rig count summary pdf from Baker Hughes that gives us those changes…the first table below shows weekly and year over year rig count changes for the major oil & gas producing states, and the table below that shows the weekly and year over year rig count changes for the major US geological oil and gas basins…in both tables, the first column shows the active rig count as of December 30th, the second column shows the change in the number of working rigs between last week’s count (December 23rd) and this week’s (December 30th) count, the third column shows last week’s December 23rd active rig count, the 4th column shows the change between the number of rigs running on Friday and the number running during the count before the same weekend of a year ago, and the 5th column shows the number of rigs that were drilling at the end of that reporting week a year ago, which in this week’s case was the 3rd of January, 2020..
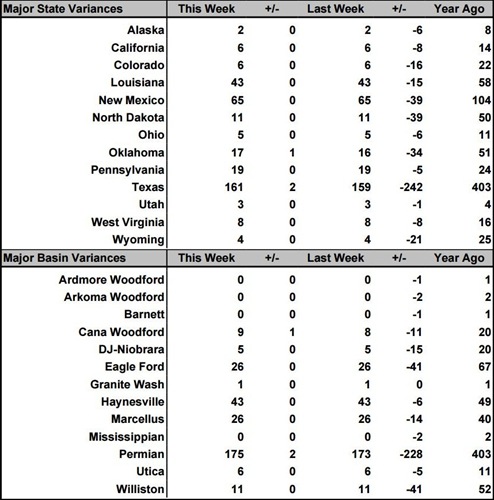
As you can see, there were only a few changes in drilling activity this week…checking for the details on the Permian in Texas from the Rigs by State file at Baker Hughes, we find that two rigs were added in Texas Oil District 8, which corresponds to the core Permian Delaware, while the rig count in all other Texas oil districts remained unchanged, which thus accounts for the total change in Texas and the 2 rig increase in the Permian…this week’s only other change is equally straightforward, as the rig that was added in Oklahoma was added in the Cana Woodford, thus accounting for the two other changes we see in the tables above…
Pennsylvania natural gas industry ends 2020 with fewer rigs drilling in Marcellus – Pennsylvania’s natural gas industry ends the year with a rig count not only around the lowest of 2020 but also well below where it started the year before the Covid-19 pandemic, oil price wars and overall economic turmoil turned everything upside down. There were an average of 18 rigs working in Pennsylvania in the middle of December, according to data from energy analysis firm Baker Hughes. That’s down from 25 at the same time last year before the pandemic and recession but smack dab in the middle of a glut in the natural gas industry that led to more production than the market needed and sustained low prices in the bargain. Pennsylvania is the country’s second-largest state for natural gas production, behind only Texas, as well as being the center of the Marcellus and Utica Shale boom of the past decade and a half. But production has been taking a hit over the past year as natural gas companies like EQT Corp. (NYSE: EQT) and CNX Resources Corp. (NYSE: CNX), among others, shut off the spigot at some of its gas wells temporarily as prices lagged. The strategy allows the drillers to produce less natural gas when the prices are low – and they were down to near historic lows in 2020 – and then turn it back on when they can get more in a higher price environment. Current production is only one part of the story. Natural gas wells are most productive in the first year or so after they become operational and older wells bring out less gas over time. A natural gas company must keep drilling new wells to maintain or increase production to take into account the older wells. For much of the past decade, that’s meant more wells being drilled and higher production year over year. But 2020 is already destined to have less production in the Appalachian basin, and most of the publicly traded drillers have made clear that they aren’t planning to do any more drilling in 2021 than is required to keep the same production as 2020. Jen Snyder, director at energy analysis firm Enverus, said that the discipline on holding the line in production is due to investors handing “religion and a prayer book” to drillers. That’s showing up in the rig counts. After starting the year at 25, it fell to 22 in May in the heat of the early pandemic and then dropped to 18 in September where it mostly stayed for the rest of the year even though the market signaled that prices could go over the $3 per million British Thermal Units that the drillers say they need to be stable. The rig count was only above 18 once, in November, since the late summer. And that was only two rigs drilling in Pennsylvania for a short time.
University of Pittsburgh receives contract to study health effects of fracking — The University of Pittsburgh Graduate School of Public Health will receive a $2.5 million contract from the state of Pennsylvania to study the health effects of hydraulic fracturing, or fracking. In recent years, dozens of cases of Ewing sarcoma, a rare bone cancer, and other childhood and young adult cancers have been identified in Washington, Greene, Fayette and Westmoreland counties, where shale gas sites are operating. The state Department of Health last year declined to designate Washington County, where six Ewing sarcoma cases had occurred in the Canon-McMillan School District area, as a cancer cluster. Residents were dissatisfied with those results, which only included three of the six cases in the investigation. In March of 2020, the Department of Health published a four-county report on the number childhood cancer cases. “We have heard the concerns from families and community members impacted by cancer and other health issues in the southwestern part of the state, and we are dedicated to taking the proper steps to keep our residents healthy,” Secretary of Health Dr. Rachel Levine said. Pitt Public Health will be conducting two observational epidemiological studies focusing on known or suspected health effects of hydraulic fracturing. One study will be led by Dr. Evelyn Talbott, professor of epidemiology at Pitt Public Health and director of the Environmental Epidemiology section, who has over 35 years of experience conducting cancer and other health effects studies in Southwestern Pennsylvania and abroad. She will investigate the relationship between hydraulic fracturing and the development of childhood cancers in Southwestern Pennsylvania. “I grew up in Washington County, and one of my first epidemiology investigations at Pitt involved a health study of thyroid cancer among those living near a uranium mill tailings site,” Talbott said. “So this investigation holds both personal and professional significance to me. I am committed to community inclusion and openness as we go forward in our endeavor to learn the facts.” The other study, led by the director of Pitt Public Health’s Center for Occupational Biostatistics and Epidemiology and Research Associate Professor of Biostatistics, Dr. Jeanine Buchanich, will aim to replicate earlier studies on acute conditions, such as asthma and birth outcomes, using data from Southwestern Pennsylvania.
Celebs Protest Fed Approval of Liquid Natural Gas Facility Near Philly – A liquid natural gas facility near Philadelphia got the go-ahead from a federal agency, resulting in a big thumbs-down from some very famous environmental activists.The Delaware River Basin Commission (DRBC) recently approved a construction permit for the Gibbstown Logistics Center in Gloucester County, NJ, which will be capable of handling exports of liquified natural gas. The project from New Fortress Energy involves transporting the gas from the Marcellus Shale across Pennsylvania to the terminal using 100-car trains that activists have called “bomb trains.”Pennsylvania State Sen. Katie Muth, who represents Philadelphia’s suburbs, likened the trains to “the energy of the Hiroshima bomb” in a tweet opposing the project.A flurry of statements from environmental groups came out after Wednesday’s ruling, including one from actor Mark Ruffalo who recently starred in a movie about contaminated water in West Virginia calling the commission’s decision “shameful.” Ruffalo and fellow actor and activist Leonardo DiCaprio were among the signatories on a letter to Govs. Phil Murphy (D-NJ), Andrew Cuomo (D-NY), John Carney (D-DE), and Tom Wolf (D-PA) opposing the terminal. The governors serve as ex-officio members of the Commission and appoint alternates to represent them.The letter argued that the project violates the “strict water quality laws and regulations for toxic” chemicals, and the commission should hold off on voting until President-elect Joe Biden takes offices. The U.S. Army Corps of Engineers, which is also represented on the Commission, previously approved the project as has the New Jersey Department of Environmental Protection.Ruffalo issued a statement calling the decision “shameful” and put the governors on notice. “We will not stand by and let our leaders deceive us in this way,” he said. “We will hold them accountable. And we will replace them.”
Gas-fired Electricity Advances Across Most U.S. Regions Over Past 5 Years, EIA Says -Natural gas-fired electricity generation jumped across all but one U.S. region over the past five years, and the trend continued through November 2020, according to the latest U.S. Energy Information Administration (EIA) Power Plant Operations Report. U.S. natural gas power plants boosted electricity generation by 31% in the Northeast, by 20% in the Central region, and by 17% in the South between 2015 and 2019, EIA said.Gas-fired electricity over the same period in the West declined 1%, dragged lower by a 29% drop in California, where solar-generated power is on the rise. The decline in California more than offset growth in the Northwest and Southwest subregions, according to the agency.Even in California, however, natural gas continues to play an important role. Output from gas-fired power plants in the state is often in high demand in the late afternoon and early evening “because solar power tends to peak and then plateau around midday, rapidly declining by the evening as the sun sets,” according to EIA.“As solar output declines, natural gas-fired generators often have to ramp up, or increase their output, considerably,” researchers said.Through November 2020, the Central, South, and Northeast regions each maintained levels of electricity from natural gas power plants on par with the level of the prior five-year period. The West was up modestly.Increased gas-fired generation reflects a boost in capacity, EIA said. Between 2015 and 2019, nearly 35 GW of net summer capacity entered service, an 11% increase during that period. Most of this new capacity was added in the Northeast region, the agency said.The largest increases in gas-fired generation were in the Northeast and Central regions, near the Appalachian natural gas production region of Ohio, Pennsylvania, and West Virginia. Affordable prices “made it more economical to generate electricity using natural gas instead of coal,” EIA said. “This trend has been most pronounced in regions with competition between coal and natural gas generators,” particularly in the Midcontinent area in the Central region and the PJM Interconnection in the Northeast. “When natural gas and coal are similarly priced on a cost-per-energy-content basis, most natural gas-fired generators can produce electricity more efficiently than coal-fired generators, providing an economic advantage in electricity markets,” EIA said.
Christmas Eve Decline Sets Stage for Natural Gas Futures’ Post-Holiday Crash – Natural gas traders on Thursday couldn’t be convinced to go long despite the extended Christmas holiday weekend, especially with the weather data turning milder with every run of the latest models. The January Nymex gas futures contract settled Christmas Eve at $2.518, down 9.0 cents. February slipped 7.6 cents to $2.512. Spot gas prices, which were for gas delivered through Monday, were mostly lower amid the mostly light holiday weekend demand outlook. However, a chilly, wet forecast in the Northeast sparked big gains there. NGI’s Spot Gas National Avg. ultimately climbed 9.0 cents to $2.780.. On Thursday, the few traders that hadn’t quite punched the clock were still digesting the latest storage inventory report. The Energy Information Administration (EIA) reported Wednesday that inventories fell 152 Bcf for the week ending Dec. 18, a pull that came in well short of the near 160 Bcf draw that the market had been expecting.Mobius Risk Group said the published withdrawal of 152 Bcf shows how fragile a market with a short-term memory and a long net speculative position can be. The inventory reduction was 5 Bcf more than the same week last year despite warmer temperatures, and importantly, South Central inventory posted the largest surplus reduction of all EIA regions.“This mattered little to a market which had begun to consider the possibility of a 160-170 Bcf-like withdrawal in the days leading up to the number,” Mobius said.Pausing for a moment and considering what the latest EIA figure implies for the remainder of withdrawal season is an important sanity check, according to Mobius. It’s also a valuable exercise for the producing and consuming community, the firm said.For producers, the fear that a price response like Wednesday’s can generate “feels like being locked outside on a snowy winter day with no shoes, no coat and no one home to unlock the door.” Consumers, on the other hand, may feel “cozily settled in front of the fire with little concern of what’s happening outside, and the perception that cheap fuel is as reliable as the sun rising in the East and setting in the West,” according to Mobius.
Natgas Plunges 10% On “Extremely Bearish” Warmer January Forecast — Natural gas futures are down more than 10% on Monday morning following new weather models that suggest warmer weather is ahead. Meteorologists at BAMWX show one model that suggests temperature anomalies for much of the country could be well above average for early January. For the next two weeks, heating degree days for US-Lower 48 will be below trend, suggesting warmer temperatures and a decline in energy use to heat homes. “I suspect, however, the forecast for January came out extremely bearish over the weekend, triggering the gap opening, but we’ll learn more about that on Monday. The big takeaway this week is likely to be that next week’s government report is going to show an average draw. Remember that professionals look at least two weeks ahead,” said FX Empire.
Natural Gas Futures Pummeled by Increasingly Warmer Weather Outlooks; Cash Sinks Too – Natural gas futures tumbled more than 20 cents lower in post-Christmas trading as weather data “failed miserably” over the weekend, shedding a hefty amount of demand from the 15-day outlook. With any opportunity for truly cold weather not expected before the middle of next month, the January Nymex gas futures contract settled Monday at $2.305/MMBtu, down 21.3 cents from last Thursday’s close. February plunged 18.6 cents to $2.326. Spot gas prices also tumbled, with widespread losses of 30.0 cents or more seen across the United States. NGI’s Spot Gas National Avg. fell 24.5 cents to $2.535. With the European weather data erasing more than 25 heating degree days from the long-range outlook, and the American model also backing off the projected demand in the early part of January, natural gas traders wasted no time in taking a hatchet to prices. The January Nymex contract opened Monday’s session at $2.311 and traded in a roughly 10.0-cent range before ultimately settling very close to where it started. After trending milder with several consecutive runs right before the Christmas holiday, the weekend weather data trended further milder, according to NatGasWeather. The Global Forecast System (GFS) lost 12 heating degree days (HDD), while the European model lost a heftier 25-plus HDDs. The midday GFS failed to add any “meaningful” demand, the forecaster said, with modest bouts of cooling into the United States over the next week but without widespread frigid cold. “What makes the coming pattern strongly bearish is the eight- to 15-day period favors mild conditions over most of the U.S. with continued only minor bouts of subfreezing temperatures into the northern U.S.,” NatGasWeather said. The firm expects the period is now “too bearish” and will likely add demand in time, “although it would need to be a hefty amount” in order to flip bearish weather sentiment to bullish, which isn’t expected. “We continue to look to Jan. 10-13 as the next best opportunity for more impressive/widespread cold.” Bespoke Weather Services said until the warmer momentum halts, it is difficult to say where a price bottom may be. There is still a healthy block expected to form by the middle third of January, aided by a strong warming in the polar stratosphere, according to the forecaster. However, the Pacific flow needs to slow down for this to send temperatures materially colder. “That is something that may happen in the back half of the month, enough to at least bring back some variability, but confidence is lower after seeing such a huge model bust over the last several days,” Bespoke said. The firm doesn’t see much risk/reward in being bearish, though it advised caution until the market clears the January contract’s expiration on Tuesday, as well as the holiday period, so that it can see how balances shape up once clear of any holiday impact. “It is worth noting that both Europe and Asia are seeing cold,” which should keep high liquefied natural gas (LNG) volumes in play for the foreseeable future, Bespoke said. “This low price environment should give power burns a boost as well into the new year.”
January Natural Gas Bounces Sharply Upon Expiration; Cool Blast Boosts Cash – On a day of heightened volatility, the January Nymex natural gas futures contract rebounded sharply ahead of expiration as robust liquefied natural gas (LNG) demand took center stage. Though a full recovery from Monday’s steep sell-off proved difficult, the January contract expired a whopping 16.2 cents higher at $2.467. The February contract, which takes over the prompt position on Wednesday, jumped 11.8 cents to $2.444. Spot gas prices were mixed, but several locations across the country posted double-digit gains. NGI’s Spot Gas National Avg. ultimately slipped 1.0 cent to $2.525. Whether Tuesday’s swift turnaround in the futures market is warranted is up for debate. That’s primarily because nothing much has changed on the weather front. The latest weather models still don’t show potential for sustained widespread cold until Jan. 12 at the earliest, according to NatGasWeather. The firm said the midday Global Forecast System model held a warmer-than-normal pattern for the coming 15 days, with only the western United States to see weather systems considered cold enough to induce stronger demand. Even then, any boost in demand would be marginal. “We continue to look to Jan. 12-15 as the next best opportunity for more impressive cold shots to arrive into the U.S., and it will need to if weather patterns are to finally take advantage of a tighter year over year supply/demand balance,” NatGasWeather said. The forecaster said Tuesday’s gains are likely because of other reasons, including the January contract’s expiration. “Or, it could simply be a technically oversold bounce after prices plummeted more than 30 cents in less than 24 hours of trading.” The ill-timed span of warm weather is set to occur as the clock ticks away on the remaining storage withdrawal season. When taking into account actual weather over the Christmas holiday, forecasted weather changes through Jan. 7, and newly instituted forecasts for Jan. 8-11, Mobius Risk Group said the change in the cumulative population-weighted heating degree days equates to the loss of roughly 175 Bcf of demand.
February Natural Gas Dips on Continued Bearish Weather Outlook, Slip in LNG Demand — A decline in liquefied natural gas (LNG) demand aided a small pullback in natural gas futures on Wednesday. With weather models stabilizing around a warm outlook for the first half of January, the new prompt February Nymex contract settled at $2.422/MMBtu, down 2.2 cents from Tuesday’s close. March slipped 1.7 cents to $2.422. Spot gas prices were mixed, but big losses on the East and West coasts left NGI’s Spot Gas National Avg. unchanged at $2.525.After some major price fluctuations during the first two trading sessions of the short holiday week, Wednesday’s more muted action along the Nymex futures curve offered traders a chance to digest the whirlwind swings. “As the market limps towards 2021, there are numerous questions in the air regarding the price path in the New Year and the fundamental factors that will be at play,” said Mobius Risk Group. With weather models offering little new insight into the January pattern, Thursday’s government storage report may be the next big price mover for the February contract.The Energy Information Administration (EIA) is scheduled to release its weekly inventory report at 10:30 a.m. ET Thursday. Analysts are expecting another larger-than-normal draw, with major surveys ahead of the report clustering around a pull in the mid-120s Bcf. Last week, EIA reported a 152 Bcf draw that lowered stocks to 3,574 Bcf, which is 278 Bcf above year-ago levels and 218 Bcf above the five-year average.
2020 Ends With Fireworks for Natural Gas Futures as Chillier Weather Models Trump EIA Data – Natural Gas Intelligence – Natural gas futures closed the book on 2020 with a bang after weather models flipped colder for the next couple of weeks and production dipped back below 90 Bcf/d. The February Nymex futures contract settled Thursday at $2.539, up 11.7 cents day/day. March climbed 10.4 cents to $2.526. Spot gas, which traded Thursday for delivery through Monday, was mostly lower on a lack of widespread cold in the near term. NGI’s Spot Gas National Avg. fell 8.5 cents to $2.440. New Year’s Eve action in the futures market started off on solid footing, with the February Nymex contract opening about a penny higher and climbing about 6.0 cents or so early in the session, ahead of Thursday’s government storage inventory report. The Energy Information Administration (EIA) report proved to be another disappointment, though, coming in with another lower-than-expected withdrawal. The EIA said inventories fell 114 Bcf for the week ending Dec. 25, about 10 Bcf below what the market had expected. Ahead of the report, major surveys clustered around a pull in the mid-120s Bcf, though estimates ranged widely from as low as 85 Bcf to as large as 150 Bcf. NGI had pegged the draw at 124 Bcf. Participants on The Desk’s online energy chat Enelyst attributed the big miss to several factors, including the Christmas holiday, the heavy wind penetration across the country during the reference week and Covid-19’s ongoing impacts on consumption. EIA recorded an 87 Bcf draw for the similar week last year, and the five-year average is a 102 Bcf draw. The EIA withdrawal included a 42 Bcf decline in Midwest inventories and a 34 Bcf decrease in East stocks, according to EIA. In the South Central, 21 Bcf was pulled from nonsalt facilities and 3 Bcf was drawn from salts. Total working gas in storage fell to 3,460 Bcf, which is still 251 Bcf above year-ago levels and 206 Bcf above the five-year average. Despite the hugely bearish EIA report, Nymex futures remained well in the green after the data was released. The February contract’s $2.429 intraday low was still a modest improvement from Wednesday’s settlement, and prices continued to gather momentum with each run of the American and European weather models. The latest European Centre (EC) model run, which already was quite a bit colder than the American Global Forecast System (GFS) model, added even more demand to the 15-day outlook. Specifically, it favors stronger weather systems with colder temperatures into the western United States, Southern Plains, Texas and the South during the Jan. 9-15 period.
US natural gas futures post best year since 2016 – US natural gas futures rose on Thursday, recording their best year since 2016, as forecasts for slightly colder weather and record liquefied natural gas (LNG) exports overshadowed a smaller-than-expected storage draw last week. Front-month natural gas futures for February delivery gained 11.7 cents, or 4.8%, to settle at $2.539 per million British thermal units. For the year, the contract is up 15.5%, its biggest yearly percentage rise since 2016. The US Energy Information Administration (EIA) said utilities pulled 114 billion cubic feet (bcf) of gas from storage during the week ended Dec. 25. That was less than the 125-bcf decline analysts forecast in a Reuters poll and compares with a decrease of 87 bcf during the same week last year and a five-year (2015-19) average withdrawal of 102 bcf. “While demand is not expected to change much over the next few days, lower supply and the potential for a colder second half of January is giving the market a lift (today),” said Robert DiDona of Energy Ventures Analysis. Data provider Refinitiv estimated 381 heating degree days (HDDs) over the next two weeks in the Lower 48 US states, up from Tuesday’s forecast of 371 HDDs. The normal is 461 HDDs for this time of year. HDDs measure the number of degrees a day’s average temperature is below 65 degrees Fahrenheit (18 degrees Celsius). The measure is used to estimate demand to heat homes and businesses. “Couple that insight with today being the last trading day of 2020 and we are seeing increased volatility early in the session,” DiDona added. However, Refinitiv projected average demand, including exports, would slip from 123.0 billion cubic feet per day (bcfd) this week to 117.8 bcfd next week. The amount of gas flowing to US LNG export plants, meanwhile, has averaged 10.7 bcfd in December, which would top November’s 9.8 bcfd record as rising prices in Europe and Asia in recent months have prompted global buyers to buy more US gas. Output in the Lower 48 has averaged 91.1 billion bcfd in December. That compares with a seven-month high of 91.1 bcfd in November 2020 and an all-time monthly high of 95.4 bcfd in November 2019./p>
LNG Market Readies for Swift Recovery— Liquefied natural gas traders anticipate a swift demand recovery in 2021 after a year in which the coronavirus pandemic prompted dramatic price swings. Colder weather in key importing nations, outages at major production hubs and congestion along global shipping routes already have combined to push spot prices in Asia to the highest level since 2014. That’s a more than sixfold jump from a record low in April, making Asian LNG the best performer among major commodities in 2020. Demand for the fuel used in heating and power generation is growing faster than for any other fossil fuel as nations look for a cheap, reliable and cleaner alternative to coal. The pandemic derailed that growth for 2020, but China and India are emerging as major sources of demand. “A lot of countries are looking to import LNG,” “I still think we are going to see growth in the LNG market.” Below are the key areas likely to shape the market in 2021: Global LNG imports in 2020 were roughly equal to the previous year, according to ship-tracking data compiled by Bloomberg. That was a big disappointment for an industry that has enjoyed 10% annual growth rate since 2016. However, global gas demand is expected to resume growth next year. LNG demand, which makes up roughly 10% of the total, may rebound even faster, depending on how Pakistan, India and Bangladesh perform, Shipments of the fuel into Asia have mostly recovered since the height of the pandemic, and the region’s LNG demand will rebound sharply next year, according to S&P Global Platts. On the last day of 2020, spot Asian LNG price – the Japan-Korea Marker benchmark – rallied above $15 per million British thermal units for the first time since April 2014. “It has been interesting to see how quickly Asian demand seems to have ramped up,” The picture in Europe is very different as countries grapple with a new surge of infections and lockdowns that sap energy demand. The continent is headed for a “very neutral recovery” in 2021, according to Satapathy. Europe mainly relies on storage and pipeline gas shipments, which may be boosted with flows from a new link from Azerbaijan and the controversial Nord Stream 2 project that’s nearing completion. Unplanned maintenance at LNG export facilities from Australia to Qatar to Malaysia has led to a tighter than expected market in the second half of the year. And delays in navigating the Panama Canal curbed supplies to Asia. If these disruptions persist well into the year, then prices could remain elevated well above current levels.
How The Fracking Revolution Is Killing the U.S. Oil and Gas Industry -After over a decade of the much-hyped U.S. fracking miracle, the U.S. oil and gas industry is having to deal with years of losses and falling asset values which has dealt the industry a serious financial blow. This is despite the fracking revolution delivering record oil and gas production for the past decade, peaking in 2019. While the pandemic has hurt the industry, companies have also benefited from excessive bailoutsfrom pandemic relief programs but these bailouts are a stop gap financial band-aid for the struggling industry.The oil and gas industry has always required huge amounts of money to explore for and produce oil and gas but up until now the industry made returns on those investmentsThe industry made a huge bet on fracking shale deposits to unleash the oil and gas reserves in that shale. It worked from a production standpoint; the industry produced record amounts of oil and gas. The difference is that, unlike traditional oil and gas production, the cost to produce fracked oil and gas was more than what the market was willing to pay for it.As a result, the U.S. fracking industry has lost over $300 billion. Fracking was supposed to be the future of the U.S. oil and gas industry – instead it has dealt the industry a major financial blow which has likely sped up the energy transition away from oil and gas towards a lower carbon future.In April 2018, while many were predicting a bright financial future for the U.S.fracking industry, DeSmog started a series on the finances of the fracking industry with the article, The Secret of the Great American Fracking Bubble. This article highlighted the huge losses by the U.S. fracking industry, which were around a quarter trillion dollars at the time.More than two years later the Washington Post ran an article on “Shale’s Bust” and updated the losses to-date to be $300 billion – noting that while the pandemic made things worse, “the sector’s weaknesses extend back many years.”In late 2019, before the pandemic hit, Chevron wrote off $11 billion, the majority of which was related to gas fracking assets.This trend continued in the industry in 2020 with historic write-downs of the industry’s remaining fracking assets, and in June, accounting firm Deloitte estimated the industry could soon write off $300 billion more. This is what the fracking revolution has done to the U.S. oil and gas industry: financial devastation.
Texas fracking billionaires drew Covid-19 aid while investing in rivals -As the coronavirus pandemic and low oil prices walloped US frackers this spring, Texas billionaires Dan and Farris Wilks got a $35 million relief loan to help one of their fracking companies stay afloat. At the same time, they were on a buying spree in the country’s oil patch.Since spring, businesses controlled by the Wilks brothers have hunted for deals among fracking firms going through bankruptcy and taken or increased stakes in at least six other companies, corporate filings show. But when it looked like the oil-and-gas industry would be shut out of a key pandemic lending program, they and others in the industry turned their attention to Washington, making an appeal for help in meetings with home-state senator Ted Cruz.The twin dynamics of acquisitions and government rescue show how the economic tumult caused by the pandemic has reshaped the landscape for a key US industry. But the industry was already under pressure from international competition and a sagging oil price by the time the pandemic hit, and its mounting woes prompted the Wilkses and others to turn to allies in Washington, including Mr. Cruz. The Republican senator helped convince the Trump administration and the Federal Reserve to change the rules for pandemic loans to ensure oil and gas firms could participate.Soon after the US government changed the rules of its lending program in April, a Wilks family company, ProFrac Holdings LLC, applied for and received a $35 million loan, federal records show. ProFrac, a supplier of pumping equipment and services, is just one slice of the sprawling portfolio of fracking businesses that the Wilks family owns in part or outright across the American West and Canada.The Wilks brothers are longtime financial backers of Mr. Cruz. The brothers donated $15 million to a super PAC called Keeping the Promise that championed Mr. Cruz’s 2016 presidential campaign, making them the largest financial backers of his political career. BailoutWatch, a nonprofit group that tracks pandemic aid to industry, said Mr. Cruz’s efforts to get relief for the oil-and-gas industry amount to a reward for a campaign contributor.“ProFrac’s loan is blatant misappropriation of taxpayer dollars,” said Chris Kuveke, an analyst for the organization, which has received funding from Climate Nexus, a group that advocates for clean energy. He said Mr. Cruz’s biggest political benefactors ended up receiving one of the relief program’s largest loans to the fossil-fuel industry. “It’s hard not to connect the dots.”
Ted Cruz helped Texas fracking billionaires reap millions in COVID-19 aid relief: report – According to a report from the Wall Street Journal, Sen. Ted Cruz (R-TX) lent a helping hand to two Texas fracking billionaires by asking for changes to rules that would allow them to acquire a $35 million COVID-19 relief loan aimed at helping struggling businesses stay afloat. The report notes that Texas billionaires Dan and Farris Wilks were on a buying spree as the coronavirus pandemic spread across the country — buying up bankrupt competitors and investing in others — only to find they were prohibited from taking advantage of the government-backed loan program as one of their many companies struggled. According to the Journal, they then reached out to Cruz for help. “Since spring, businesses controlled by the Wilks brothers have hunted for deals among fracking firms going through bankruptcy and taken or increased stakes in at least six other companies, corporate filings show,”: the Journal’s Ted Mann and Brody Mullins reported before adding, “But the industry was already under pressure from international competition and a sagging oil price by the time the pandemic hit, and its mounting woes prompted the Wilkses and others to turn to allies in Washington, including Mr. Cruz. The Republican senator helped convince the Trump administration and the Federal Reserve to change the rules for pandemic loans to ensure oil and gas firms could participate.” The report goes on to note that the changes Cruz asked for quickly allowed the wealthy Texas oilmen to cash in. “Soon after the U.S. government changed the rules of its lending program in April, a Wilks family company, ProFrac Holdings LLC, applied for and received a $35 million loan, federal records show,” the report notes before adding, “The Wilks brothers are longtime financial backers of Mr. Cruz. The brothers donated $15 million to a super PAC called Keeping the Promise that championed Mr. Cruz’s 2016 presidential campaign, making them the largest financial backers of his political career.”
Texas Deepwater Oil Terminal Achieves VLCC Milestone –Buckeye Partners reported Wednesday that crude oil export operations have begun at the second deepwater dock at its South Texas Gateway (STG) Terminal, which sits at the mouth of the Corpus Christi Ship Channel.The company pointed out in a written statement emailed to Rigzone that the new dock enables the Ingleside, Texas, facility to accommodate the berthing and loading of two vessels simultaneously. Moreover, it stated that STG has loaded its first very large crude carrier (VLCC) tanker with crude oil for export. “ “STG’s new terminal, alongside our nearby Buckeye Texas Partners facility, will be instrumental in providing our customers with cutting-edge logistics solutions and in reinforcing the role of the Port of Corpus Christi as a top export location for U.S. energy producers.”With the exception of final construction of storage facilities that will conclude during the first quarter of 2021, STG’s marine facilities are now fully operational and can safely and efficiency load up to VLCC-sized vessels, Buckeye stated. Upon completion, STG will boast 8.6 million barrels of petroleum products storage capacity – expandable to 10 million barrels – and throughput capacity of up to 800,000 barrels per day via its two deepwater docks, the company added. “The completion of the second dock and loading of its first VLCC cargo at the STG Terminal are significant milestones for Buckeye and the Port of Corpus Christi,” commented Sean Strawbridge, the port’s CEO. “As Texas moves into the next phase of economic recovery from the COVID-19 pandemic, partnerships like those between the Port of Corpus Christi and its customers such as STG are critical to the continuance of American leadership in the global energy marketplace.” Buckeye Partners owns a 50-percent stake in STG and operates the joint venture. Its co-venturers, each of which holds a 25-percent interest, include Phillips 66 Partners and Marathon Petroleum Corp.
Vandalism string leaves thousands in Colorado without heat, hot water – A natural gas company is working to restore service to thousands of customers in Colorado following vandalism that damaged lines and forced gas to be shut off, leaving residents without heat and hot water. According to a statement Monday from Black Hills Energy’s vice president of operations, Vance Crocker, crews were working to bring more than 3,500 gas meters in Aspen back online, a process that “requires several steps.”“We must first make sure all gas meters are off, then purge the system so it’s ready for the reintroduction of the natural gas supply,” Crocker added. “Finally, our technicians will go door-to-door and relight each customer’s gas appliances.”According to NBC’s Denver affiliate KUSA, Crocker said during a community meeting Monday that the process of restoring gas lines was expected to go into Tuesday, with 150 technicians deployed to work on the issue and 4,000 heaters being distributed during repairs. The Aspen Times reported that gas lines across the city were found damaged, with the name of environmental advocacy organization Earth First! written on one pipe at one of three Black Hills Energy sites vandalized.It was not clear as of Monday whether the organization’s members were directly involved in the damages, according to the Aspen newspaper. “They would have had to have some familiarity with the system” to carry out the sabotage, Bill Linn, Aspen assistant police chief, said Monday. “They tampered with flow lines. They turned off gas lines,” he continued. Linn added that police have not received any communication from Earth First! in response to the damages. In Monday’s community meeting,Aspen Police Chief Richard Pryor said that a multijurisdictional investigation was being carried out to determine who was behind the vandalism and how they were able to carry it out. Linn said Monday that the FBI was assisting local detectives in the investigation, as well as state law enforcement officials, according to the Times. Pitkin County Commissioner Patti Clapper, who was without heat Monday at her Smuggler Mountain-area home, called the vandalism “an act of terrorism.” “It’s trying to destroy a mountain community at the height of the holiday season,” Clapper continued, the Times reported. “This wasn’t a national gas glitch. This was a purposeful act.”
Colorado Officials to Ramp Up Ozone Controls on Natural Gas, Oil Industry – Colorado officials have agreed to enact more stringent regulations on ozone emissions from sectors including oil and natural gas at the instruction of Gov. Jared Polis. The commitment follows a review of air quality data from 2018-2020 which showed that despite a downward trend in ozone concentrations, the Denver Metropolitan/North Front Range (DMNFR) area remains a trouble spot for ground-level ozone, the main component of smog. The area is likely to receive a status downgrade under the ground-level ozone standards outlined in the Clean Air Act (CAA), Polis said in a Dec. 15 letter to the Colorado Air Quality Control Commission (AQCC). The DMNFR area currently is in serious nonattainment status for the 75 parts per billion (ppb) standard, with an attainment date scheduled by July 2021. Based on the review, “it is apparent that the DMNFR area will not meet the standard in time for the attainment date, even excluding the days of high pollution from wildfires in Colorado in 2020,” said Polis. “As a result, state agencies and stakeholders should plan for the downgrade of the DMNFR nonattainment area to a severe status following the attainment deadline…” Polis said Colorado will not seek a waiver for the downgrade, despite an option in the CAA to show that ozone exceedances are caused by international emissions. Economic impacts of the downgrade will include “a requirement for federal reformulated gasoline in the nonattainment area during the summer months,” Polis said. “The state is concerned about the potential costs, as well as the limited environmental benefits of this requirement.” As a result, Polis said he has asked the state’s Department of Public Health and Environment (DPHE), the Energy Office and the Department of Transportation “to explore other options both for more effective and cost-effective means of reducing emissions.”
U.S. Upstream Partnership Unveils New Natural Gas Flaring Program Focused on Reduction, Best Practices – The U.S. oil and gas industry faced a unique set of challenges this year but it did not deter the Environmental Partnership from making strides to reduce natural gas flaring in upstream operations. The 80-plus members, which together represent more than 70% of total oil and gas production in the Lower 48, launched its latest performance program to expand on their core mission to reduce gas flaring. The group, which recently added midstream operators, encourages companies of all sizes to join. Members share information on best practices, advance technologies and foster collaboration to reduce emissions and collect data to help minimize flaring. “Despite the challenges this year, the Environmental Partnership continues to grow and advance innovative solutions for a cleaner future,” Director Matthew Todd said. “This commitment to reduce flaring builds on the industry’s progress in reducing methane emissions and is the latest example of how companies are constantly innovating to improve environmental performance while delivering affordable, reliable energy around the world.” As part of the new program announced earlier this month, members plan to advance best practices, promote the beneficial use of associated gas and improve flare reliability and efficiency when it occurs. Flaring typically is used by producers when there is a lack of gas gathering lines or processing capacity, as well as during maintenance activities. It sometimes is used for unplanned events as a safety measure to alleviate pressure. In these instances, flaring is considered the safer environmental option. Rather than venting the gas into the air, flaring burns the gas, which releases fewer emissions than venting.To gauge progress each year, participants of the partnership’s Flare Management Program have committed to report data to calculate flare intensity, a measurement of volumes relative to production. The program would analyze and aggregate the data for an annual report and use the insights from the participant’s combined actions and reporting to identify opportunities to further reduce flaring.
FERC Clears Kenai LNG Terminal in Alaska for Imports – FERC has approved a Marathon Petroleum Corp. subsidiary’s request to convert the Kenai liquefied natural gas (LNG) export terminal in Alaska to import operations. Trans-Foreland Pipeline Co. LLC filed an application to import natural gas earlier this year at the terminal in Nikiski on the Kenai Peninsula. The facility began operating in 1969 and for more than 40 years was the only LNG export terminal in North America. Kenai has a liquefaction capacity of 200 MMcf/d, but the plant hasn’t exported LNG since 2015. It’s been idled since Marathon acquired it from ConocoPhillips in 2018. Trans-Foreland wants to construct new facilities, return two 35,000 cubic meter storage tanks and other equipment to service to import up to four vessel loads of LNG annually. The company plans to apply for import approval with the U.S. Department of Energy a month before the conversion project enters service. The import terminal would have the capacity to take in 1.825 MMBtu of natural gas each year for delivery to Marathon’s Kenai Refinery on the Cook Inlet, 60 miles southwest of Anchorage, AK. The refinery processes mainly Alaska domestic crude to manufacture gasoline, distillates, heavy fuel oil, asphalt and propane. The Federal Energy Regulatory Commission found the conversion project is in the public’s interest and would not significantly impact the environment. The project must be constructed and put into service within two years, according to FERC’s order authorizing the project. Commissioner Richard Glick dissented from the order as he has repeatedly since joining FERC in 2017, saying the Commission “is again refusing to consider the consequences its actions have for climate change.”
U.S. crude output drops in October as demand falls further (Reuters) -U.S. crude oil production was down more than 2 million barrels per day (bpd) in October from earlier this year, as weak prices and tepid demand due to the coronavirus pandemic weighed on output, a government report showed on Thursday. The report suggested that crude demand in the world’s largest economy remained below the highs of earlier this year, and production was largely flat since cuts began in the spring. Total U.S. oil demand in October was down by 2.15 million bpd, or more than 10% below the same month a year earlier. The decline was sharper than the 9.5% seen in September. Output has fallen from a record-high monthly average of 12.86 million bpd in November, 2019. Production dropped sharply in May as low demand and prices forced widespread drilling cuts. Oil output dropped by 442,000 barrels per day to 10.42 million bpd in October, the latest month for which data was available. The losses were led by declines in the offshore U.S. Gulf of Mexico, according to the Energy Information Administration report. Storms that month caused offshore production shut-ins, contributing to the losses. Still, even without the Gulf declines, production remained below pre-pandemic levels. Top onshore producers Texas and North Dakota reported modest gains in the month as some producers brought into production wells that had been shut, as prices improved. Meanwhile, U.S. natural gas production for October was 99,568 million cubic feet a day, down from 100,221 in September.
Baker Hughes Posts Gain in US Rig Count –The total number of rotary drilling rigs operating in the United States increased by three this week to hit 351, Baker Hughes Co. (NYSE: BKR) reported Wednesday. The service company’s latest U.S. rig count reflects a three-unit gain in oil rigs (to 267) and no change in gas rigs, which stood at 83 again this week. Also, the miscellaneous rig figure held steady at one unit. Against the year-ago figure of 796, the latest total U.S. rig count is down 445 drilling units, Baker Hughes continued. It pointed out that oil rigs are down 403, gas rigs are down 40 and miscellaneous rigs are down two. Baker Hughes added the U.S. offshore rig count remained flat at 17 this week, compared to 22 this time last year. Canada’s fleet of operating drilling units plunged by 23 this week, bringing the country’s total to 59. The most recent figures comprise 18 oil rigs (down 13 from last week) and 41 gas rigs (down 10), Baker Hughes noted. At this time last year, 85 rigs (27 oil and 58 gas) were operating in Canada, the firm added.
Exxon Signals 4th Consecutive Loss— Exxon Mobil Corp., which is struggling to maintain a $15 billion-a-year dividend program, indicated it incurred a fourth straight quarterly loss. Exxon confirmed in a filing Wednesday it will take a writedown of as much as $20 billion on its upstream assets, a possibility first disclosed at the end of October. It also reported much smaller non-cash impairments related to its refining business. There were some positives. Higher oil and gas prices had an impact of up to $1 billion on upstream profits compared with the third quarter. The chemicals segment saw an earnings boost of as much as $400 million due to improved margins. Exxon’s shares were little changed in after-hours trading in New York. Still, a fourth-quarter loss would confirm Exxon’s challenges in covering both dividends and capital expenditures from operational cash flow, and remains reliant on debt. The last time the Irving, Texas-based company generated enough free cash to cover its payout was the third quarter of 2018, according to data compiled by Bloomberg. Exxon is set to disclose its full quarterly results on Feb. 2, amid one of the most-punishing periods in the company’s 150-year history. Its stock cratered to a 22-year low during 2020 amid a worldwide glut of oil and collapsing demand that gutted cash flow, spurring widespread job cuts. Exxon was kicked out of the Dow Jones Industrial Average, warned it will incur the biggest writedown of its modern history, and was assailed by activist investors seeking better returns and more climate accountability. Exxon, which has long prided itself on its decades-long record of annual dividend increases, may have opened the door to changing course in late November, according to Cowen & Co. analyst Jason Gabelman. Whereas company executives touted Exxon’s “reliable and growing dividend” during an October conference call, a Nov. 30 statement announcing writedowns and spending cuts only mentioned its commitment to a “reliable” payout, Gabelman said in a note to clients.
Trans Mountain Pipeline Detour to Increase Construction Costs An extra C$20 million ($15 million) has been added to construction costs of the Trans Mountain Pipeline expansion for a detour around a southern British Columbia (BC) native tribe, according to evidence before the Canada Energy Regulator (CER). The oil pipeline’s route change raises the expense of steering the project past the Coldwater Indian Band to C$70 million ($52.5 million) from C$50 million ($37.5 million), Trans Mountain disclosed in a reply to a CER information request. The extra bill is a relatively small addition to the total cost of expanding Trans Mountain as an export route for Canada’s top natural gas user, Alberta thermal oilsands production. The added expense of the Coldwater detour is just 1.6% of the C$12.6 billion ($9.4 billion) current estimate for nearly tripling capacity to 890,000 b/d on the pipeline from Alberta to a tanker port in Vancouver Harbor. The detour, now going through the CER approval process, would settle a seven-year feud over the project route. Coldwater fought the original plan to use the established right-of-way along the east side of its reservation as a threat to the tribal water supply. The proposed settlement, a new right-of-way west of the reservation, emerged after the pipeline and tribal chiefs agreed to stop butting heads and engage in a meeting of the minds, according to Trans Mountain’s CER application for the detour. “Since May of this year, Trans Mountain president and CEO Ian Anderson has been meeting regularly with Chief Lee Spahan of Coldwater, attempting to reach consensus on routing,” the application said. “In early October, Coldwater confirmed that the west alternative route for the TMEP [Trans Mountain expansion project] addresses its concerns regarding potential impacts to the aquifer used by the Coldwater community.” In addition to written support from Coldwater and seven other southern BC tribes, the detour has won a favor from the owner of the pipeline, Canada’s federal government. Natural Resources Canada has served notice that it will refrain from using its authority under the Canada Energy Regulator Act to require time-consuming cabinet review of any CER detour approval and possibly add conditions. The federal ministry’s decision not to interfere enables Trans Mountain to hit a detour construction start target of August 2021, in order to complete the full 1,150 (690-mile) project on schedule the following year. The only qualification of the detour consensus between Trans Mountain and the BC natives is that Coldwater says its continued support remains subject to engagement by the tribal leadership with its community. About four-fifths of the 18.3-kilometer (11-mile) detour crosses provincially owned BC public land. The provincial government has not intervened in the approval case to date. The BC Oil and Gas Commission controls construction permits on the provincial property.
.


