from the St Louis Fed
— this post authored by Subhayu Bandyopadhyay, Research Officer and Economist; and Praew Grittayaphong, Research Associate
Immigration is a central issue in current U.S. policy deliberations. Among other factors, immigration policy can be used to provide valuable and specialized skills to U.S. industries. In particular, STEM (science, technology, engineering and mathematics) skills are in high demand in high-tech industries, where the U.S. has a leadership role.

While the future composition of skill levels of the immigrant workforce will depend on how immigration policy evolves, we can get a sense of the current immigrant pool’s skill composition by analyzing available data.
We use the 2019 American Community Survey (ACS) data for the foreign-born population currently living in the U.S.1 A substantial fraction of this population comes to the U.S. when they are adults; hence, the age distribution is quite different between natives and those who are foreign born. Accordingly, for ease of comparing the two, we considered only individuals who are 22 or older.2
Top Fields of Academic Training
The figure below considers the individuals in our sample who have at least a bachelor’s degree and shows the top fields of academic specialization for natives and the foreign born. The percentages of natives and the foreign born are roughly comparable in the field of business, and the percentages are not too different in the areas of medical and health sciences and services, biology and life sciences, and social sciences. On the other end of the spectrum, in engineering and in computer and information sciences, the percentages of the foreign born are around 2.5 times the respective percentages for the natives in these fields.

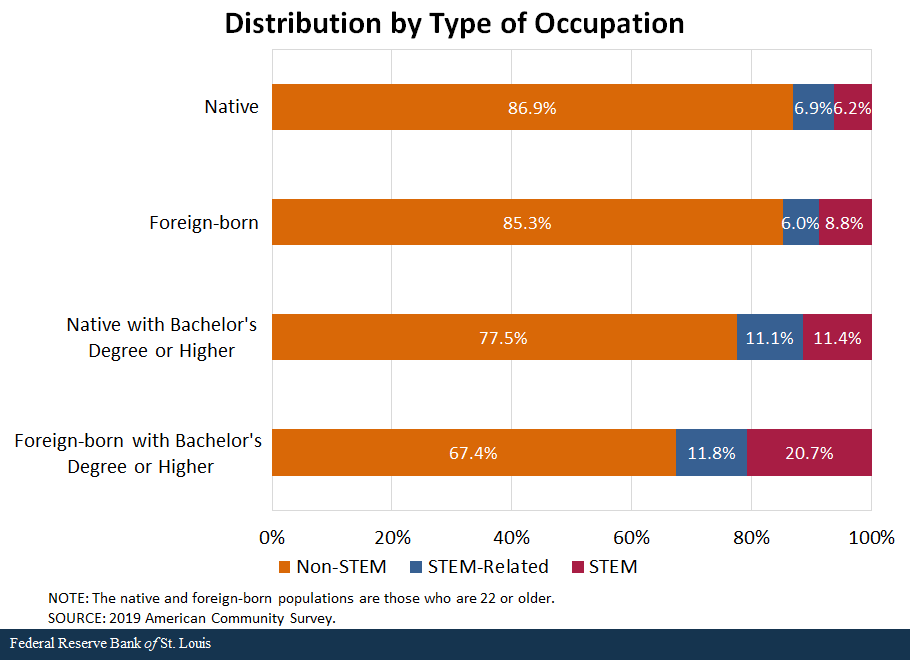
Natives and Foreign Born in STEM Occupations
The next figure explores how natives and foreign born are distributed across STEM, STEM-related and non-STEM occupations.3 The first two bars show that when we consider the entire native and foreign-born populations, the percentages of each group in non-STEM occupations are similar. However, when we narrow our focus to consider only individuals with at least a bachelor’s degree, the percentage of natives in non-STEM occupations exceeds the comparable percentage of foreign born by around 10 percentage points. Digging deeper, we see that 20.7% of foreign born with bachelor’s degrees are in STEM occupations compared with 11.4% for similarly educated natives.
Conclusion
Current educational and occupational specialization data suggest that the college-educated foreign born specialize heavily in STEM fields. The data are roughly in line with what one would expect on at least two grounds. First, the U.S. features top universities in the world for graduate training in science and engineering, which prepares students to fill U.S. jobs requiring STEM skills. Second, current immigration policy allows highly trained individuals from other nations to come to the U.S. to work in jobs requiring scarce and specialized skills. Going forward, among other priorities, the need for STEM skills will likely feature prominently in U.S. immigration policy deliberations.
Notes and References
- The data set was derived from IPUMS USA, University of Minnesota.
- Individuals above the age of 21 are included in the data set as long as they do not show up in the occupation category as “not applicable.” This category applies to unemployed individuals who never worked, or those who are not currently in the labor force and who last worked more than five years ago. Therefore, some recently retired people are included in our analysis. Also, people who are unemployed are included. The occupational classification used in our analysis is based on a person’s most recent occupation, according to IPUMS USA.
- The Census STEM and STEM-related occupation code list is based on the recommendations issued by the Standard Occupational Classification Policy Committee. Currently, health care practitioners and technical occupations; medical and health service managers; and architects are listed as STEM-related.
Additional Resources
- On the Economy: Immigrant Workers and U.S. Trade Activity
- On the Economy: Immigration’s Effect on Future Workforces
- Regional Economist: Workers Abroad Are Catching Up to U.S. Skill Levels
Source
https://www.stlouisfed.org/on-the-economy/2020/december/stem-sls-foreignkil-born-workers
Disclaimer
Views expressed are not necessarily those of the Federal Reserve Bank of St. Louis or of the Federal Reserve System.


