from Statista.com
— this post authored by Niall McCarthy
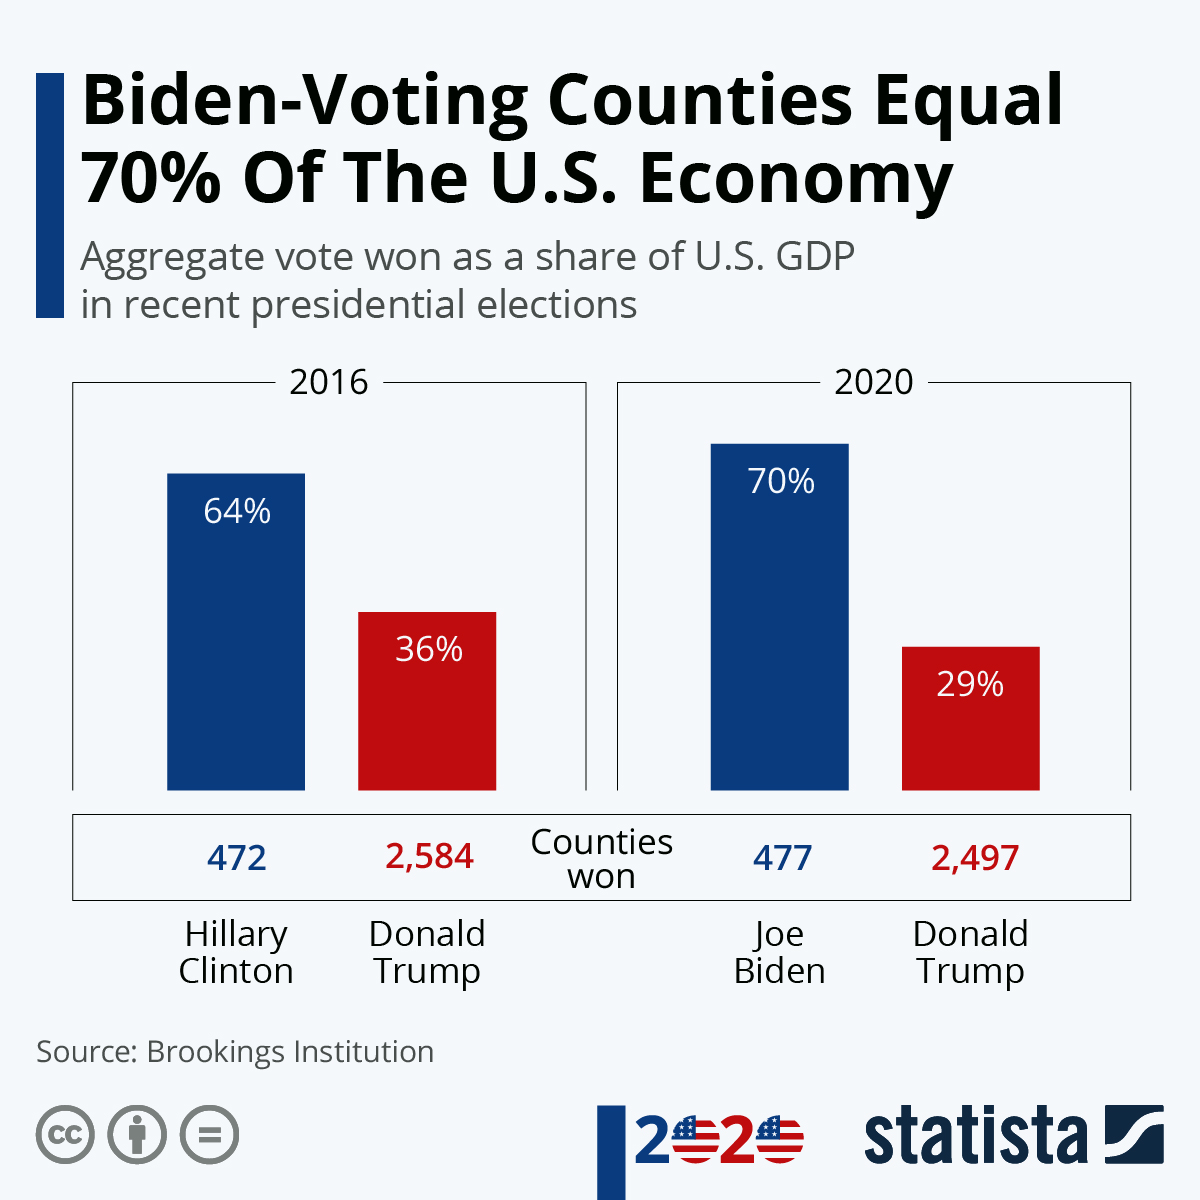
The 2020 presidential election was notable for considerable political and geographic divides but it also highlighted a huge economic divide. The rift is nothing new and it was highlighted in an analysis by the Brookings Institution. The research found that Donald Trump won 2,584 counties accounting for 36 percent of total U.S. economic output when he beat Hillary Clinton in 2016. Even though she won far fewer counties, 472, they accounted for 64 percent of total U.S. economic output. The political outcome of this year’ contest is different and the country’s economic voting chasm has widened.
Please share this article – Go to very top of page, right hand side, for social media buttons.
Joe Biden won five more counties than Hillary Clinton and the 477 that voting for him accounted for a 70 percent share of U.S. GDP. Once again, Trump won far more counties than the Democrats – 2,497 – but they only generated 29 percent of U.S. economic output. The findings from the Brookings Institution are based on unofficial results from 96 percent of U.S. counties with votes still outstanding in 110 counties, most of which are low-output.
Biden won virtually all of the U.S. counties with the biggest economies including Los Angeles (CA), New York (NY), Cook (IL), Harris (TX) and Santa Clara (CA) while Trump was the candidate of choice in small towns and rural communities with correspondingly smaller economies. The most economically powerful counties won by Trump in 2020 were Nassau (NY), Suffolk (NY), Collins (TX) and Oklahoma (OK).
The research found that the counties won by Biden tend to be far more diverse, educated and white-collar professional. Referring to the scale of the divide, Brookings summed things up by commenting on the scale of the gulf between blue-voting metropolitan areas and GOP-supporting rural/small-town communities. They stated that “this economic rift that persists in dividing the nation is a problem because it underscores the near-certainty of both continued clashes between the political parties and continued alienation and misunderstandings”.
You will find more infographics at Statista.
.


