


from the St Louis Fed
— this post authored by Pablo Andrés Neumeyer, Professor, Universidad Torcuato Di Tella; Paulina Restrepo-Echavarr’a, Senior Economist, St. Louis Fed; and Lucas Belmudes, Research Associate, Universidad Torcuato Di Tella
Is the COVID-19 recession one of the worst recessions on record? Is this a common feature across the globe? We put the downturn in historical perspective by comparing recently released forecasts of gross domestic product (GDP) growth for 2020 with the historical record. For expected GDP growth, we use data from the October edition of the International Monetary Fund’s World Economic Outlook (WEO), and we use the Maddison Project Database 2018 for the historical data.

We found that 80% of historical international growth observations are above the one for the 90th percentile in the latest IMF forecasts for 2020 GDP growth. The worst performers for this year, measured by the 25th percentile, are expected to grow at a normalized growth rate that had zero probability a year ago and was observed in only 2% of Maddison’s country-year pairs. The median percentage of years that a country had a growth rate above this year’s WEO forecast is 94%. For 90% of the countries in the Maddison sample, growth was above this year’s forecast at least 79% of the time.
WEO from the Perspective of the Maddison Project
We start by describing the Maddison database coverage. It comprises 155 countries, of which 29 have data on GDP starting in the 19th century, 25 start between 1901 and 1950, and the remaining 101 have data starting after 1950.1 (See the table below.)
| First Observation (a) | Worst Recession since | Percentage of Years with Growth Greater than 2020 Forecast (e) | |||
|---|---|---|---|---|---|
| All Nations (b) | Nations with Data Starting ≤1900 (c) | Nations with Data Starting ≤1950 (d) | |||
| Median | 1951 | 1989 | 1944 | 1947 | 94 |
| 10th Percentile | 1851 | 1943 | 1915 | 1902 | 79 |
| 25th Percentile | 1918 | 1951 | 1936 | 1942 | 87 |
| 75th Percentile | 1951 | 2002 | 1951 | 1996 | 98 |
| 90th Percentile | 1973 | 2010 | 2003 | 2009 | 100 |
| No. of Observed Countries | 155 | 29 | 54 | ||
| NOTES: (a) Initial year with observations in the Maddison project database. For (b), (c) and (d), the data represent the last year for which growth is smaller than the expected growth rate for 2020; the years are for (b) full sample, (c) countries with data starting in 1900 or earlier and (d) countries with data starting between 1901 to 1950. (e) Percentage of years in each country with GDP growth above 2020 projection. The last observation is 2016 for all countries except Brazil, for which the data are up to 2015. See Table 3 in the appendix for more details and individual country data. | |||||
| SOURCES: World Economic Outlook, Maddison Project Database and authors’ calculations. | |||||
In order to get a sense of the exceptional severity of the current recession, we start by looking at the last year for which the growth rate of GDP was lower than the rate expected for 2020. Columns (b) to (d) in the table above contain summary statistics for this variable. For the sample of countries with data going back to the 19th century, the median year with a contraction in GDP worse than the current one is 1944. Extending the sample to countries with data starting in the first half of the 20th century, the median year with a growth performance worse than this year is 1947.
Another way to look at the severity of the COVID-19 recession is to look at the cross-sectional distribution of the fraction of sample years in each country with a growth rate larger than the projected one for 2020. For the median country, growth was above this year’s projection 94% of the time. Even for the countries in the tenth percentile, growth was above this year’s 79% of the time.
The next table shows summary statistics on the distribution of growth forecasts for 2020 as well as on historical averages, 2019 growth and normalized growth rates that are expressed as units of each country’s standard deviation.2 Column (a) shows the change in the IMF’s growth projections for 2020 GDP between October 2019 and October 2020.
| Change in Forecast (a) | October Forecast (b) | 2019 Growth (c) | Average Growth (d) | Normalized Forecast (e) | Normalized 2019 Growth (f) | |
|---|---|---|---|---|---|---|
| Mean | -8.7 | -5.5 | 2.6 | 3.8 | -1.7 | -0.2 |
| Median | -7.8 | -5.0 | 2.4 | 3.8 | -1.5 | -0.2 |
| 10th Percentile | -13.5 | -10.2 | -0.1 | 2.3 | -3.1 | -0.8 |
| 25th Percentile | -10.1 | -7.2 | 1.3 | 3.0 | -2.2 | -0.5 |
| 75th Percentile | -6.1 | -2.3 | 5.0 | 4.5 | -0.9 | 0.2 |
| 90th Percentile | -4.6 | 0.7 | 6.5 | 5.4 | -0.6 | 0.5 |
| Standard Deviation | 6.0 | 6.7 | 4.2 | 1.3 | 1.0 | 0.7 |
| NOTES: Descriptive statistics refer to the distribution of the variable in columns (a) to (f). (a) % change in 2020 growth forecast between October 2020 and October 2019. (b) Expected annual growth rate of GDP in 2020 in October 2020 WEO. (c) 2019 growth rate of GDP reported in October 2020 WEO. (d) Average growth rate of GDP in Maddison Project Database, version 2018. (e) Normalized expected growth rate for 2020 for each country is the IMF October growth forecast minus the country’s average growth divided by its standard deviation. (f) 2019 growth normalized with the Maddison Project’s average and standard deviation. See Table 3 in the appendix for more details and individual country data. | ||||||
| SOURCES: World Economic Outlook, Maddison Project Database and authors’ calculations. | ||||||
We see a large and widespread downward revision of growth projections, which we attribute to the COVID-19 pandemic. The median fall in growth projections for 2020 is almost 8 percentage points. Observe that even the best-performing countries (90th percentile) suffered a downward revision of almost 5 percentage points. Columns (b), (c) and (d) show summary statistics with the 2020 expected growth rate, the 2019 growth rate, and the average growth rate of each country in the Maddison sample.
The median growth forecast for this year is -5%, compared with 2.4% in 2019 and a historical average of 3.8%. Observe that while the 90th percentile of the average historical growth rate for the is 5.4% annually, the expected growth for this year’s 90th percentile is only 0.7%.
Column (e) in the table normalizes the WEO’s forecast with each country’s historical average growth and its standard deviation. The median growth rate expected for this year is 1.5 standard deviations below the historical growth average. Even the best-performing countries are expected to do badly in 2020, as the countries in the top 10% will have a growth rate that is 0.6 standard deviations below their historical average. The countries in the top 25% will grow 0.9 standard deviations below the historical average.
Note the difference between the 2020 forecast and the world’s economic performance in 2019. Last year was a slow year, with the median economy growing at 2.4% – a fifth of a standard deviation below average – and with the best performers growing above their historical average. The worst performers of 2019, measured by the 10th percentile, grew 0.8 standard deviations below normal, which is close to the performance of the 75th percentile expected for 2020.
The figure below is a graphical representation of the cumulative distribution function (CDF) of IMF growth forecasts for 2020 from the vantage point of October 2019, April 2020 and October 2020. The forecast for each country is normalized by its historical average and standard deviation. The solid black line is the CDF of all the country-year growth rates in the Maddison database.
Figure 1: 2020 World Economic Outlook in Historical Perspective
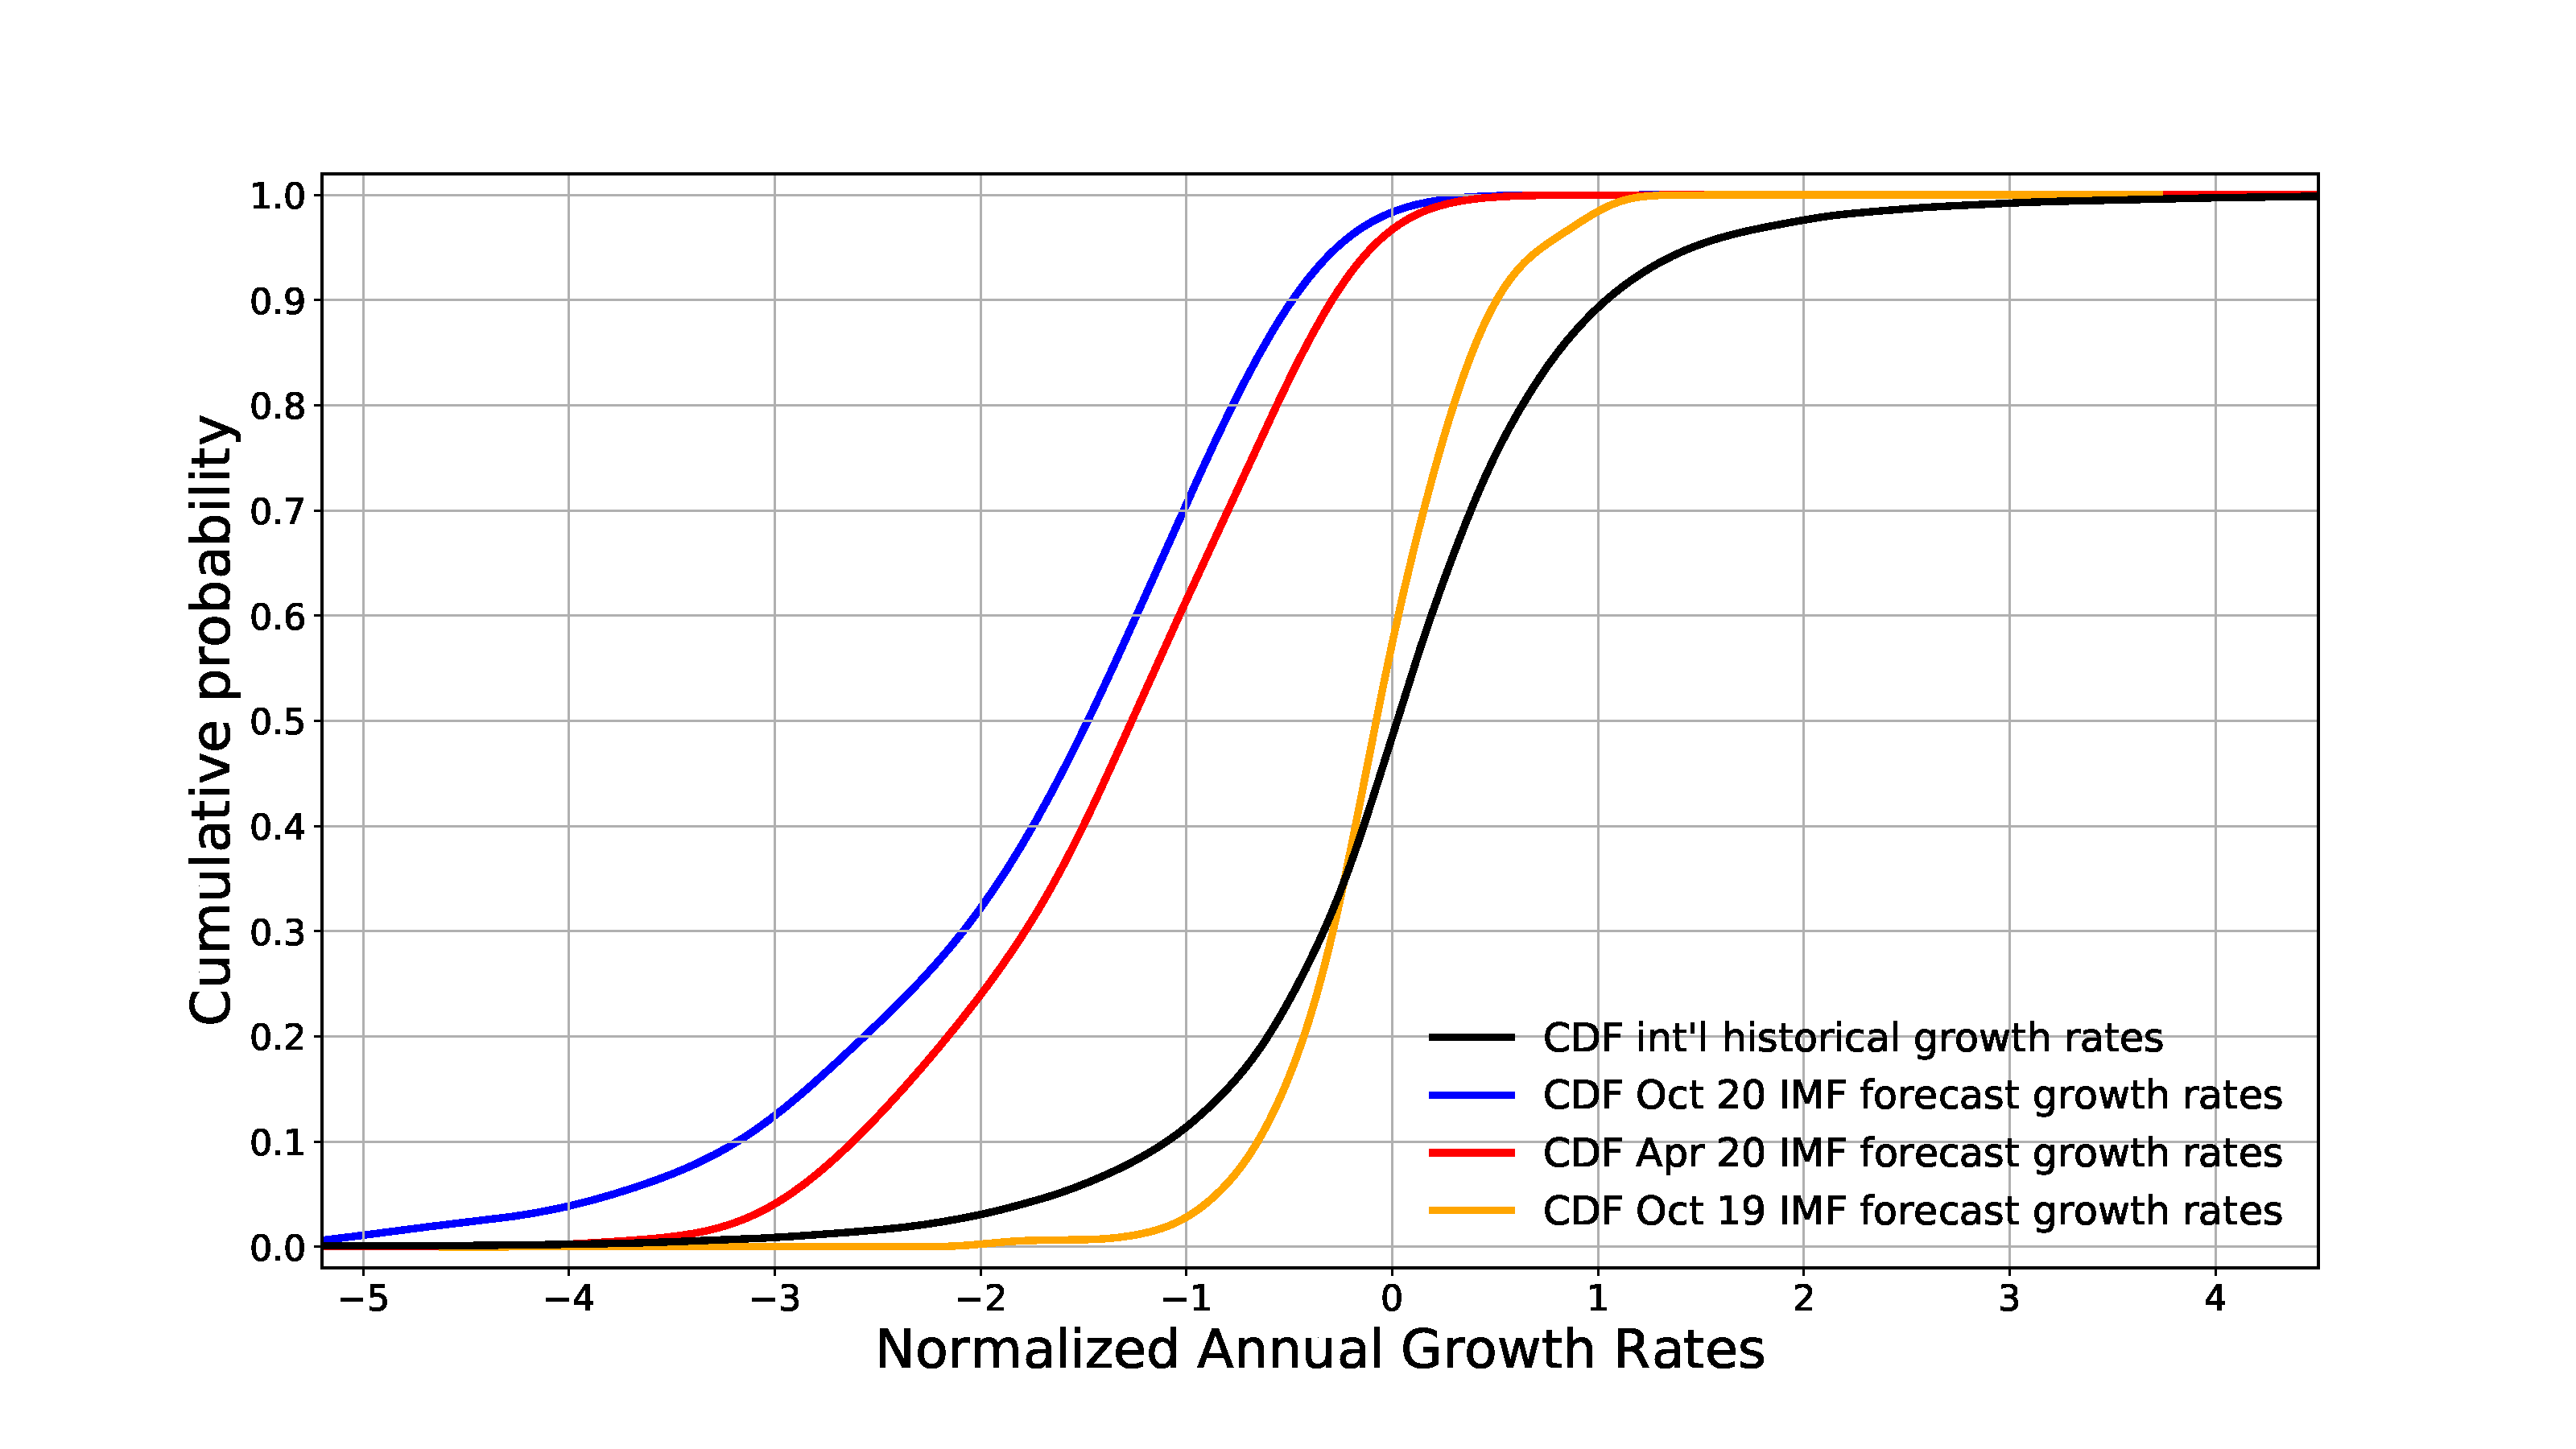
Notes: CDF: cumulative distribution function. Growth rates are normalized by each country’s historical average and standard deviation. The solid black line is the CDF of all country-year growth rates in the Maddison database. See Table 3 in the appendix for individual country data.
Sources: World Economic Outlook, Maddison Project Database, and authors’ calculations.
The reference CDF (the black line) is the one for the normalized historical global growth rates, which is naturally centered at zero. The CDF for expected 2020 growth before the pandemic, in October 2019 (the yellow line), is centered slightly to the left of the black one, with a median growth rate slightly below zero. It is more concentrated at the median than the reference CDF as it is a distribution of expected values and the reference distribution contains all the year-to-year growth miracles and disasters. The yellow line is almost a mean-preserving compression of the reference CDF. The April 2020 forecasts incorporated news about the pandemic, the red line shows how the distribution of new forecasts shifted to the left. The IMF’s current projections (October 2020, the blue line) shifted further to the left.
Figure 1 illustrates how exceptional the COVID-19 recession is. Take the median normalized October 2020 forecast of -1.5 standard deviations from historical growth rates. The percentage of countries with normalized growth forecasts lower than -1.5 in April was 40%. Before the news on the pandemic, October 2019, only 0.7% of growth forecasts for this year were below the median normalized forecasts from October 2020 and only 6% of historical normalized growth rates are less than -1.5. Only 12% of forecasts a year ago and 20% of historical ones are less than -0.6, which is the normalized growth rate for the 90th percentile in the October 2020 forecast. In other words, 80% of historical international growth observations are above the top 10% performer in the latest forecasts for this year. The worst performers for this year, measured by the 25th percentile, are expected to grow at a normalized growth rate that had zero probability a year ago and was observed in only 2% of Maddison’s country-year pairs.
Economic Development and COVID-19 Prevalence
Finally, we look at how the COVID-19 recession, measured by the change in forecasts for 2020 growth between October 2019 and October 2020, correlates with each country’s per capita income and with the spread of the pandemic, as measured by cumulative deaths per million people due to COVID-19 through Oct. 14, 2020. Mortality data came from Our World in Data.
The figure below shows a scatter plot of the change in growth forecasts against per capita income relative to the U.S. The countries in each continent are assigned a different color.
Figure 2: Change in 2020 Growth Forecasts vs. Per Capita Income
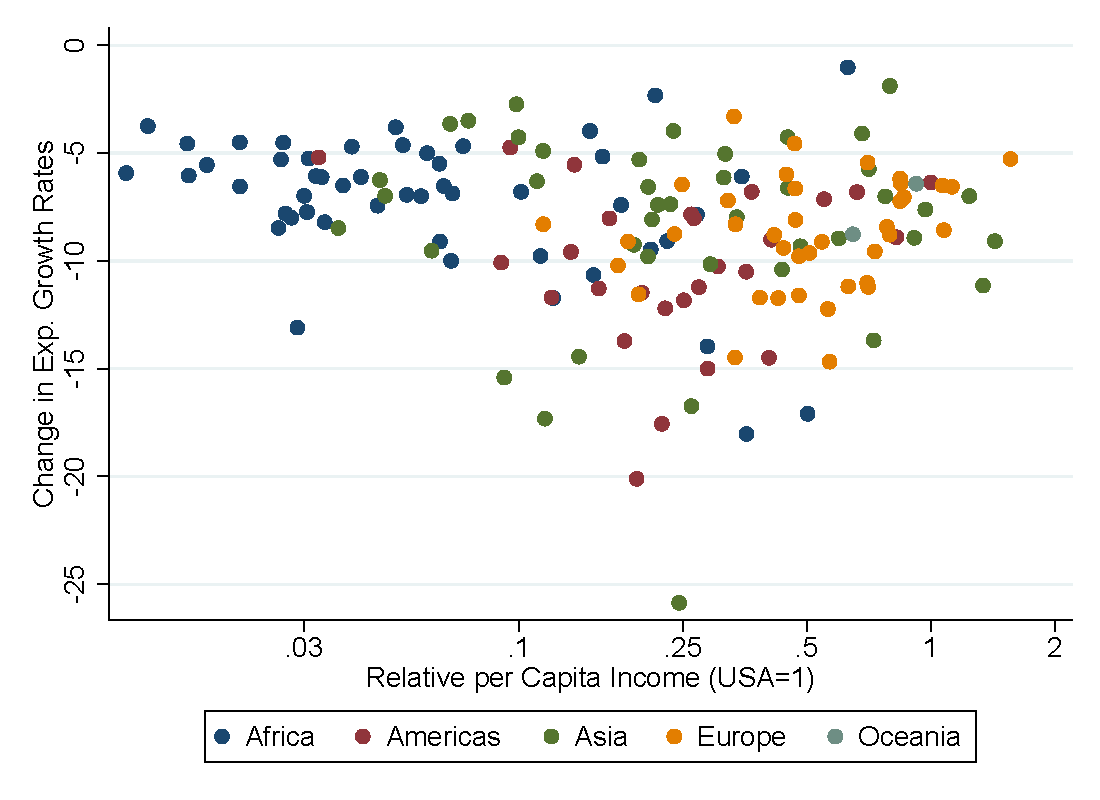
Notes: “Change in Exp Growth Rates” is the difference between the expected growth rate for 2020 in the October 2019 WEO and in the October 2020 WEO. Relative per capita income is for the last observation (2016) in the Maddison database. Excludes Libya.
Sources: World Economic Outlook, Maddison Project Database, and authors’ calculations.
There is no clear correlation between the severity of the COVID-19 recession and per capita income. By and large, poor African countries are among the best performers and there is a wider dispersion as countries become richer. The worst performers are mostly countries that rely heavily on oil and tourism.
Figure 3 looks at the correlation between the severity of the COVID-19 recession, measured again as the change in growth forecasts for 2020, and the total deaths per million people up to Oct. 14, 2020.
Figure 3: Change in 2020 Growth Forecasts vs. Total Deaths per Million
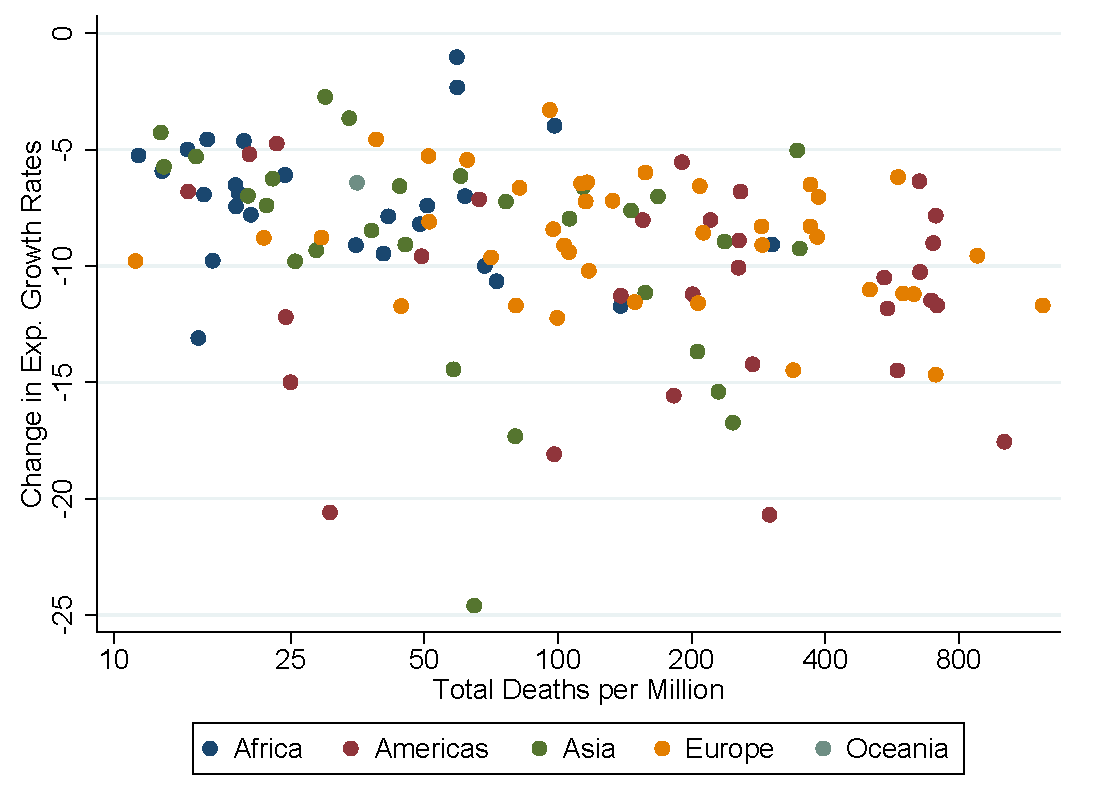
Notes: “Change in Exp. Growth Rates” is the difference between the expected growth rate for 2020 in the October 2019 WEO and in the October 2020 WEO. 193 observations.
Sources: World Economic Outlook, Maddison Project Database, and authors’ calculations.
There is a negative correlation between the two variables, giving credibility to the hypothesis that the pandemic is an important driving factor of the global recession. The ample heterogeneity also suggests that there are other factors that play an important role.
Notes and References
- Seventy-six countries have data starting in 1951.
- Detailed data for each country are available in Table 3 in the appendix below.
Additional Resources
- St. Louis Fed’s COVID-19 resource page
- On the Economy: How Does the Pandemic Recession Stack Up against the Great Depression?
- On the Economy: COVID-19’s Economic Effects on Poor and Emerging Markets
Source
https://www.stlouisfed.org/on-the-economy/2020/november/covid19-recession-historical-perspective
Disclaimer
Views expressed are not necessarily those of the Federal Reserve Bank of St. Louis or of the Federal Reserve System.
Appendix
Data presented is available for download.


