
Written by rjs, MarketWatch 666
 Here are some selected news articles from the week ended 15 August 2020. Part 2 is available here.
This is a feature at Global Economic Intersection every Monday evening. This week the post has been delayed by one day.
Please share this article – Go to very top of page, right hand side, for social media buttons.
Global oil supplies were 3.35 million barrels per day short in July; US gasoline imports rose to a 53 week high
Oil prices finished higher again this week after the EIA raised its price forecast and US oil and fuel inventories fell….after rising 2.4% to $41.22 a barrel last week on a drop in US oil inventories and fears of instability in the Mideast, the contract price of US light sweet crude for September delivery opened higher on Monday, buoyed by a rally in Asian markets, and finished with a gain of 74 cents at $41.94 a barrel on reports of progress in U.S. stimulus talks after Trump had signed executive orders to unilaterally extend parts of coronavirus relief package…oil prices continued rising early Tuesday and were up more than 2% on stimulus hopes before reversing and finishing 33 cents lower at $41.61 a barrel, as hopes dimmed for a quick stimulus passage and as coronavirus cases increased globally…but oil prices rose again Wednesday after the EIA raised its 2020 average spot price forecasts for both US and global crude prices and then rallied to end $1.06, or 2.6%, higher at $42.67 a barrel after the EIA’s weekly data showed U.S. oil and product inventories had fallen across the board…but oil prices turned lower Thursday after the International Energy Agency lowered its 2020 oil demand forecast due to unprecedented virus-related travel restrictions and finished down 43 cents at $42.24 a barrel as resilience in equities markets and a weak dollar limited the slide…oil prices edged down again on Friday on worries that demand would recover from the virus impacts more slowly than expected and finished 23 cents lower at $42.01 a barrel as rising supply from OPEC overshadowed optimism over falling US crude and fuel inventories, but still finshed the week 1.9% higher as strong US economic reports provided some bright spots in the economic outlook…
Natural gas prices also rose this week on continued hot weather across the continental US and on rising LNG exports…after jumping 24% to a seven month high of $2.238 per mmBTU last week as weather forecasts turned hotter and gas prices in Europe rose, the contract price of natural gas for August delivery tumbled 8.5 cents or nearly 4% on Monday on forecasts for slightly cooler temperatures than was originally forecast and a slow increase in gas production in response to higher prices…gas prices steadied on Tuesday and then rose 1.8 cents on forecasts for hotter weather through late August, a reduction in gas output, and an increase in LNG exports. but that increase was more than reversed on Wednesday when prices fell 1.9 cents to $2.152 per mmBTU as traders realized that demand for AC would decline now that the hottest part of the summer is past….but natural gas prices reversed again and rose 3.0 cents on Thursday despite a larger than normal increase in storage inventories on forecasts for the air conditioning demand to remain high over the next two weeks, a further slowdown in gas output, and an increase in LNG exports...natural gas prices then soared 17.4 cents, or 8.0%, to settle at $2.356 per mmBTU on Friday to their highest level since December on rising LNG exports and forecasts for air conditioning demand to remain high through the end of August and thus ended the week 5.3% above the the prior Friday’s close…
The natural gas storage report from the EIA for the week ending August 7th indicated that the quantity of natural gas held in underground storage in the US rose by 58 billion cubic feet to 3,332 billion cubic feet by the end of the week, which left our gas supplies 608 billion cubic feet, or 22.3% greater than the 2,724 billion cubic feet that were in storage on August 7th of last year, and 443 billion cubic feet, or 15.3% above the five-year average of 2,889 billion cubic feet of natural gas that have been in storage as of the 7th of August in recent years….the 58 billion cubic feet that were added to US natural gas storage this week was more than the average 51 billion cubic feet increase that was forecast by analysts polled by S&P Global Platts, and was also more than the 51 billion cubic feet addition of natural gas to storage during the corresponding week of 2019, and it was well above the average of 44 billion cubic feet of natural gas that has been added to natural gas storage during the same week over the past 5 years..
The Latest US Oil Supply and Disposition Data from the EIA
US oil data from the US Energy Information Administration for the week ending August 7th showed that because of a decrease in our oil imports, an increase in our oil exports, and a drop in our oil production, we needed to withdraw oil from our stored supplies for a third week in a row and for the 5th time in the past ten weeks…our imports of crude oil fell by an average of 389,000 barrels per day to an average of 5,621,000 barrels per day, after rising by an average of 864,000 barrels per day during the prior week, while our exports of crude oil rose by an average of 324,000 barrels per day to an average of 3,143,000 barrels per day during the week, which meant that our effective trade in oil worked out to a net import average of 2,478,000 barrels of per day during the week ending August 7th, 713,000 fewer barrels per day than the net of our imports minus our exports during the prior week…over the same period, the production of crude oil from US wells was reportedly 300,000 barrels per day lower at 10,700,000 barrels per day, and hence our daily supply of oil from the net of our trade in oil and from well production totaled an average of 13,178,000 barrels per day during this reporting week..
US oil refineries reported they were processing 14,658,000 barrels of crude per day during the week ending August 7th, 21,000 more barrels per day than the amount of oil they used during the prior week, while over the same period the EIA’s surveys indicated that a net of 965,000 barrels of oil per day were being pulled out of the supplies of oil stored in the US….so based on that reported & estimated data, this week’s crude oil figures from the EIA appear to indicate that our total working supply of oil from net imports, from storage, and from oilfield production was still 515,000 barrels per day less than what our oil refineries reported they used during the week….to account for that disparity between the apparent supply of oil and the apparent disposition of it, the EIA just inserted a (+515,000) barrel per day figure onto line 13 of the weekly U.S. Petroleum Balance Sheet to make the reported data for the average daily supply of oil and the data for the average daily consumption of it balance out, essentially a fudge factor that they label in their footnotes as “unaccounted for crude oil”, thus suggesting an error or errors of that magnitude in the oil supply & demand figures we have just transcribed….with last week’s fudge factor at -609,000, that means our week over week comparisons on oil supply & demand changes are off by even more… (for more on how this weekly oil data is gathered, and the possible reasons for that “unaccounted for” oil, see this EIA explainer)….
Further details from the weekly Petroleum Status Report (pdf) indicate that the 4 week average of our oil imports rose to an average of 5,680,000 barrels per day last week, which was still 20.4% less than the 7,138,000 barrel per day average that we were importing over the same four-week period last year….the 965,000 barrel per day net withdrawal from our total crude inventories came as 645,000 barrels per day were being pulled out of our commercially available stocks of crude oil and 320,000 barrels per day were being withdrawn from the oil supplies in our Strategic Petroleum Reserve….this week’s crude oil production was reported to be 300,000 barrels per day lower at 10,700,000 barrels per day because the rounded estimate of the output from wells in the lower 48 states fell by 300,000 barrels per day to 10,300,000 barrels per day, while Alaska’s oil production was unchanged at 433,000 barrels per day….last year’s US crude oil production for the week ending August 9th was rounded to 12,300,000 barrels per day, so this reporting week’s rounded oil production figure was about 13.0% below that of a year ago, yet still 27.0% more than the interim low of 8,428,000 barrels per day that US oil production fell to during the last week of June of 2016…
Meanwhile, US oil refineries were operating at 81.0% of their capacity while using 14,658,000 barrels of crude per day during the week ending August 7th, up from 79.6% of capacity during the prior week, but excluding the 2005, 2008, and 2017 hurricane-related refinery interruptions, still one of the lowest refinery utilization rates of the last twenty-eight years…hence, the 14,658,000 barrels per day of oil that were refined this week were still 15.3% fewer barrels than the 17,302,000 barrels of crude that were being processed daily during the week ending August 9th, 2019, when US refineries were operating at 94.8% of capacity….
With the increase in the amount of oil being refined, gasoline output from our refineries was also higher, increasing by 300,000 barrels per day to 9,600,000 barrels per day during the week ending August 7th, after our refineries’ gasoline output had increased by 142,000 barrels per day over the prior week…but with our gasoline production still recovering from a multi-year low, this week’s gasoline output was still 5.9% less than the 10,203,000 barrels of gasoline that were being produced daily over the same week of last year….on the other hand, our refineries’ production of distillate fuels (diesel fuel and heat oil) decreased by 120,000 barrels per day to 4,789,000 barrels per day, after our distillates output had increased by 126,000 barrels per day over the prior week… after this week’s decrease in distillates output, our distillates’ production was 5.7% less than the 5,077,000 barrels of distillates per day that were being produced during the week ending August 9th, 2019….
Even with the increase in our gasoline production, our supply of gasoline in storage at the end of the week decreased for the 4th time in 6 weeks and for the 19th time in 28 weeks, falling by 722,000 barrels to 247,084,000 barrels during the week ending August 7th, after our gasoline supplies had increased by 419,000 barrels over the prior week…our gasoline supplies decreased this week because the amount of gasoline supplied to US markets increased by 266,000 barrels per day to 8,883,000 barrels per day, even as our imports of gasoline rose by 366,000 barrels per day to 1,023,000 barrels per day and as our exports of gasoline rose by 24,000 barrels per day to 794,000 barrels per day….but even after this week’s inventory decrease, our gasoline supplies were 5.7% higher than last August 9th’s gasoline inventories of 233,760,000 barrels, and roughly 8% above the five year average of our gasoline supplies for this time of the year…
With the decrease in our distillates production, our supplies of distillate fuels decreased for the fifteenth time in 30 weeks and for the 25th time in 45 weeks, falling by 2,322,000 barrels to 177,655,000 barrels during the week ending August 7th, after our distillates supplies had increased by 1,591,000 barrels to a 38 year high over the prior week….our distillates supplies fell this week because the amount of distillates supplied to US markets, an indicator of our domestic demand, rose by 162,000 barrels per day to 3,862,000 barrels per day and because our exports of distillates rose by 294,000 barrels per day to 1,407,000 barrels per day, while our imports of distillates rose by 17,000 barrels per day to 148,000 barrels per day…but even after this week’s inventory decrease, our distillate supplies at the end of the week were still 31.1% above the 135,513,000 barrels of distillates that we had in storage on August 9th, 2019, and about 24% above the five year average of distillates stocks for this time of the year…
Finally, with the drop in our oil imports and our oil production and the increase in our oil exports, our commercial supplies of crude oil in storage fell for the 8th time in thirty weeks and for the 16th time in the past year, decreasing by 4,512,000 barrels, from 518,596,000 barrels on July 31st to 514,084,000 barrels on August 7th….but even after that decrease, our commercial crude oil inventories were still around 15% above the five-year average of crude oil supplies for this time of year, and around 53% above the prior 5 year (2010 – 2014) average of our crude oil stocks for the first weekend of August, with the disparity between those comparisons arising because it wasn’t until early 2015 that our oil inventories first topped 400 million barrels….since our crude oil inventories have generally been rising since September of 2018, except for during last summer, after generally falling until then through most of the prior year and a half, our crude oil supplies as of August 7th were 16.7% above the 440,510,000 barrels of oil we had in commercial storage on August 9th of 2019, 24.1% more than the 414,194,000 barrels of oil that we had in storage on August 10th of 2018, and 10.2% above the 466,492,000 barrels of oil we had in commercial storage on August 11th of 2017…
OPEC’s Monthly Oil Market Report
Wednesday of this past week saw the release of OPEC’s August Oil Market Report, which covers OPEC & global oil data for July, and hence it gives us a picture of the global oil supply & demand situation during the third month of the agreement between OPEC, the Russians, and other oil producers to cut production by 9.7 million barrels a day from an elevated October 2018 baseline….again, we should caution that estimating oil demand while most countries are still trying to recover from a Covid-19 induced recession is pretty speculative, and hence the demand figures we’ll be reporting this month should again be considered as having a much larger margin of error than we’d expect from this report during normal, more predictable periods..
The first table from this monthly report that we’ll review is from the page numbered 50 of this month’s report (pdf page 60), and it shows oil production in thousands of barrels per day for each of the current OPEC members over the recent years, quarters and months, as the column headings indicate…for all their official production measurements, OPEC uses an average of estimates from six “secondary sources”, namely the International Energy Agency (IEA), the oil-pricing agencies Platts and Argus, the U.S. Energy Information Administration (EIA), the oil consultancy Cambridge Energy Research Associates (CERA) and the industry newsletter Petroleum Intelligence Weekly, as a means of impartially adjudicating whether their output quotas and production cuts are being met, to thus avert any potential disputes that could arise if each member reported their own figures…
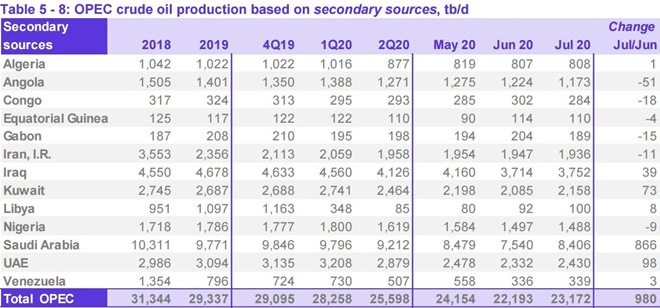
As we can see from the above table of oil production data, OPEC’s oil output was up by 980,000 barrels per day to 23,172,000 barrels per day during July, from their revised June production total of 22,193,000 barrels per day…however that June output figure was originally reported as 22,271,000 barrels per day, which means that OPEC’s June production was revised 78,000 barrels per day lower with this report, and hence July’s production was, in effect, a 902,000 barrel per day increase from the previously reported OPEC production figures (for your reference, here is the table of the official June OPEC output figures as reported a month ago, before this month’s revisions)…
From the above table, we can also see that production increases of 866,000 barrels per day from the Saudis, 98,000 barrels per day from the Emirates, 73,000 barrels per day from the Kuwait accounted for the June increase, even as several other OPEC producers continued to make further production cuts…the original oil producer’s agreement was to severely cut production for just two months, during May and June, but that agreement was extended to include July at a meeting between OPEC and other producers on June 6th, so the big July increase in Saudi output creates the appearance that they increased production in violation of the agreement…however, what actually happened was that due to large ongoing surplus in May, the Saudis unilaterally took it on themselves to cut their production by an extra million barrels per day in June, a cut we saw in last month’s OPEC report, so this month’s 866,000 barrel per day Saudi production increase was simply an unwinding of most of that extra voluntary June cut…
To facilitate understanding how each of the OPEC members have been adhering to the production cut agreement that covers July, we’ll next include a table which shows the October 2018 reference production for each of the OPEC members (as well as other producers party to the mid-April agreement), as well as the production level each of those producers was expected to cut their output to….

The table above was taken from an article at Zero Hedge, and it shows the oil production baseline in thousands of barrel per day from which each of the oil producers will cut from in the first column, a number which is based on each of the producer’s October 2018 output, ie., a date before the past year’s and last quarter’s output cuts took effect; the second column shows how much each participant has committed to cut in thousands of barrel per day, which is 23% of the October 2018 baseline for all participants except for Mexico, while the last column shows the production level each participant has agreed to after that 23% cut…note that sanctioned OPEC members Iran and Venezuela and war-torn Libya are exempt from these cuts…
Since OPEC is reporting a net 7,322,000 barrels per day decrease in their production since April, it appears that OPEC has far exceeded the 6,084,000 barrels per day they had committed to cut…however, the baseline for the agreed to for the current cuts is OPEC’s production of October 2018, and the 7,322,000 barrels per day drop in their recent production represents the output change since April 2020, so we can’t really compare the two…moreover, production of some of the OPEC members is still above their target level…for instance, Iraq had committed to cut their production by 1,061,000 barrels per day from their October 2018 level and only produce 3,592,000 barrels per day during the production cut agreement period, but their July production was only down by 740,000 barrels per day since April, and thus the 3,752,000 barrels per day they produced in July was 160,000 barrels per day more than they were supposed to…
The next graphic from this month’s report that we’ll include shows us both OPEC and world oil production monthly on the same graph, over the period from August 2018 to July 2020, and it comes from page 51 (pdf page 61) of the August OPEC Monthly Oil Market Report….on this graph, the cerulean blue bars represent monthly OPEC oil production in millions of barrels per day as shown on the left scale, while the purple graph represents global oil production in millions of barrels per day, with the metrics for global output shown on the right scale….

Including the 980,000 barrel per day increase in OPEC’s production from what they produced a month earlier, OPEC’s preliminary estimate indicates that total global oil production increased by a rounded 1.29 million barrels per day to average 88.75 million barrels per day in July, a reported increase which apparently came after June’s total global output figure was revised higher by 1,170,000 barrels per day from the 86.29 million barrels per day of global oil output that was reported a month ago, as non-OPEC oil production rose by a rounded 310,000 barrels per day in July after that revision, with oil production from Canada, Norway and other OECD oil producers accounting for a 400,000 barrels per day increase in July…even with the increase in July’s global output, the 88.75 million barrels of oil per day produced globally in July were 9.96 million barrels per day, or 10.1% less than the revised 98.71 million barrels of oil per day that were being produced globally in July a year ago, the 7th month of OPECs first round of production cuts (see the August 2019 OPEC report (online pdf) for the originally reported July 2019 details)…with this month’s increase in OPEC’s output, their July’ oil production of 23,172,000 barrels per day rose to 26.1% of what was produced globally during the month, up from their revised 25.4% share in June, but down from the 27.1% share they contributed to global output in May…OPEC’s July 2019 production, which included 520,000 barrels per day from former OPEC member Ecuador, was reported at 29,609,000 barrels per day, which means that the 13 OPEC members who were part of OPEC last year produced 6,437,000, or 21.7% fewer barrels per day of oil in July’ than what they produced a year ago, when they accounted for 30.0% of global output…
Even with the increase in OPEC’s and global oil output that we’ve seen in this report, there was still a big shortfall in the amount of oil being produced globally during the month, as this next table from the OPEC report will show us…
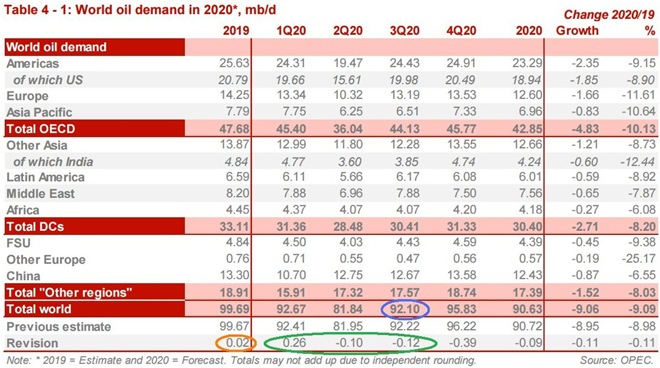
The table above came from page 25 of the August OPEC Monthly Oil Market Report (pdf page 35), and it shows regional and total oil demand estimates in millions of barrels per day for 2019 in the first column, and OPEC’s estimate of oil demand by region and globally quarterly over 2020 over the rest of the table…on the “Total world” line in the fourth column, we’ve circled in blue the figure that’s relevant for July, which is their estimate of global oil demand during the third quarter of 2020…
OPEC is estimating that during the 3rd quarter of this year, all oil consuming regions of the globe will be using an average of 92.10 million barrels of oil per day, which is a 120,000 barrels per day downward revision from the 92.22 million barrels of oil per day they were estimating for the 3rd quarter a month ago (circled in green), still reflecting quite a bit of coronavirus related demand destruction compared to 2019, when summertime demand exceeded 100 million barrels per day….however, as OPEC showed us in the oil supply section of this report and the summary supply graph above, OPEC and the rest of the world’s oil producers were only producing 88.75 million barrels per day during July, which would imply that there was a shortage of around 3,350,000 barrels per day in global oil production in July when compared to the demand estimated for the month…
In addition to figuring the July shortage implied by this report, the upward revision of 1,170,000 barrels per day to June’s global oil output that’s implied in this report, combined with the 100,000 barrels per day downward revision to 2nd quarter demand that we’ve circled in green means that the 4,340,000 barrel per day global oil output surplus we had previously figured for June would now be revised to a surplus of 5,610,000 barrels per day….at the same time, the surplus of 8,290,000 barrels per day that we had previously figured for May, in light of that 100,000 barrels per day downward revision to 2nd quarter demand, would have to be revised to a surplus of 8,390,000 barrels per day…& similarly, the 17,040,000 barrels per day that we had previously figured for April would have to be revised to a surplus of 17,140,000 barrels per day…
Note that in green we’ve also circled an upward revision of 260,000 barrels per day to first quarter demand….that means that the record global oil surplus of 18,048,000 barrels per day we had previously figured for March would have to be revised downward to a global oil surplus of 17,788,000 barrels per day…similarly, the 2,160,000 barrel per day global oil production surplus we had figured for February would now be a 1,900,000 barrel per day global oil output surplus, and the 1,190,000 barrel per day global oil output surplus we last had for January would now be revised to a 930,000 barrel per day oil output surplus.. so despite the shortage of oil that has developed in July, it’s obvious the world’s oil producers had produced a lot of oil earlier this year that no one wanted..
Finally, notice that in orange we have circled an upward revision of 20,000 barrels per day to 2019’s oil demand…the last time OPEC revised their demand figures for 2019 was in March, and at that time we simply revised our aggregate oil shortage for 2019 from a total of 284,090,000 barrels to a revised total of 254,890,000 barrels for the entirely of the year…thus an upward revision of 20,000 barrels per day to 2019’s oil demand would increase 2019’s oil shortage by 7,300,000 barrels to 262,190,000 barrels, resulting in a shortage that was the equivalent of more than two and a half days of global oil production at the December 2019 production rate…
This Week’s Rig Count
The US rig count was down for the 22nd time in 23 weeks during the week ending August 14th, and is now down by 69.3% over that twenty-three week period….Baker Hughes reported that the total count of rotary rigs running in the US fell by 3 rigs to 244 rigs this past week, which was the fewest active rigs in Baker Hughes records going back to 1940, and 160 fewer rigs than the all time low prior to this year…it was also down by 691 rigs from the 935 rigs that were in use as of the August 16th report of 2019, and 1,685 fewer rigs than the shale era high of 1,929 drilling rigs that were deployed on November 21st of 2014, the week before OPEC began to flood the global oil market in their first attempt to put US shale out of business….
The number of rigs drilling for oil decreased by 4 rigs to 172 oil rigs this week, after decreasing by 4 oil rigs the prior week, leaving us with the lowest oil rig count since July 15th, 2005… that was also 598 fewer oil rigs than were running a year ago, and less than a ninth of the recent high of 1609 rigs that were drilling for oil on October 10th, 2014….at the same time, the number of drilling rigs targeting natural gas bearing formations increased by 1 rig to 70 natural gas rigs, which was still down by 95 natural gas rigs from the 165 natural gas rigs that were drilling a year ago, and was also less than a twentieth of the modern era high of 1,606 rigs targeting natural gas that were deployed on September 7th, 2008…in addition to those rigs drilling for oil & gas, two rigs classified as ‘miscellaneous’ continued to drill this week; one on the big island of Hawaii, and one in Sonoma County, California… a year ago, there were no such “miscellaneous” rigs deployed…
The Gulf of Mexico rig count was up by one to 13 rigs this week, with 10 of those rigs drilling for oil in Louisiana’s offshore waters and three drilling for oil offshore from Texas…that was 12 fewer rigs than the 25 rigs drilling in the Gulf a year ago, when all 25 Gulf rigs were drilling offshore from Louisiana…while there are no rigs operating off other US shores at this time, a year ago there were also two rigs deployed offshore from Alaska, so this week’s national offshore count is down by 14 from the national offshore rig count of 27 a year ago…also note that in addition to those rigs offshore, a platform was also set up to drill through an inland body of water in southern Louisiana this week, the first such inland water rig deployed since January; a year ago, there were no rigs drilling in inland waters..
The count of active horizontal drilling rigs was down by 4 to 207 horizontal rigs this week, which was the least horizontal rigs deployed since November 4th, 2005, and also 608 fewer horizontal rigs than the 815 horizontal rigs that were in use in the US on August 16th of last year, and less than a sixth of the record of 1372 horizontal rigs that were deployed on November 21st of 2014…on the other hand, the vertical rig count was up by one to 13 vertical rigs this week, but those were still down by 38 from the 52 vertical rigs that were operating during the same week of last year….meanwhile, the directional rig count was unchanged at 24 directional rigs this week, and those were also down by 44 from the 68 directional rigs that were in use on August 16th of 2019….
The details on this week’s changes in drilling activity by state and by major shale basin are shown in our screenshot below of that part of the rig count summary pdf from Baker Hughes that gives us those changes…the first table below shows weekly and year over year rig count changes for the major oil & gas producing states, and the table below that shows the weekly and year over year rig count changes for the major US geological oil and gas basins…in both tables, the first column shows the active rig count as of August 14th, the second column shows the change in the number of working rigs between last week’s count (August 7th) and this week’s (August 14th) count, the third column shows last week’s August 7th active rig count, the 4th column shows the change between the number of rigs running on Friday and the number running during the count before the same weekend of a year ago, and the 5th column shows the number of rigs that were drilling at the end of that reporting week a year ago, which in this week’s case was the 16th of August, 2019…
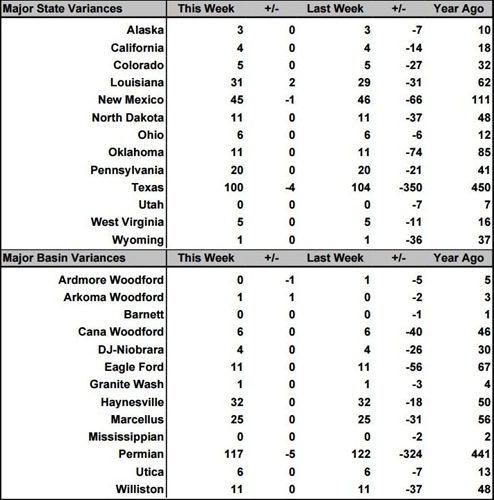
As you can see, there were again only a few changes in drilling activity this week, with just a handful of rig removals and just a few rig additions, which suggests that prices are currently high enough that drillers are no longer pushing to shut down money-losing operations, but not high enough to encourage the addition of new rigs to the field…checking the rig counts in the Texas part of Permian basin, we find that three rigs were pulled out of Texas Oil District 8, which is the core Permian Delaware, and another rig was removed from Texas Oil District 7C, which corresponds to the southern Permian Midland….since the Texas Permian count has thus decreased by 4 rigs while the national Permian basin rig count was down by 5 rigs, that almost certainly means that the rig that was removed from New Mexico would have been drilling in the western Permian Delaware, to fully account for the national Permian decrease…meanwhile, there were no changes elsewhere in Texas, and few anywhere else for that matter…we’ve already accounted for the two rig increase for Louisiana, with the addition of the oil rig offshore in the Gulf of Mexico, and the other oil rig addition on Louisiana inland waters, so all that’s left to cover is the addition of a natural gas rig in Oklahoma’s Arkoma Woodford and the removal of an oil rig from Oklahoma’s Ardmore Woodford, thus bringing our oil & gas totals in line with the national count and leaving Oklahoma’s rig count unchanged….
Utica Shale well activity as of Aug. 8 – Five more wells are producing in the Utica Shale, new statistics show.Two horizontal permits were issued during the week that ended Aug. 8, and 7 rigs were operating in the Utica Shale.
- DRILLED: 157 (157 as of the previous week)
- DRILLING: 95 (99)
- PERMITTED: 506 (507)
- PRODUCING: 2,528 (2,523)
- TOTAL: 3,286 (3,286)
TOP COMPANIES BY NUMBER OF PERMITS
- 1. EAP OHIO: 878 (878 as of the previous week)
- 2. ASCENT RESOURCES UTICA: 652 (652)
- 3. GULFPORT APPALACHIA: 416 (416)
- 4. ANTERO: 258 (258)
- 5. ECLIPSE: 218 (218)
State grant aiding students at Utica Shale Academy and Southern Local – Students at the Utica Shale Academy and Southern Local High School are getting another resource to prepare them for a successful future in industry through a $200,000 state grant.USA Director Bill Watson reported the Ohio Department of Education approved an Equity in Education grant to help provide training on six Industry 4.0 building blocks including industrial success skills, industrial equipment and technology, smart sensors and devices, control systems, internet protocol and informactionable data.Southern Local will administer the funding and Watson said it is considered a foreign language class because it primarily uses computer programming, while Southern students may take the class as an elective.Watson worked with Kristy Sampson, district federal programs coordinator at Southern Local, to help give students an opportunity they otherwise may not have. A portion of the funding finances a new instructor and Matt Gates was hired to head classes starting Sept. 8. Meanwhile, officials previously formed a partnership with the New Castle School of Trades in East Liverpool and offered welding classes for the past several years to USA students. That will be expanded to help develop manufacturing skills and Southern students will also take part. About 62 students have registered for the academy, which is an increase from 44 pupils last year. Forty USA students are expected to take welding with 20 in industrial maintenance and the end goal is to obtain industry credentials and certification as well as a possible associate’s degree by the time they graduate high school so they may move on to trade schools or even the workforce with an even greater advantage. As the use of technology increases in the workforce, having such knowledge is a major plus for incoming workers and Watson said Industry 4.0 will put students on track to a successful future. “It’s really exciting and not only a great opportunity for the Utica Shale Academy, but also for Southern Local. It’s a great collaborative for the schools and allows students to have hands-on experience,” Southern Local Superintendent Tom Cunningham said. “Hopefully we can build up our career tech programs. Everyone’s calling for more career tech options for our kids and I think this is a great start.”
Transparency, Environmental Concerns Surround Proposal To Barge Oil And Gas Waste On The Ohio River — A proposal to repurpose a docking facility near Marietta, Ohio, to allow for the barging of oil and gas drilling waste on the Ohio River is drawing concern from environmental groups and local residents.Ohio-based DeepRock Disposal Solutions LLC is seeking approvalfrom the U.S. Army Corps of Engineers Huntington District to operate a barge offloading facility to transfer the waste to existing storage tanks. The proposal indicates the loading facility can accommodate a 300-foot-long barge that is 54 feet wide.It is the third barging proposal this year being considered by federal regulators. A proposal near Martins Ferry, Ohio, and one near Portland, Ohio, both to build new barging loading facilities have already been approved.Opponents of the projects fear the barges will eventually carry millions of gallons of briny fracking waste laced with radioactive elements as well as other, unknown chemicals. The chemical makeup of fracking fluid is considered proprietary.Robin Blakeman, project coordinator with the Ohio Valley Environmental Coalition, said her main concern is the possibility of spills or leaks occurring during loading or unloading of the waste or on the river. She said a spill would threaten both the river’s ecosystems and the drinking water for about 5 million people who draw their tap water from the Ohio River.”The proposed facility would involve the transport and handling of enormous amounts of oil and gas waste, which has the possibility of radioactive content and definitely has hazardous components,” she said. “The toxic contents of this oil and gas waste could be huge.”DeepRock Disposal declined a request for an interview about the nature of the project.It’s unclear if oil and gas waste is currently being barged on the river. A spokesperson for the U.S. Coast Guard, which regulates shipping on the river, said the Guard could only provide that information through a records request. The Coast Guard Marine Safety Unit Pittsburgh said no produced water is being transported by vessel in their area of responsibility, which includes a small portion of the Ohio River.
Shale Consolidation: Two US Tight-Gas Producers Merge in All Stock-Deal – Houston-area based Southwestern Energy announced that it is acquiring Montage Resources in an all-stock deal that will make the buyer the third-largest producer of the gas-rich Appalachian Basin. The Dallas-area based Montage holds about 325,500 acres in the Marcellus Shale and Utica Shales that span Ohio, West Virginia, and Pennsylvania.The arrangement will see each of Montage’s shares exchanged for about 1.8 of Southwestern’s shares, which based on the closing price of 11 August places the value of Montage at around $204 million.Notably, there is no stock premium attached to the deal as was once the norm. After energy investors grew worried about high debts and low returns, equity deals without an above-market premium became more common since they carry less leverage over to the buyer.Upon closing, Southwestern’s production will grow by nearly a quarter to around 3 Bcfe/D – a figure mostly based on natural gas, but inclusive of some liquids- and crude-oil production. Further, Southwestern’s total acreage position will grow by more than 70% to about 787,200 acres. The operator expects to also be on track to generate $100 million in free cash flow by next year based on current gas prices, an effort to be aided by an expected $30 million in reductions of general and administrative costs, according to a company statement. In 2018, Southwestern turned its full attention to the Appalachian region after selling off its legacy assets in Arkansas’ Fayetteville Shale – a gas-rich formation the company discovered – in a cash deal valued at $1.87 billion to privately owned producer Flywheel Energy. Montage was formed in 2019 through the merger of two other gas companies, Eclipse Resources and Blue Ridge Mountain Resources.
Mariner East construction spills 10,000 gallons of drilling mud into Chester County lake – Sunoco’s Mariner East pipeline construction caused an estimated 10,000 gallons of drilling mud, or bentonite clay, to spill into Marsh Creek and Marsh Creek Lake at a state park in Chester County this week.The Department of Environmental Protection has shut down two underground drilling sites, in West Whiteland Township and Upper Uwchlan Township, pending an investigation. West Whiteland resident Ginny Kerslake said that she began to notice drilling mud seeping up onto her yard on Saturday morning, and that by the afternoon it became “a full blown river of mud across my property.”At Marsh Creek State Park in Upper Uwchlan, an estimated 10,000 gallons of drilling mud seeped into the creek and made its way into the lake, according to the DEP. The lake is a popular recreation site and provides drinking water for Chester County residents. It’s unclear whether any drinking water supplies have been or will be affected.Kerslake, who is a member of the pipeline opposition group Del-Chesco United for Public Safety, said she went out on the lake with her paddle boat on Monday.”And as I was going in, it was getting murkier and murkier, and then it looked An aerial shot of Marsh Creek Lake in Chester County shows muddy water where drilling mud has leaked from pipeline construction. Drilling mud, or bentonite clay, is nontoxic. But in large quantities, it creates cloudiness, which could impact smaller aquatic life like macroinvertabrates. DEP spokesperson Virginia Cain said that there have been no fish kills, but that an investigation into the effects on other aquatic life is ongoing. Officials said there are other affected sites under investigation at an apartment complex in West Whiteland Township.Environmental groups and citizens frustrated with continued incidents like the recent spill have called on the DEP to halt all construction on the Mariner East pipeline. “Sunoco will keep on spilling and keep on polluting our water supplies until they shut down, and DEP has the power to do that,” said Alex Bomstein, an attorney with Clean Air Council, an organization that has sued the company over pollution. “There comes a point where you don’t give second and third and fourth chances.”
Paddle protest at Marsh Creek Lake calls for Mariner East shutdown – As cleanup crews worked to remove thousands of gallons of drilling mud from a Chester County lake on Wednesday, residents gathered to protest the Mariner East pipeline project, citing a litany of environmental damage. Construction on the line caused about 8,000 gallons of drilling mud to seep into a stream that feeds the lake, which is popular for boating, fishing and birding. Following a rally on the banks of the 530-acre Marsh Creek Lake, several dozen protesters paddled out to the site of a plume of muddy water caused by nearby horizontal directional drilling (HDD). HDD uses bentonite clay, often referred to as drilling mud, to lubricate a large drill bit that bores beneath the surface, making way for the 20-inch pipe. The project, which is mostly complete, includes three separate pipes that carry natural gas liquids from the shale fields of western Pennsylvania to an export terminal in Delaware County. Construction of the line has hit several snags in Chester County, where the karst, or limestone geology, creates difficulties for large-scale industrial projects that use underground drilling. As the boaters paddled closer to the site, they watched as clear water became cloudier. “It’s unbelievable that this actually happened,” said Chris DiGiulio, who lives nearby and regularly paddles on the lake. “We kind of knew it was going to happen though, it’s predictable actually, they’re not following good scientific practices, good engineering practices when it comes to mitigating the risks.” In the distance, a yellow boom was set up to prevent more mud from flowing from the creek to the lake. A helicopter and drone flew overhead. Water from Marsh Creek Lake runs into the Brandywine River, which provides drinking water to residents of Chester County. The Brandywine flows into the Christiana River, and then into the Delaware Bay. The Department of Environmental Protection says there have been no known impacts to drinking water supplies downstream.
Seneca Continuing Appalachian Shut-ins on Weak Natural Gas Prices – Seneca Resources Co. LLC cut its drilling program to one rig in June and continues to curtail Appalachian spot market production as it has for most of its fiscal year because of low natural gas prices. Seneca, National Fuel Gas Co.’s (NFG) upstream affiliate, curtailed 7.3 Bcf production during the fiscal third quarter (3Q2020) “due to sustained low Appalachian pricing. The shut-ins came on top of the 2.7 Bcf the company curtailed in the 2Q2020. NFG said last week it’s assuming New York Mercantile Exchange (Nymex) prices will average $1.85/MMBtu for the remainder of the fiscal year ending Sept. 30. Given the forward curve and Appalachian basis, NFG said Seneca would likely curtail this year’s remaining 6 Bcf of Pennsylvania production volumes that are exposed to the spot market. The company still produced 56 Bcfe during the quarter, up 1.3 Bcfe from the year-ago period. The gain was primarily related to production from new Marcellus and Utica shale wells. NFG also released preliminary fiscal 2021 guidance, indicating Seneca should produce 305-335 Bcfe, or 77.5 Bcfe more than in2020. The gain is expected to be driven by new acreage acquired in western and north-central Pennsylvania from Royal Dutch Shell plc. Given the decline in Seneca’s activity this year, both in Appalachia and Kern County, CA, where it has legacy oil operations, capital expenditures for the exploration and production segment are expected to be $290-330 million next year, or $75 million less than this year. Average realized natural gas prices, including hedges, declined by 44 cents from a year ago to $1.92/Mcf.
New poll shows majority of Pennsylvanians oppose fracking – Any conversation around natural-gas drilling, aka fracking, in Pennsylvania and politics is a tinderbox. Many pundits have proclaimed that opposition to fracking is a political taboo in the commonwealth, and some candidates even try to project that an opponent is opposed to fracking for political gain. But those political maneuvers and opinions appear largely out of touch with reality. A new CBS/YouGov poll of Pennsylvanians shows that a slight majority of the state now opposes fracking, with 52% of voters opposed and a corresponding 48% voting in favor of fracking.That goes against the conventional wisdom that politicians can’t run on anti-fracking policies in Pennsylvania. In fact, in fracking-friendly Allegheny County,three political candidates won their primary elections this year while running on strong criticism of fracking and its related industries. Two of those candidates are sure to win the general election in their Democratic heavy districts, and one, Lissa Geiger Shulman, is running in a Republican held-district.State Rep. Summer Lee (D-Swissvale) is one of the most vocal fracking opponents in the state. Her 2020 opponent ran almost exclusively on a pro-fracking platform, and Lee won with 75% of the vote, improving on her 2018 margin of victory by 16 points. The CBS poll also asked which presidential candidate would do a better job at handling the issues surrounding natural-gas and oil exploration, including fracking, but didn’t specify what those issues were. The poll showed that 45% think that President Donald Trump would do a better job, and 42% believe Joe Biden would do a better job. Recent Pennsylvania polls have shown a mixed bag on fracking support, but they appear to show opposition against fracking is growing. In November 2019, a Cook Political Report/Kaiser poll said that 57% of Pennsylvanians opposed a ban on fracking, and that 39% supported a fracking ban. In January of this year, 48% of registered Pennsylvania voters supported a ban on fracking compared to 39% who opposed a ban, according to a Franklin & Marshall College poll. That same poll also said that 48% of Pennsylvania voters say they support natural-gas drilling in the state, while 44% oppose.
Duke takes $1.6 billion charge to exit Atlantic Coast natgas pipe – (Reuters) – U.S. energy company Duke Energy Corp said Monday it took a $1.6-billion after-tax charge in the second quarter for the cancellation of the Atlantic Coast natural gas pipeline from West Virginia to North Carolina. Atlantic Coast was the most expensive U.S. gas pipeline under construction when Duke and partner Dominion Energy Inc exited the $8-billion project in July due to regulatory uncertainty following years of delays and billions of dollars of cost overruns. Dominion already took a $2.8 billion charge related to the cancellation. Atlantic Coast is just one of several U.S. oil and gas pipelines mired in legal and regulatory battles with local and environmental groups that have found problems with U.S. permits issued by Trump administration agencies. When Dominion, which led the Atlantic Coast project, started work on the 600-mile (966-km) pipe in the spring of 2018, the company estimated it would cost $6.0-$6.5 billion and be completed in late 2019. Weeks before canceling the project, however, Dominion said it could finish the project in early 2022 only if it received new federal permits soon that would survive court challenges. In addition to regulatory delays, Atlantic Coast was also hurt by a short-term hit to gas demand from coronavirus and a longer-term hit from growing consumer interest in cleaner energy.
BREAKING: DEQ denies key permits for MVP Southgate natural gas pipeline | NC Policy Watch – Another natural gas pipeline in North Carolina has been derailed, at least temporarily, as the North Carolina Department of Environmental Quality has denied a water quality permit for the MVP Southgate project that would route through Rockingham and Alamance counties.In a letter released this afternoon, Division of Water Resources Director Danny Smith wrote, “Due to uncertainty surrounding the completion of the MVP Mainline project,” it has determined that “work on the Southgate extension could lead to unnecessary water quality impacts and disturbance of the environment in North Carolina.” MVP Southgate would run from Chatham, Va., and enter North Carolina near Eden, in Rockingham County. From there, it would route nearly 50 miles southeast, cutting through Alamance County and ending in Graham. Construction costs are roughly $470 million. In total, the southern portion would cross 207 streams, three ponds and temporarily affect 17,726 linear feet of streams, 6,538 square feet of open waters, and 14 acres of wetlands; another 0.02 of an acre of wetlands would be permanently damaged. Nearly 14 acres of riparian buffers would also be affected. MVP Southgate would cross the Dan River, home to endangered and threatened species, and Stony Creek Reservoir, the main drinking water supply for the City of Burlington. MVP Southgate is an extension of the controversial main Mountain Valley Pipeline project, which runs for 303 miles from a fracked gas operation in northern West Virginia to southern Virginia. The mainline has racked up hundreds of environmental violations and prompted state and federal regulators to issue dozens of stop-work orders. Construction on the main line is currently halted, per a FERC stop-work order. That project’s costs have ballooned to $6.2 billion. Most of the environmental harm would occur during construction, the division wrote, adding that it “finds it is inappropriate to unnecessarily risk impacting high-quality waters and drinking water supplies of North Carolinians.”Examples of this harm can be seen in the wake of construction of the now-defunct Atlantic Coast Pipeline, which destroyed miles of private farmland and forests in several North Carolina counties, Policy Watch reported on July 30. It’s yet unclear how those environmental harms will be remedied.
North Carolina Denies Key Water Permit to Mountain Valley Pipeline Extension – It’s been a bad summer for fracked natural gas pipelines in North Carolina. First, the Atlantic Coast Pipeline, which would have ended in the state, wascanceled by its owners following years of legal challenges. Now, the North Carolina Department of Environmental Quality (NC DEQ) has denied a key water permit for a project that would have extended the controversial Mountain Valley Pipeline(MVP) 75 miles into the state. The MVP Southgate project would extend the main Mountain Valley Pipeline from where it now ends in Chatham, Virginia through Eden, North Carolina and ending in Graham, North Carolina, NC Policy Watch explained.To do this, it would have to cross 207 streams and three ponds. These include the Dan River, which is home to endangered species, and the Stony Creek Reservoir, which is the main source of drinking water for the city of Burlington.In issuing its decision Tuesday, NC DEQ ruled the risks to the state’s water supply were not worth the trouble, especially since there are doubts over whether the main Mountain Valley Pipeline will ever be built.Construction on the MVP, which would carry fracked natural gas 303 miles from northern West Virginia to southern Virginia, is currently halted by an order from the Federal Energy Regulatory Commission (FERC). The pipeline has already racked up more than $2 million in fines owing to more than 300 water quality violations in both states, the Natural Resources Defense Council pointed out.While MVP’s owner EQT Corporation claims construction on the project is 92 percent completed, a recent analysis of MVP filings with the FERC revealed the project is only around 50 percent finished, Jonathan Sokolow wrote for the Virginia Mercury.But beyond the proposed pipeline’s dependence on the uncertain MVP, DEQ Secretary Michael Regan also questioned the need for more natural gas infrastructure in general.”North Carolina’s clean energy future is not dependent on adding more natural gas infrastructure,” Regan said in a statement reported by NC Policy Watch. “Projects like this slow down the state’s goal to reduce greenhouse gases under North Carolina’s Clean Energy Plan and our efforts to address climate change under Executive Order 80. We should invest in clean, renewable energy sources and the economic benefits of energy innovation.”
MVP Southgate natgas pipe startup seen in 2021 despite N.Carolina permit denial (Reuters) – The companies developing the Mountain Valley Southgate natural gas pipeline expansion from Virginia to North Carolina said on Wednesday they continue to target a 2021 startup for the project after North Carolina regulators denied a water permit. The North Carolina Department of Environmental Quality (DEQ) denied the permit on Tuesday due to uncertainty around whether Equitrans Midstream Corp will ever complete the $5.4 bllion-$5.7 billion Mountain Valley Pipeline (MVP) from West Virginia to Virginia. A unit of Equitrans is leading the MVP project. “We are disappointed by the decision,” project spokesperson Shawn Day said, noting “Work on MVP is 92% complete, and that project is targeted to enter service in early 2021.” Mountain Valley is one of several U.S. oil and gas pipelines delayed by regulatory and legal fights with environmental and local groups that found problems with federal permits issued by the Trump administration. Other projects similarly held up include Dominion Energy Inc’s $8 billion Atlantic Coast gas pipe that was canceled in July. The North Carolina rejection caused some analysts to question whether Equitrans will be able to finish Southgate by the end of 2021, if ever. “We are skeptical the DEQ will issue the permit until MVP is fully operating, if ever,” analysts at Height Capital Markets in Washington, D.C., said, noting they expect MVP to enter service in 2021. When Equitrans started construction on MVP in February 2018, it estimated the project would cost about $3.5 billion and enter service by the end of 2018. The 303-mile (488-kilometer) MVP mainline is designed to carry 2 billion cubic feet per day (bcfd) of gas from the Marcellus and Utica Shale in Pennsylvania, West Virginia and Ohio. The 75-mile Southgate extension is designed to carry 0.3 bcfd to Dominion’s North Carolina subsidiary and could be expanded to 0.9 bcfd.
New: DNR finalizing review of Line 5 easement compliance ⋆ After nearly 14 months, the Michigan Department of Natural Resources (DNR) appears to have wrapped up its intensive review of Canadian oil company Enbridge’s compliance with the key state agreement governing the controversial Line 5 dual oil pipeline. The contents of that review could unlock Gov. Gretchen Whitmer’s executive ability to shut down the pipeline, which runs for miles beneath the choppy Straits of Mackinac waters. “We are working with the governor’s office to finalize the review. We don’t know for certain when that process will be complete, but are hopeful it will be soon,” DNR spokesperson Ed Golder told the Advance. Prior to this week, the DNR had maintained that the process was ongoing with no timeline in place for its completion. Whitmer ordered the department to conduct a thorough review of Enbridge’s 1953 easement with the state of Michigan last June, after her negotiations with Enbridge fell through and the company filed a lawsuit against the state. That day – June 27, 2019 – was also when Attorney General Dana Nessel filed a countersuit against Enbridge to decommission Line 5 on grounds of public trust violations. That lawsuit remains ongoing in the Ingham County Circuit Court.
Study: Partial Line 5 shutdown has not impacted gas prices, despite Enbridge warnings ⋆ New research from a former Dow chemical engineer has found that, despite Canadian oil company Enbridge’s predictions otherwise, the continued partial shutdown of its Line 5 pipeline in the Straits of Mackinac has so far not affected gas prices or supply in Michigan or Canada. “For a period of [52] days … there has been no deviation for the price of gasoline in Michigan versus the price of gasoline throughout the U.S.,” the study reads. ” … Even the forecast of a small price increase … is proving not to be true.” Enbridge has long warned that there would be dire economic consequences to shutting down Line 5 for any duration. Both legs of the dual underwater pipeline were shut down for roughly eight days total in June, six of which were court-ordered after Attorney General Dana Nessel was granted a temporary restraining order on Line 5. That action was taken as part of Nessel v Enbridge Energy LP, et al., Nessel’s ongoing lawsuit against Enbridge in the Ingham County Circuit Court that seeks a permanent decommissioning of Line 5. Since then, only the west segment of the pipeline has been in operation during the last 52 days as federal regulators at the Pipeline and Hazardous Materials Safety Administration (PHMSA) investigate significant damage to a support anchor on Line 5’s east leg.
Tribes granted permission to assert treaty rights in Line 5 tunnel case – Four Michigan tribes have been granted permission to participate in a regulatory case involving plans to tunnel the Line 5 pipeline in the Straits of Mackinac, giving three of them an opportunity to formally assert their treaty rights this way for the first time. Administrative Law Judge Dennis Mack this week granted permission for Bay Mills Indian Community, Grand Traverse Band of Ottawa and Chippewa Indians, and Little Traverse Bay Bands of Odawa Indians to formally intervene in the case pending before the Michigan Public Service Commission. Mack also granted the status to the Nottawaseppi Huron Band of the Potawatomi, which is based in Calhoun County near the site of the Line 6B pipeline spill in 2010. That pipeline is also owned by Enbridge. Bay Mills Tribal Attorney Whitney Gravelle said it was a historic decision, and the first time tribes will formally intervene in a case before the MPSC. Moreover, it gives tribes the first opportunity to assert treaty rights in their broader effort to decommission the pipeline. Gravelle said the tribes are “really excited and looking forward” to participating in the case. Tribes’ treaty rights that date back to 1836 – and effectively give them property rights across a wide swath of the Lower Peninsula and the eastern half of the Upper Peninsula – are at the center of their opposition to Line 5, as MiBiz recently reported. “It’s important for people to continue to understand that Line 5 puts the tribal way of life, tribal treaty rights and tribal cultural resources at risk every single day and it’s time to decommission the pipeline,” Gravelle said. The case before the MPSC will determine whether Enbridge can relocate Line 5 to a planned tunnel beneath the Straits of Mackinac. An agreement reached between Enbridge and the state in the final weeks of Gov. Rick Snyder’s administration outlined the deal, which has since become a strong point of contention for opponents who say it favors a private company over public rights in the Great Lakes. The deal would involve relocating the pipeline, which tribes argue would conflict with their treaty rights in the area.
Could new oil pipeline under St. Clair River soon be out of business? – “Enbridge could very well end up with a lot of great infrastructure in the St. Clair River and nothing going through it,” said David Holtz, a spokesperson for Oil and Water Don’t Mix, a Traverse City based group opposed to Line 5. That sounds preposterous for a multi-million dollar project that opened July 30. But while there has been no sustained opposition to the installation of new section of Line 5 under the St. Clair River, the section of Line 5 crossing at the Straits of Mackinac has been highly controversial — its existing twin pipelines along the bottom of the Straits and Enbridge’s proposal to build a hard-walled tunnel for a new 30-inch line. Opponents to Line 5 include five First Nation tribes, a slew of environmental organizations, thousands of summer home owners, the Up North tourism industry as well as key political figures , such as Governor Gretchen Whitmer and Michigan Attorney General Dana Nessel. The tunnel in the Straits and the newly drilled crossing under the St. Clair River were both part of a backroom deal struck between Enbridge and lame duck Governor Rick Snyder in November 2017. Together, the two projects would theoretically provide a much greater level of protection to the Great Lakes from an oil spill. But Enbridge’s troubled safety record continues the haunt its efforts to upgrade its petroleum transportation system. The company’s most salient blemish remains the rupture of Line 6B near Talmadge Creek in 2010, which poured a million barrels of crude oil into the creek and surrounding wetland. The spill reached the Kalamazoo River on its way to becoming the largest inland oil spill in American history. Line 5 opponents include the five tribes that gained rights to their historic fishing grounds in the Straits as a result of the 1836 Treaty of Washington in which they gave the U.S. 14 million acres in the northern lower peninsula and Upper Peninsula as a precondition of Michigan’s statehood. The tribes — the Bay Mills Indian Community, Grand Traverse Band of Ottawa and Chippewa Indians, Little River Band of Ottawa Indians, Little Traverse Bay Bands of Odawa Indians and Sault Ste. Marie Tribe of Chippewa Indians — are organized as the Chippewa Ottawa Resource Authority. Apart from a spill, which would automatically violate the treaty, “trenching and tunneling beneath the Straits of Mackinac will have significant adverse effects to the Treaty Fishery in that area, including significant disruptive effects on the bottomlands, water quality, fish spawning shoals and will require disruption of tribal commercial and subsistence fisheries,”
Enbridge Won’t Condemn Private Property For Pipeline Reroute In Northern Wisconsin | Wisconsin Public Radio – A Canadian energy firm says it won’t seek to condemn private property for a proposed pipeline relocation project in northern Wisconsin because it’s reached agreements with around 300 landowners along the route.Enbridge wants to move its Line 5 pipeline after the Bad River Band of Lake Superior Chippewa filed a lawsuit to shut down and remove it. The line, which carries up to 23 million gallons of crude oil and natural gas liquids from Superior to Sarnia, Ontario, crosses a 12-mile stretch of the tribe’s reservation.The company withdrew its application with the Public Service Commission on Friday. Regulators would have reviewed whether the 40-mile reroute was in the public interest, and Enbridge was set to face a contested case hearing. That is no longer necessary, according to Trent Wetmore, director of Midwest Operations for Enbridge. “We designed and have now acquired an approximate 40-mile route, which will minimize environmental and social impacts while protecting sensitive resources,” said Wetmore. Landowners, community members and environmental groups have disputed the company’s claims that it can build a pipeline with minimal impacts to the Bad River Watershed, which drains into Lake Superior. They fear the project threatens the water quality of more than 180 waterbodies, as well as groundwater supplies to homes in the area.Bad River Tribal Chairman Mike Wiggins has also said the tribe intends to fight to remove Line 5 from the region due to the significance of the watershed. Enbridge offered the tribe a $30 million settlement, while Bad River asked for $45 million for trespassing in addition to shutting down and removing the pipeline
Q&A: Federal Court Says Lawsuits Against Oil And Gas Companies Should Be Heard In State Court – In the latest development in several parishes’ efforts to sue oil and gas companies over damage to the Louisiana coast, a federal appeals court has said those lawsuits should be heard in state courts.That could pave the way for the trials to finally begin, several years after the lawsuits were first filed.To talk about what this means and what happens next, reporter Travis Lux got all the wonky details from Mark Schleifstein, environment reporter for The Times-Picayune | The New Orleans Advocate. This interview has been edited for length and clarity.
Fifth Circuit says coastal lawsuits belong in state court; critics say case is ‘meritless’ – The U.S. Court of Appeals for the Fifth Circuit on Monday issued a ruling that two lawsuits seeking to make oil companies pay for alleged damage to south Louisiana’s environment belong in state court. The ruling is considered a victory for the parishes that brought the lawsuits and a setback for the companies, which argued the lawsuits should be heard in federal court. Parishes have filed 42 lawsuits against more than 200 companies. Gov. John Bel Edwards has supported the lawsuits. The plaintiffs say they believe the companies violated state law and state permits while harming the coastal environment, so the cases belong in state court. Critics of the lawsuit said decisions made decades ago were overseen by the federal government and that Monday’s ruling has nothing to do with the merits of the cases. “Today’s ruling does nothing to strengthen the factually and legally meritless claims at issue in this litigation,” Melissa Landry, speaking on behalf of the legal teams representing BP America Production Company, Chevron, ConocoPhillips, ExxonMobil Pipeline Company and Shell, said in a statement. “In whichever forum these cases are ultimately considered, these flawed legal attacks do not advance meaningful solutions to restore our coast.” Attorney John Carmouche, who represents many of the local plaintiffs, said the lawsuits allege violations of the Louisiana State and Local Coastal Resources Management Act of 1978 and the plaintiffs are not claiming violations of federal law. “The parish that is affected should rule on if the laws were violated in their parish,” Carmouche told The Center Square in December. But companies argue the parishes’ claims rest in part on actions the companies took during World War II, which raises a federal question. According to the Fifth Circuit, the defendants said they didn’t know about the World War II connection until reading a report Plaquemines Parish commissioned in 2018. The Fifth Circuit found the report restated information the parishes filed before the companies first attempt to remove the cases to federal court in 2013. The companies’ latest attempt to remove the cases is not timely, the court ruled.
Louisiana’s oil industry hoping for federal help until global fuel demand rebounds – Louisiana oil and gas leaders are asking for federal help to get through the worst downturn the state’s industry has seen since the 1980s. In April, an oversupply of oil combined with crashing demand amid the COVID-19 pandemic briefly pushed U.S. oil prices into negative territory for the first time ever. Traders were willing to pay to get rid of oil rather than figure out how to store it. The price has rebounded to about $40 or so per barrel, but that’s not high enough to give companies confidence to invest, said Gifford Briggs, who heads the Louisiana Oil and Gas Association. Recent reports indicate Saudi Arabia, Russia and other major oil-producing countries may increase production soon, which could bring prices down again, he said. At last count, there were 29 active oil rigs in Louisiana, Briggs said, counting nine in the Gulf of Mexico. In a normal year, there would be between 70 and 100, he said. Louisiana’s many service companies depend heavily on wells being drilled to stay busy. LOGA is asking Congress to consider using stimulus money to plug “orphaned” wells. Since 1993, Louisiana has plugged more than 3,300 abandoned wells at a cost of $128 million. But there are still an estimated 4,200 orphan wells remaining, and Briggs said the number likely is growing. Beyond the environmental benefit, a federally funded program to plug orphan wells could provide work to service companies and allow them to bring laid-off workers back. But it would only be a short-term bandage for an industry that would benefit far more from a robust economic recovery that increased demand for fuel. “We need people going to Disney,” Briggs said. “We need people getting on cruise ships. We need people traveling to conferences.” The oil and gas sector historically has seen many cycles of boom and bust. The current slump reminds many people in the industry of the 1980s crash that devastated Louisiana’s economy, said Lori LeBlanc, vice president of the Louisiana Mid-Continent Oil and Gas Association. But she said the industry never really recovered from the last major downturn in 2016.
LNG Train Starts Up on Gulf Coast – McDermott International Ltd. reported Monday that Train 3 at Cameron LNG has begun commercial operation. Sempra LNG, Total S.E. Mitsui & Co., Ltd. and Japan LNG Investment LLC jointly own Cameron LNG, which is located in Hackberry, La., along the Calcasieu Ship Channel. McDermott and Chiyoda have provided engineering, procurement and construction (EPC) services for Cameron LNG for the past six years. “This is a major accomplishment,” remarked Samik Mikherjee, McDermott’s group senior vice president for projects, in a written statement emailed to Rigzone. “We share this achievement with our partner, Chiyoda. I want to thank Andy Dadosky, our project director, and the thousands of team members, both past and present, that made it possible.” With three liquefaction trains, Cameron LNG is expected to export 12 million tonnes per annum (mtpa) of LNG, McDermott noted. In a separate written statement, Cameron LNG pointed out that all major Train 3 construction activities finished earlier this year and began receiving gas flow for testing in late April as the liquefaction plant reached the final stage of commissioning. The complex’s third and final train began producing LNG and shipping commissioning cargoes in May as part of the process to support stabilizing production and performance testing, the joint venture added.
Tellurian Scraps Two LNG Pipelines To Cut Costs – Tellurian is deferring all but one pipelines associated with the first phase of its proposed Driftwood liquefied natural gas (LNG) export project, the LNG producer said in an investor presentation. Tellurian has been trying to cut costs for its Driftwood LNG production and export terminal on the west bank of the Calcasieu River, south of Lake Charles, Louisiana, in view of the depressed market conditions for natural gas amid the pandemic. Tellurian has achieved cost reductions of 30 percent in its phase 1 planning for the project, including deferring the proposed Permian Global Access Pipeline, the Haynesville Global Access Pipeline, and the Delhi Connector Pipeline, which leaves just one pipeline to feed natural gas to the facility during phase 1. The company will also focus on sourcing cheap natural gas for the project, which has secured all permits and is shovel ready, if Tellurian decides to move ahead with the final investment decision (FID). At the Q2 results release last week, Tellurian’s President and CEO Meg Gentle said: “Tellurian has used the last few months to streamline Driftwood LNG, which is one of the lowest cost projects available globally at approximately $1,000 per tonne.” “Tellurian continues working to secure equity partners from around the globe and looks forward to delivering reliable energy in 2024,” Gentle added. Last month, Tellurian sold $35 million worth of new stock to a group of institutional investors to prop up its finances as the outlook for LNG remains pessimistic. Depressed global LNG demand continues to drive buyers of U.S. LNG to cancel cargoes for loadings in September. Earlier this year, when demand for natural gas across the world plunged due to the pandemic, buyers began to scrap loadings of U.S. LNG, as gas in storage from Europe to Asia was abundant after a milder winter and the coronavirus that wiped out a lot of previously expected demand.
Tellurian drops three gas pipelines from first phase of US LNG export project – – Tellurian will build only one of four proposed pipelines during the first phase of its Driftwood LNG export project if it decides to sanction the US facility, according to an investor presentation the company issued Aug. 12. The sharply scaled back midstream ambitions, combined with a focus on lower cost feedgas supplies, will allow Tellurian to reduce total initial project capital costs by 30%. The moves come amid global market conditions that have led to widespread cargo cancellations at existing US liquefaction terminals this summer and prompted multiple developers of new terminal projects, including Tellurian, to delay final investment decisions until 2021. Also, production cuts in some basins have impacted near-term demand for some proposed natural gas pipelines. Tellurian had long positioned itself as an integrated gas infrastructure company, with plans to produce its own feedgas in the Haynesville Shale and build a network of pipelines to connect those supplies and supplies from the Permian Basin and other plays to its Louisiana export terminal and to serve other customers. While the broader pipeline plans are not dead and can be revisited as market conditions warrant, for now the developer is deferring its 2 Bcf/d Permian Global Access Pipeline and 2 Bcf/d Haynesville Global Access Pipeline, according to the presentation. The company did not mention its proposed 2 Bcf/d Delhi Connector Pipeline in the presentation, but implied that project also has been deferred when it said the first phase of construction will include only the Driftwood terminal and the already permitted 4 Bcf/d Driftwood Pipeline. A spokeswoman declined to comment beyond what was in the presentation, which was posted to the company’s website and filed with the US Securities and Exchange Commission. After the project adjustments, total upstream, Driftwood pipeline, liquefaction and owner’s capital costs, based on a Phase 1 contractor guaranteed capacity of 14.4 million mt/year, translate to $1,042/mt, versus $1,473/mt estimated in January, Tellurian said. At full development, about half of the liquefaction terminal’s approved 27.6 million mt/year capacity is expected to be used by equity investment partners that Tellurian has been soliciting. The rest would be held by Tellurian to market on its own gas. The equity arrangements would require the partners to make a minimum upfront $500 million equity investment in the holding company that controls the Driftwood terminal and the pipelines that Tellurian builds, in exchange for the right to lift 1 million mt/year of LNG from the export terminal for the life of the facility. EVENTS
Blackstone May Sell Stake in Cheniere — Brookfield Asset Management Inc.’s infrastructure arm is in talks to acquire Blackstone Group Inc.’s minority stake in liquefied natural gas terminal operator Cheniere Energy Partners LP, according to people familiar with the matter. The alternative asset manager is working with a partner to acquire Blackstone’s interest, said the people, who asked to not be identified because the matter isn’t public. No final decision has been made and Brookfield Asset Management could opt to not proceed, they said. Blackstone’s stake is worth about $7.8 billion, according to data compiled by Bloomberg. Representatives for Brookfield Asset Management, Blackstone and Cheniere declined to comment. Cheniere Energy Partners’ units rose as much as 5.7% Tuesday. They closed up 3.1% to $39.00 in New York, giving the company a market value of about $18.9 billion. Cheniere Energy Partners, a limited partnership created by Cheniere Energy Inc., owns the first major U.S. liquefied natural gas export terminal. Blackstone agreed to invest about $1.5 billion in the company in 2012. The private equity firm owned 41.2% of the company as of June 30 while Cheniere Energy Inc. owned 48.6%, according to a regulatory filing this month.
U.S. natgas futures drops 4% as output rises, demand slides – (Reuters) – U.S. natural gas futures fell almost 4% on Monday on forecasts for slightly lower demand over the next two weeks than previously expected and a slow increase in output after prices jumped to a seven-month high last week. Traders noted futures soared last week in part because the market was no longer concerned prices will have to drop later this year to encourage producers to shut wells to prevent stockpiles from reaching tank tops. That is because power generators burned record amounts of gas during the hot summer to keep air conditioners humming and LNG exports are now picking up. Front-month gas futures fell 8.5 cents, or 3.8%, to settle at $2.153 per million British thermal units. On Friday, the contract closed at its highest since Dec. 26. Speculators last week boosted their long positions on the NYMEX for an eighth week in a row to their highest since November 2018 on expectations energy demand will rise as the economy rebounds when state governments lift more coronavirus-linked lockdowns. Data provider Refinitiv said average U.S. production rose to 88.7 billion cubic feet per day (bcfd) from 88.1 bcfd in July. That is still well below November’s all-time monthly high of 95.4 bcfd. U.S. LNG exports in August were on track to rise for the first time in six months. Pipeline gas flowing to the plants climbed to 4.1 bcfd in August from a 21-month low of 3.3 bcfd in July, when buyers canceled dozens of cargoes – the most in a month. Refinitiv projected U.S. demand, including exports, will rise from an average of 89.1 bcfd this week to 90.0 bcfd next week. But that is lower than Refinitiv’s outlook on Friday because last week’s higher gas prices will cause some power generators to burn more coal instead of gas.
U.S. natgas futures rise close to 7-month high on output drop, hot weather – (Reuters) – U.S. natural gas futures on Tuesday rose close to their highest since December on a reduction in output, forecasts for hot weather through late August and an increase in liquefied natural gas exports. Front-month gas futures rose 1.8 cents, up 0.8%, to settle at $2.171 per million British thermal units, putting the contract within a nickel of its highest close since Dec. 26. Looking ahead, futures for the balance of 2020 and calendar 2021 traded over the front-month by 18% and 27%, respectively, on hopes energy demand will rise as the economy rebounds from coronavirus lockdowns. U.S. output for Tuesday was on track to fall 2.5 billion cubic feet per day, the most in a day since May, to 87.2 bcfd, according to preliminary data from Refinitiv that is subject to change. Traders noted much of that production loss was in West Virginia due to maintenance this week on TC Energy Corp’s Mountaineer Xpress pipeline. Although U.S. and European gas contracts mostly trade on their own fundamentals, a 47% jump in prices at the European Title Transfer Facility (TTF) benchmark in the Netherlands so far in August helped drag U.S. gas up about 22% this month. That made it profitable for more U.S. LNG cargoes to go to Europe again for the first time in months. U.S. LNG exports in August were on track to rise for the first time in six months. Pipeline gas flowing to the plants climbed to 4.2 bcfd in August from a 21-month low of 3.3 bcfd in July, when buyers canceled dozens of cargoes.
-U.S. natgas futures ease as hot weather moderates – (Reuters) – U.S. natural gas futures eased on Wednesday on forecasts for demand to slowly decline now that the hottest part of the summer is past. That move lower came despite a drop in output this week due to pipeline maintenance and a steady increase in liquefied natural gas (LNG) exports. Front-month gas futures fell 1.9 cents, or 0.9%, to settle at $2.152 per million British thermal units, their lowest close since the start of August and down about 4% from last week’s highest close since December. Although U.S. and European gas contracts mostly trade on their own fundamentals, Wednesday’s 5% price drop at the European Title Transfer Facility (TTF) benchmark in the Netherlands on Wednesday weighed on U.S. gas. For the month, however, TTF was still up 35%, which made it profitable for more U.S. LNG to go to Europe. U.S. LNG exports were on track to rise in August for the first time in six months. Pipeline gas flowing to the plants climbed to 4.2 billion cubic feet per day (bcfd) so far this month from a 21-month low of 3.3 bcfd in July. Buyers canceled dozens of cargoes in July, the most of any month so far. Refinitiv projected U.S. demand, including exports, will slip from an average of 89.3 bcfd this week to 88.8 bcfd next week as the hot weather moderates. U.S. output is on track to fall about 2.2 bcfd to a near one-month low of 87.4 bcfd over the past two days due mostly to maintenance work this week on TC Energy Corp’s Mountaineer Xpress pipeline in West Virginia, according to preliminary data from Refinitiv that is subject to change later in the day.
U.S. natgas futures edge up on hot forecasts and lower output – (Reuters) – U.S. natural gas futures edged higher on Thursday on forecasts for the weather to remain hot and air conditioning demand high over the next two weeks, a slowdown in output and an increase in liquefied natural gas (LNG) exports. That price increase came despite a report showing an expected, bigger-than-usual storage build last week when the weather was milder than now. The U.S. Energy Information Administration (EIA) said U.S. utilities injected 58 billion cubic feet (bcf) of gas into storage in the week ended Aug. 7. That was in line with the 57-bcf build analysts forecast in a Reuters poll and compares with an increase of 51 bcf during the same week last year and a five-year (2015-19) average build of 44 bcf. Front-month gas futures rose 3.0 cents, or 1.4%, to settle at $2.182 per million British thermal units. Although U.S. and European gas contracts mostly trade on their own fundamentals, a 40% jump in prices at the European Title Transfer Facility (TTF) benchmark in the Netherlands so far in August helped pull U.S. gas up about 21% this month. That made it profitable for more U.S. LNG cargoes to go to Europe. U.S. LNG exports were on track to rise in August for the first time in six months. Pipeline gas flowing to the plants climbed to 4.2 billion cubic feet per day (bcfd) so far this month from a 21-month low of 3.3 bcfd in July. With LNG exports rising and the weather expected to remain hot through the end of August, Refinitiv projected U.S. demand, including exports, will average around 89.6 bcfd this week and next. U.S. output, meanwhile, is on track to fall about 1.8 bcfd to a two-week low of 87.8 bcfd over the past three days due mostly to maintenance work in West Virginia.
US working gas volumes in underground storage rise by 58 Bcf: EIA – Last week’s addition to US natural gas in storage proved larger than the market expected, expanding the storage surplus to the five-year average, but Henry Hub winter strip prices held firm as rising demand pushes down the build for the week in progress. US underground natural gas storage inventories increased 58 Bcf to 3.332 Tcf in the week that ended Aug. 7, according to data released by the US Energy Information Administration Aug. 13. The injection was larger than the consensus expectations of analysts surveyed by S&P Global Platts, who were calling for a 51 Bcf build. Responses to the survey were wide, ranging from an injection of 34 Bcf to one of 60 Bcf. The injection was larger than the 51 Bcf build reported during the same week a year ago as well as the five-year average increase of 44 Bcf, according to EIA data. It was also stronger than the 33 Bcf build reported for the week ended July 31. Fundamentals during the reference week were about 3.7 Bcf/d looser from the week before, led by a sharp decline in power burn demand. which was partially offset by gains in industrial and LNG feedgas demand, according to S&P Global Platts Analytics. Total supplies held steady, falling 200 MMcf/d to average 91.8 Bcf/d for the week. Downstream, total demand was down 3.9 Bcf/d week on week. Power burn demand fell by nearly 5 Bcf/d on the week, though increased deliveries to industrial end users, 300 MMcf/d, and to LNG liquefaction facilities, 700 MMcf/d, helped stem the demand losses. Storage volumes now stand 608 Bcf or 22% above the year-ago level of 2.724 Tcf and 443 Bcf or 15% higher than the five-year average of 2.889 Tcf. Forward NYMEX Henry Hub prices were mostly flat following a slightly larger-than-expected inventory increase reported by the EIA. The September contract added 1 cent to $2.16/MMBtu in trading following the release of the weekly storage report. Balance-of-summer NYMEX has seen notable strengthening in the last week and a half, rising from $1.88/MMBtu at the beginning of August to current levels of around $2.15.
U.S. natgas futures soar to 8-month high on hot weather forecasts – (Reuters) – U.S. natural gas futures soared on Friday to their highest since December on rising liquefied natural gas (LNG) exports and forecasts for the weather to remain hot and air conditioning demand high through the end of August. “Gas prices are moving higher … as a new surge of buying momentum enters an unsuspecting market,” said Daniel Myers, market analyst at Gelber & Associates in Houston, noting “There is widespread consensus that warmer than normal temperatures will extend the summer into (September).” Front-month gas futures rose 17.4 cents, or 8.0%, to settle at $2.356 per million British thermal units, their highest close since Dec. 5. That put the contract up 5% for the week after it soared 24% last week. Although U.S. and European gas contracts mostly trade on their own fundamentals, a 45% jump in prices at the European Title Transfer Facility (TTF) benchmark in the Netherlands so far in August helped pull U.S. gas up about 30% this month. That made it profitable for more U.S. LNG cargoes to go to Europe. U.S. LNG exports were on track to rise in August for the first time in six months. Pipeline gas flowing to the plants climbed to 4.2 billion cubic feet per day (bcfd) so far this month from a 21-month low of 3.3 bcfd in July. With LNG exports rising and the weather expected to remain hot through the end of August, Refinitiv projected U.S. demand, including exports, will increase from an average of 89.7 bcfd this week to 90.1 bcfd next week. Power usage in Texas, meanwhile, is expected to reach a record high on Friday and next-day electric prices in the West rose to their highest in years as a brutal heat wave blankets much of the western half of the country.
Railroad Commission candidate at center of lawsuit over troubled oil and gas waste disposal site – Jim Wright, the Republican nominee for a seat on the Railroad Commission, is a leading player in a controversy over an oil field waste facility in South Texas that involves lawsuits, environmental violations and the candidate securing the release of an $800,000 bond from the agency he hopes to help lead.Wright, a South Texas rancher and oil field service company owner, defeated Railroad Commissioner Ryan Sitton in the Republican Party primary in March. He faces Democrat Chrysta Castaneda in the November general election for the seat on the agency that regulates the oil and gas industry.Wright developed DeWitt Recyclable Products, about four miles north of Cuero, after receiving a permit in 2012 from the Railroad Commission. In 2014, he sold the project to the Florida company Watson Energy Investments in a $1.3 million deal, but remained listed as president of the company on agency records, court filings show.DeWitt opened in the summer 2016 and was touted as state-of-the-art. The facility was designed to take oil-soaked muds from drilling sites and other waste products and recycle them into crude oil, diesel fuel and clean dirt. The Railroad Commission, however, shut down the facility in Jan. 2017 after an inspector documented waste stockpiled directly on the ground, storage tanks for waste materials leaking onto the ground, and multiple unpermitted pits of waste. Shortly after the facility was shut down, Watson Energy Investments fell behind on its payments to Wright. He excercised an option in the contract to take control of the facility. In a lawsuit filed in March against his former business partners, Wright maintains that Watson still owes him $495,000 of payments from sale and another $180,000 in crude oil royalties..
Texas Hill Country pipeline project moves forward, despite pleas from Willie Nelson and Paul Simon – Houston pipeline operator Kinder Morgan moved forward on a controversial natural gas pipeline through the Texas Hill Country the same day that legendary musicians Willie Nelson and Paul Simon issued a public plea for the company to halt the project. Nelson, also known as the Red-Headed Stranger, and Simon on Tuesday voiced their opposition to the Permian Highway Pipeline in op-ed in the Houston Chronicle. The pipeline is a $2 billion project to move 2 billion cubic feet of natural gas per day from the Permian Basin of West Texas to the Katy Hub near Houston. Hours after the two musical stars released their op-ed, the Hays County Commissioners Court approved permits allowing the company to bore under three roadways to build the 42-inch pipeline.Now more than 79 percent complete, the last portion of the pipeline that needs to be completed is in the Texas Hill Country, where the company faces opposition from landowners concerned about safety and environmental issues in the picturesque region.”We have chosen the route carefully and paid landowners handsomely for the easements,” Kinder Morgan CEO Steve Kean said in a rebuttal to Nelson and Simon. “We will restore the land when construction is complete and have secured significant additional lands for endangered species habitat.” Opponents of the project frequently cite a March 28 accident that sent a mixture of clay and water used for drilling into wells in Blanco County. In his op-ed, Kean said that in addition to paying numerous expenses for affected landowners, the company is rerouting a two-mile portion of the pipeline project in Blanco County.
include(“/home/aleta/public_html/files/ad_openx.htm”); ?>


