from the St Louis Fed
— this post authored by Lowell Ricketts, Lead Analyst, Center for Household Financial Stability
Housing distress is on the rise among both renters and homeowners. Worse, it seems to be concentrated among groups that often exhibit other economic fragilities.

For many families, diminished economic activity during the pandemic has caused a pervasive income shock or sudden and potentially lasting loss of household income. Families with emergency savings are more likely to avoid hardships such as falling behind on bills. For those who do not have (or have exhausted) emergency funds, falling behind on rent or mortgage payments carries the risk of eviction or foreclosure.
As of late July (July 16-21), 12.5% of Americans were experiencing housing distress. (That is, they were late on their rent or mortgage payments, or their payments were deferred.) Loss of housing is similarly disruptive to both renters and owners on many dimensions. For homeowners, however, a foreclosure can destroy the equity accumulated on a home, which is often the largest asset a family owns.
Hardship Is Associated with Demographics and Renting
The Census Bureau’s Household Pulse Survey reveals that demographic factors are strongly associated with which families are experiencing hardship. (The most recent Pulse Survey data cover the period of July 16-21, 2020.) Specifically, the highest rates of housing distress were among families that:
- Identify as Black or Hispanic (of any race)
- Lack a four-year college degree
- Are part of Generation X, millennials or Generation Z
The Center for Household Financial Stability has documented how these same demographic factors are predictive of which families are achieving economic resilience and upward mobility in the form of wealth accumulation.
Additionally, whether someone rents or owns a home is also associated with housing distress. Given the significant differences between renters and homeowners, it’s important to compare these groups separately. Doing so reveals that rates of late or deferred payments were higher among renters rather than owners in nearly all demographic groups.1
Renters Are Experiencing the Most Housing Distress
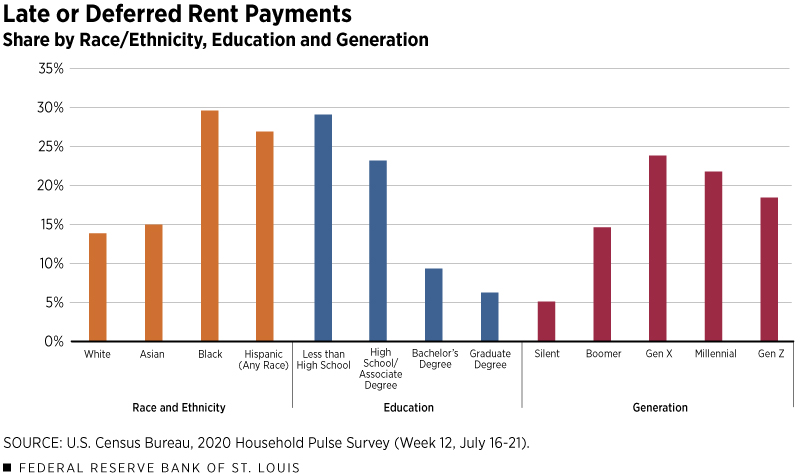
The figures below show how housing distress varies among renters by race/ethnicity, education and generation.2

Race/Ethnicity
We see that Black and Hispanic renters have roughly twice the rate of housing distress relative to their white and Asian peers.
Education
Education has the sharpest contrast, with those without a bachelor’s degree experiencing a distress rate roughly three times that of those with at least a bachelor’s degree. After accounting for statistical variation, there is no meaningful difference in distress rates between those that have a high school diploma up to an associate degree versus those that did not graduate from high school.
Generation
Lastly, the figure above also shows the current experience across five major generations of renters.3 The three youngest generations – Gen X, millennials and Gen Z – had higher distress rates relative to their older peers. While the estimates may vary across these three generations, there is no meaningful difference after accounting for statistical variation. This is surprising, given that members of Gen X are ages 40-55. As financial outcomes typically get stronger as families age, the similar rates of distress as their younger peers is concerning.
Consistent with previous work predicting who’s most vulnerable to an income shock, Black and Hispanic renters, those without a bachelor’s degree, and Gen X and younger are experiencing the highest rates of housing distress.
Black and Hispanic Homeowners Are Especially under Duress
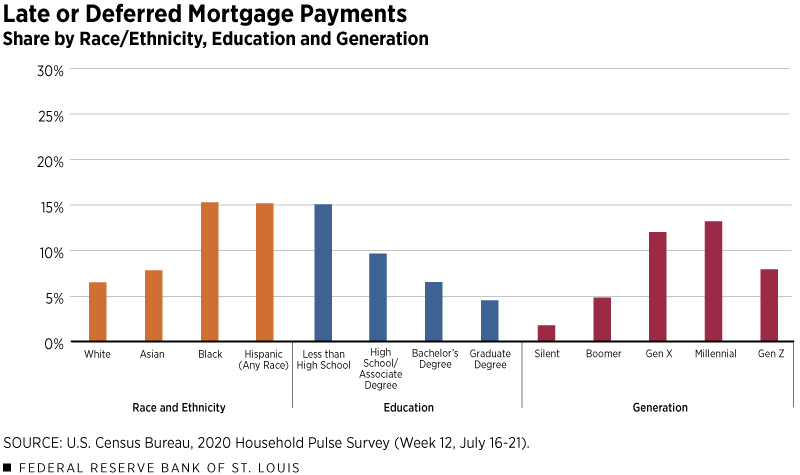
As seen during the Great Recession’s housing crash, homeowners are at risk of foreclosure. Foreclosure is destructive for family finances and makes recovering lost potential wealth much more difficult (if not impossible). The figure below shows the current landscape of distress among homeowners.

Race/Ethnicity
The conclusions are similar to that of renters. We see that Black and Hispanic homeowners are experiencing the greatest rate of distress. Even when considering only those who had a late payment (thus, excluding those who had a deferred payment), 9.5% and 10.8% of Black and Hispanic homeowners were experiencing distress, respectively.
Education
Distress among homeowners follows a different ordering than that of renters. Specifically, distress rates fall uniformly as education increases.
Generations
Among generations, Gen X and millennial homeowners are experiencing the most distress. While it is likely too early for many members of Gen Z to have acquired a home, those who have are experiencing significantly higher distress compared with their silent and boomer peers.
CARES Act Assistance Can Help; More Assistance May Be Needed
Both renters and homeowners may qualify for CARES Act assistance. Indeed, the deferment of payment included in the housing distress rate likely reflects some of the CARES Act, state or local assistance.
This begs the question: Why it is included as a form of distress? It’s included because forbearance does not forgive the amount owed; it pushes it off to the future.
As the COVID-19 recession continues, the future is uncertain. Accordingly, policymakers will have to “stick the landing” and renegotiate the repayment terms so that borrowers and renters do not have a lump sum due after an extended period of subdued earnings. For owners and renters alike, keeping the demographic dimensions of distress shown here in focus will allow better targeting of interventions to the families most in need.
Notes and References
- In the most recent survey, confidence intervals overlap between owner and renter families in the silent generation and graduate degree groups, which means that differences in rental and ownership distress are not statistically significant.
- The percentage shares in the charts exclude cases in which the respondent did not respond to the questions on tenure or whether rent or mortgage were on time.
- Pew generational definitions are used here, and generational ranges can vary in general. The silent generation birth year range (1932-45) is artificially shortened for reasons unknown to the author. The boomer (1946-64), Gen X (1965-80), millennial (1981-96) are as expected. The birth year range for Gen Z (1997-2002) is shorter given that the sample is restricted to the population 18 and older.
Additional Resources
- St. Louis Fed’s COVID-19 resource page
- On the Economy: COVID-19 and the Great Recession: Market Hours and Home Production across American Households
- On the Economy: Financial Distress and the Second Wave of COVID-19 Infections
Source
https://www.stlouisfed.org/on-the-economy/2020/august/housing-distress-time-covid19
Disclaimer
Views expressed are not necessarily those of the Federal Reserve Bank of St. Louis or of the Federal Reserve System.


