Written by rjs, MarketWatch 666
 Here are some selected news articles from the week ended 20 June 2020. Part 2 is available here.
This is a feature at Global Economic Intersection every Monday evening.
Please share this article – Go to very top of page, right hand side, for social media buttons.
Global oil surplus at 8.6 million bpd, despite 6.3 million bpd OPEC cuts. Wells drilled and wells completed lowest on record
Oil prices rose for the 7th week out of the past eight this week, on signs of rising demand and on the apparent success of the OPEC+ output cuts…after falling more than 8% to $36.26 a barrel last week on fears of a second wave of the coronavirus, the contract price of US light sweet crude for July delivery opened lower and slid to as low as $34.48 a barrel early Monday, as new coronavirus infections hit China and the US, stoking fears of weak fuel demand, but rebounded from those early losses after the UAE energy minister voiced confidence that OPEC+ countries would meet their commitments and reported signs that oil demand was picking up, and ended Monday 86 cents higher at $37.12 a barrel…oil prices then followed a stock market rally higher on Tuesday, rising $1.26, or 3.4% to settle at $38.38 a barrel, after the International Energy Agency increased its oil demand forecast for 2020, citing higher than expected consumption during the lockdowns…but oil prices gave up some of those gains in post-settlement trade Tuesday evening after the American Petroleum Institute reported U.S. crude inventories rose by more than was expected, and thus opened lower & fell to $37.21 a barrel early Wednesday but finished off the day’s lows at $37.96 a barrel after the EIA reported that domestic product supplies had declined and oil traders weighed the data in the monthly OPEC report…oil prices rose more than 2% on Thursday on the output cut compliance indicated by that OPEC report to settle 88 cents higher at $38.84 per barrel after major producers at a meeting of the Joint Ministerial Monitoring Committee (JMMC), which monitors compliance with OPEC output quotas, moved to ensure that certain countries made up for failing to fully meet their reduction targets last month….oil prices pushed higher in early trade on Friday after OPEC producers and their allies reaffirmed their supply cut commitments and two major oil traders said demand was recovering well and went on to finish 91 cents higher at a ten week high of $39.75 a barrel, a gain of nearly 10% for the week, as Iraq and Kazakhstan submitted “compensations schedules” to the JMMC to make up for falling short of their pledges to reduce output…
Natural gas prices, on the other hand, ended lower for the 3rd straight week, as lower gas output and warmer weather forecasts weren’t enough to offset the impact of falling exports…after falling 2.9% to a two-week low of $1.731 per mmBTU last week on milder weather that reduced demand for air conditioning, the contract price of natural gas for July delivery tumbled 6.2 cents to a one month low $1.669 per mmBTU on Monday, on forecasts for lower demand over the next two weeks than was previously expected, despite a report of slowing production…prices then fell another 5.5 cents to a two month low on Tuesday, as already depressed LNG exports were reported still lower, while natural gas production was reported higher….but prices recovered 2.4 cents of their losses on Wednesday, on a forecast for warmer weather and greater demand in the coming week…natural gas prices held steady at $1.638 per mmBTU on Thursday, as a continued drop in LNG exports offset the forecast for an increase in demand next week and then rose 3.1 cents to finish the week at $1.669 per mmBTU, as forecasts for warmer weather and higher air conditioning demand over the next two weeks intensified…
The natural gas storage report from the EIA for the week ending June 12th indicated that the quantity of natural gas held in underground storage in the US rose by 85 billion cubic feet to 2,892 billion cubic feet by the end of the week, which left our gas supplies 722 billion cubic feet, or 33.3% higher than the 2,170 billion cubic feet that were in storage on June 12th of last year, and 419 billion cubic feet, or 16.9% above the five-year average of 2,473 billion cubic feet of natural gas that has been in storage as of the 12th of June in recent years….the 85 billion cubic feet that were added to US natural gas storage this week was above the consensus forecast from S&P Global Platts’ survey of analysts calling for a 79 billion cubic feet increase, but it was a bit less than the average of 87 billion cubic feet of natural gas that have been added to natural gas storage during the same week over the past 5 years, and it was well below the 117 billion cubic feet addition of natural gas to storage during the corresponding week of 2019…
The Latest US Oil Supply and Disposition Data from the EIA
US oil data from the US Energy Information Administration for the week ending June 12th indicated that even with a big drop in our oil production and a modest decrease our oil imports, we still had surplus oil to add to our stored commercial supplies of crude oil for the 3rd time in six weeks, and for the 29th time in the past forty weeks….our imports of crude oil fell by an average of 222,000 barrels per day to an average of 6,642,000 barrels per day, after rising by an average of 685,000 barrels per day during the prior week, while our exports of crude oil rose by an average of 23,000 barrels per day to an average of 2,462,000 barrels per day during the week, which meant that our effective trade in oil worked out to a net import average of 4,180,000 barrels of per day during the week ending June 12th, 245,000 fewer barrels per day than the net of our imports minus our exports during the prior week…over the same period, the production of crude oil from US wells fell by 600,000 barrels per day to 10,500,000 barrels per day, and hence our daily supply of oil from the net of our trade in oil and from well production totaled an average of 14,680,000 barrels per day during this reporting week..
US oil refineries reported they were processing 13,600,000 barrels of crude per day during the week ending June 12th, 116,000 more barrels per day than the amount of oil they used during the prior week, while over the same period the EIA’s surveys indicated that a net of 421,000 barrels of oil per day were being added to the supplies of oil stored in the US….so based on that reported & estimated data, this week’s crude oil figures from the EIA appear to indicate that our total working supply of oil from net imports and from oilfield production was 659,000 barrels per day more than what was added to storage plus what our oil refineries reported they used during the week….to account for that disparity between the apparent supply of oil and the apparent disposition of it, the EIA just plugged a (-659,000) barrel per day figure onto line 13 of the weekly U.S. Petroleum Balance Sheet to make the reported data for the average daily supply of oil and the average daily consumption of it balance out, essentially a fudge factor that they label in their footnotes as “unaccounted for crude oil”, thus suggesting an error or errors of that magnitude in the oil supply & demand figures we have just transcribed…however, since the media usually treats these weekly EIA figures as gospel and since these figures often drive oil pricing and hence decisions to drill for oil, we’ll continue to report them as is, just as they’re watched & believed as accurate by most everyone in the industry…(for more on how this weekly oil data is gathered, and the possible reasons for that “unaccounted for” oil, see this EIA explainer)….
Further details from the weekly Petroleum Status Report (pdf) indicate that the 4 week average of our oil imports rose to an average of 6,721,000 barrels per day last week, which was still 10.0% less than the 7,467,000 barrel per day average that we were importing over the same four-week period last year….the 421,000 barrel per day net addition to our total crude inventories included 247,000 barrels per day that were added to our Strategic Petroleum Reserve, and 174,000 barrels per day that were being added to our commercially available stocks of crude oil ….this week’s crude oil production was reported to be down by 600,000 barrels per day to 10,500,000 barrels per day because the rounded estimate of the output from wells in the lower 48 states was down by 600,000 barrels per day to 10,100,000 barrels per day, while a 1,000 barrel per day increase in Alaska’s oil production to 361,000 barrels per day had no impact on the rounded national total….last year’s US crude oil production for the week ending June 14th was rounded to 12,200,000 barrels per day, so this reporting week’s rounded oil production figure was about 13.9% below that of a year ago, yet still 24.6% more than the interim low of 8,428,000 barrels per day that US oil production fell to during the last week of June of 2016…
Meanwhile, US oil refineries were operating at 73.8% of their capacity while using 13,600,000 barrels of crude per day during the week ending June 12th, up from 73.1% of capacity during the prior week, but still among the lowest refinery utilization rates of the last thirty years…hence, the 13,600,000 barrels per day of oil that were refined this week were still 21.2% fewer barrels than the 17,264,000 barrels of crude that were being processed daily during the week ending June 14th, 2019, when US refineries were operating at 93.9% of capacity….
With the increase in the amount of oil being refined, gasoline output from our refineries was also higher, increasing by 217,000 barrels per day to 8,356,000 barrels per day during the week ending June 12th, after our refineries’ gasoline output had increased by 360,000 barrels per day over the prior week… however, since our gasoline production is still recovering from a multi-year low, this week’s gasoline output was still 19.8% lower than the 10,423,000 barrels of gasoline that were being produced daily over the same week of last year….on the other hand, our refineries’ production of distillate fuels (diesel fuel and heat oil) decreased by 264,000 barrels per day to 4,498,000 barrels per day, after our distillates output had increased by 48,000 barrels per day over the prior week…after this week’s decrease in distillates output, our distillates’ production was 16.6% less than the 5,371,000 barrels of distillates per day that were being produced during the week ending June 14th, 2019….
Even with the increase in our gasoline production, our supply of gasoline in storage at the end of the week decreased for the 5th time in 8 weeks and for the 13th time in 20 weeks, falling by 1,666,000 barrels to 256,995,000 barrels during the week ending June 12th, after our gasoline supplies had increased by 866,000 barrels over the prior week…our gasoline supplies decreased this week because our imports of gasoline fell by 99,000 barrels per day to 530,000 barrels per day, and because our exports of gasoline rose by 187,000 barrels per day to 495,000 barrels per day, while the amount of gasoline supplied to US markets decreased by 30,000 barrels per day to 7,870,000 barrels per day….but even with this week’s inventory decrease, our gasoline supplies were still 10.2% higher than last June 14th’s gasoline inventories of 233,221,000 barrels, and roughly 10% above the five year average of our gasoline supplies for this time of the year…
With the decrease in our distillates production, our supplies of distillate fuels decreased for the twelfth time in 22 weeks and for the 22nd time in 37 weeks, falling by 1,358,000 barrels to 174,471,000 barrels during the week ending June 12th, after our distillates supplies had increased by 1,568,000 barrels over the prior week….our distillates supplies fell this week because the amount of distillates supplied to US markets, an indicator of our domestic demand, rose by 253,000 barrels per day to 3,555,000 barrels per day, while our imports of distillates fell by 14,000 barrels per day to 163,000 barrels per day and our exports of distillates fell by 112,000 barrels per day to 1,301,000 barrels per day,…even after this week’s inventory decrease, our distillate supplies at the end of the week were still 36.5% above the 127,821,000 barrels of distillates that we had stored on June 14th, 2019, and about 28% above the five year average of distillates stocks for this time of the year…
Finally, even with the drop in our crude oil output and the decrease in our oil imports, our commercial supplies of crude oil in storage rose for the 18th time in twenty-one weeks and for the 33rd time in the past 52 weeks, increasing by 1,215,000 barrels, from a record high of 538,065,000 barrels on June 5th to another all time high of 539,280,000 barrels on June 12th…that meant our our commercial crude oil inventories were around 15% above the five-year average of crude oil supplies for this time of year, and 53% above the prior 5 year (2010 – 2014) average of our crude oil stocks for the second week of June, with the disparity between those comparisons arising because it wasn’t until early 2015 that our oil inventories first topped 400 million barrels….since our crude oil inventories have generally been rising over the past year and a half, except for during last summer, after generally falling until then through most of the prior year and a half, our crude oil supplies as of June 12th were 11.8% above the 482,364,000 barrels of oil we had in commercial storage on June 14th of 2019, 26.4% above the 426,527,000 barrels of oil that we had in storage on June 15th of 2018, and 5.9% above the 509,095,000 barrels of oil we had in commercial storage on June 16th of 2017…
Furthermore, once again checking the total of our commercial oil supplies and the stockpiles of all the refined product made from oil, we find those supplies have increased by 7,085,000 barrels this week to another record high of 1,446,723,000 barrels, 10.3% more than the 1,311,841,000 barrel total of the same week a year ago…
OPEC’s Monthly Oil Market Report
Wednesday of this past week saw the release of OPEC’s June Oil Market Report, which covers OPEC & global oil data for May, and hence it gives us a picture of the global oil supply & demand situation during the first month of the two month agreement between OEC, the Russians, and other oil producers to cut production by 9.7 million barrels a day from an elevated October 2018 baseline….before we start, i have to caution that estimating oil demand while most countries on the planet are restarting their economies after a month or two of lockdown is pretty speculative, and hence the demand figures we’ll be reporting this month should be considered as having a much larger margin of error than we’d normally expect from this report..
The first table from this monthly report that we’ll review is from the page numbered 44 of this month’s report (pdf page 54), and it shows oil production in thousands of barrels per day for each of the current OPEC members over the recent years, quarters and months, as the column headings indicate…for all their official production measurements, OPEC uses an average of estimates from six “secondary sources”, namely the International Energy Agency (IEA), the oil-pricing agencies Platts and Argus, the U.S. Energy Information Administration (EIA), the oil consultancy Cambridge Energy Research Associates (CERA) and the industry newsletter Petroleum Intelligence Weekly, as a means of impartially adjudicating whether their output quotas and production cuts are being met, to thus avert any potential disputes that could arise if each member reported their own figures…
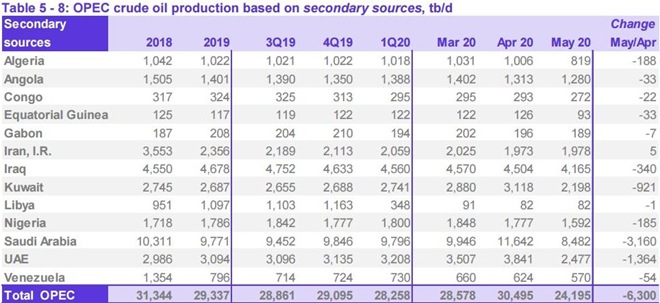
As we can see from the above table of oil production data, OPEC’s oil output was cut by 6,300,000 barrels per day to 24,195,000 barrels per day during May, from their revised April production total of 30,495,000 barrels per day…however that April output figure was originally reported as 30,412,000 barrels per day, which means that OPEC’s April production was revised 83,000 barrels per day higher with this report, and hence May’s production was, in effect, a 6,213,000 barrel per day decrease from the previously reported OPEC production figures (for your reference, here is the table of the official April OPEC output figures as reported a month ago, before this month’s revisions)…
From the table above, we can also see that production decreases of 3,160,000 barrels per day from the Saudis, 1,364,000 barrels per day from the Emirates, 921,000 barrels per day from Kuwait, and 340,000 barrels per day from Iraq accounted for the lion’s share of the May decrease, even as every other OPEC producer except for Iran, whose production is exempt from the agreement, also made appropriate production cuts…to facilitate understanding how each of the OPEC members have been adhering to their production cut agreement, we’ll next include a table which shows the October 2018 reference production for each of the OPEC members (as well as other producers party to the mid-April agreement), as well as the production level each of those producers was expected to cut their output to….

The table above was taken from an article at Zero Hedge, and it shows the oil production baseline in thousands of barrel per day off of which each of the oil producers will cut from in the first column, a number which is based on each of the producer’s October 2018 output, ie., a date before the past year’s and past quarter’s output cuts took effect; the second column shows how much each participant will cut in thousands of barrel per day, which is 23% of the October 2018 baseline for all participants except for Mexico, while the last column shows the production level each participant has agreed to after that 23% cut…sanctioned OPEC members Iran and Venezuela and war-torn Libya are exempt from these cuts…
With a net 6,300,000 barrels per day decrease in their production, it appears that OPEC has exceeded the 6,084,000 barrels per day they had committed to cut…however, the baseline for the May thru July cuts is OPEC’s production of October 2018, and the 6,300,000 barrels per day drop in their production represents the output change since April, so we can’t really compare the two…moreover, production of some of the OPEC members is still well above their target level…for instance, Iraq had committed to cut their production by 1,061,000 barrels per day and only produce 3,592,000 barrels per day in May, but they only cut their production by 340,000 barrels per day in May, and thus produced 4,165,000 barrels per day, 572,000 barrels per day more than they were supposed to…
The next graphic from this month’s report that we’ll include shows us both OPEC and world oil production monthly on the same graph, over the period from June 2018 to May 2020, and it comes from page 45 (pdf page 55) of the June OPEC Monthly Oil Market Report….on this graph, the cerulean blue bars represent monthly OPEC oil production in millions of barrels per day as shown on the left scale, while the purple graph represents global oil production in millions of barrels per day, with the metrics for global output shown on the right scale….

Including the 6,300,000 barrel per day cut in OPEC’s production from what they produced a month earlier, OPEC’s preliminary estimate indicates that total global oil production decreased by a rounded 10.04 million barrels per day to average 89.89 million barrels per day in May, a reported decrease which apparently came after May ‘s total global output figure was revised lower by 470,000 barrels per day from the 99.46 million barrels per day of global oil output that was reported a month ago, as non-OPEC oil production fell by a rounded 3,740,000 barrels per day in May after that revision, with lower oil production from Russia, the US, Kazakhstan, Oman, Canada, Azerbaijan, Norway and Mexico the major reasons for the non-OPEC output decrease in May…with the big decrease in May’s global output, the 89.89 million barrels of oil per day produced globally in May were 8.2 million barrels per day, or 8.4% less than the revised 98.09 million barrels of oil per day that were being produced globally in May a year ago, the 5th month of OPECs first round of production cuts (see the June 2019 OPEC report (online pdf) for the originally reported May 2019 details)…with this month’s big drop in OPEC’s output, their May oil production of 24,195,000 barrels per day fell to 26.9% of what was produced globally during the month, down from the 30.5% share OPEC contributed in April, and the 28.7% global share they had in March…OPEC’s May 2019 production, which included 529,000 barrels per day from former member Ecuador, was reported at 29,876,000 barrels per day, which means that the 13 OPEC members who were part of OPEC last year produced 5,152,000, or 17.6% fewer barrels per day of oil in May than what they produced a year ago, when they accounted for 30.4% of global output…
Even with the big drop in OPEC’s and global oil output that we’ve seen in this report, there was still a big surplus in the amount of oil being produced globally during the month, as this next table from the OPEC report will show us…

The above table came from page 25 of the June OPEC Monthly Oil Market Report (pdf page 35), and it shows regional and total oil demand estimates in millions of barrels per day for 2019 in the first column, and OPEC’s estimate of oil demand by region and globally quarterly over 2020 over the rest of the table…on the “Total world” line in the third column, we’ve circled in blue the figure that’s relevant for May, which is their estimate of global oil demand during the second quarter of 2020…
OPEC is estimating that during the 2nd quarter of this year, all oil consuming regions of the globe will be using an average of 81.30 million barrels of oil per day, unrevised from their estimate for the 2nd quarter a month ago, largely reflecting coronavirus related demand destruction….meanwhile, as OPEC showed us in the oil supply section of this report and the summary supply graph above, OPEC and the rest of the world’s oil producers were still producing 89.89 million barrels per day during May, which would imply that there was a surplus of around 8,590,000 barrels per day in global oil production in May, still 10.6% greater than the demand estimated for the month…
In addition to noting the May surplus, the downward revision of 470,000 barrels per day to April’s global output that’s implied in this report, means that the record 18,160,000 barrels per day of global oil surplus we had previously figured for April would now be revised to a surplus of 17,690,000 barrels per day…since we had also figured a 18,068,000 barrels per day surplus in March, and since March supply & demand were unrevised in this report, that means the record oil surplus now occurred in March rather than in April…although OPEC reports that their demand figure for the first quarter is unchanged from the last report, we note that the table shows that it fell from 92.40 million barrels per day to 92.39 million barrels per day, which we’ve lightly circled in green…although that is essentially just a rounding error, the 92.40 million barrels per day figure is the number we used to figure January’s and February’s surplus…hence we should also revise our February surplus oil production estimate from 2,190,000 barrels per day to 2,180,000 barrels per day, and revise our January surplus oil production estimate from 1,220,000 barrels per day to 1,210,000 barrels per day…
This Week’s Rig Count
The US rig count fell for the 15th week in a row during the week ending June 19th, and is now down by 66.5% over that fifteen week period….Baker Hughes reported that the total count of rotary rigs running in the US decreased by 13 rigs to 266 rigs this past week, which was the fewest active rigs in Baker Hughes records going back to 1940 and 138 fewer rigs than the all time low prior to this year, and was also down by 701 rigs from the 967 rigs that were in use as of the June 21st report of 2019, and 1,663 fewer rigs than the shale era high of 1,929 drilling rigs that were deployed on November 21st of 2014, the week before OPEC began to flood the global oil market in their first attempt to put US shale out of business….
The number of rigs drilling for oil decreased by 10 rigs to 189 oil rigs this week, after falling by 7 oil rigs the prior week, leaving oil rig activity at its lowest since June 12, 2009, which was also 600 fewer oil rigs than were running a year ago, and less than an eighth of the recent high of 1609 rigs that were drilling for oil on October 10th, 2014….at the same time, the number of drilling rigs targeting natural gas bearing formations fell by 3 to 75 natural gas rigs, which was the least natural gas rigs running in at least 80 years, and down by 102 natural gas rigs from the 177 natural gas rigs that were drilling a year ago, and less than a twentieth of modern era high of 1,606 rigs targeting natural gas that were deployed on September 7th, 2008…in addition to those rigs drilling for oil & gas, two rigs classified as ‘miscellaneous’ continued to drill this week; one on the big island of Hawaii, and one in Lake County, California… a year ago, there was just one such “miscellaneous” rig deployed, drilling a test well in Sandusky county Ohio..
The Gulf of Mexico rig count was down by 2 to 11 rigs this week, with all of those rigs drilling for oil in Louisiana’s offshore waters…that was the fewest number of rigs working in the Gulf or offshore nationally in Baker Hughes offshore records dating back to 1968, and 13 fewer rigs than the 24 rigs drilling in the Gulf a year ago, when 22 rigs were drilling offshore from Louisiana and two rigs were operating in Texas waters…there are no rigs operating off other US shores at this time, nor were there a year ago, so the Gulf of Mexico rig count is equal to the national rig count, just as it has been since the onset of last winter…
The count of active horizontal drilling rigs decreased by 12 rigs to 234 horizontal rigs this week, which was the fewest horizontal rigs active since January 20th, 2006, and hence is a new 14 year low for horizontal drilling…it was also 612 fewer horizontal rigs than the 846 horizontal rigs that were in use in the US on June 21st of last year, and less than a fifth of the record of 1372 horizontal rigs that were deployed on November 21st of 2014…at the same time, the directional rig count decreased by 4 to 18 directional rigs this week, and those were also down by 50 from the 68 directional rigs that were operating during the same week of last year…on the other hand, the vertical rig count rose by 3 rigs to 14 vertical rigs this week, but those were still down by 39 from the 53 vertical rigs that were in use on June 21st of 2019….
The details on this week’s changes in drilling activity by state and by major shale basin are shown in our screenshot below of that part of the rig count summary pdf from Baker Hughes that gives us those changes…the first table below shows weekly and year over year rig count changes for the major oil & gas producing states, and the table below that shows the weekly and year over year rig count changes for the major US geological oil and gas basins…in both tables, the first column shows the active rig count as of June 19th, the second column shows the change in the number of working rigs between last week’s count (June 12th) and this week’s (June 19th) count, the third column shows last week’s June 12th active rig count, the 4th column shows the change between the number of rigs running on Friday and the number running before the same weekend of a year ago, and the 5th column shows the number of rigs that were drilling at the end of that reporting week a year ago, which in this week’s case was the 21st of June, 2019…

The net of the basin totals shown above is a decrease of 11 rigs, and since we had 12 horizontal rigs removed nationally this week, an additional horizontal rig would have had to have been shut down in another basin not tracked separately by Baker Hughes and hence not shown above….checking the rig counts in the Texas part of Permian basin, we find that 3 rigs were pulled out of Texas Oil District 8, or the core Permian Delaware, while two rigs were added in Texas Oil District 7C, or the southern Permian Midland, and one rig was added in Texas Oil District 8A, or the northern Permian Midland at the same time…with the total rig count in the Texas Permian thus unchanged, that means that all five rigs that were shut down in New Mexico would have been drilling in the western Permian Delaware to account for the 5 rig decrease in the Permain basin rig count nationally…elsewhere in Texas, rigs were pulled out of Texas Oil District 2 and Texas Oil District 4, which would account for the 2 rigs removed from the Eagle Ford shale, which stretches in a relatively narrow band through the southeastern part of the state and touches on both of those Oil Districts…in addition, a rig was also removed from Texas Oil District 6, which accounts for the rig pulled from the Haynesville shale, since the Haynesville rig count in northern Louisiana remained unchanged at 21…meanwhile, Louisiana’s count was down by 2 because of the removal of the two rigs that had been drilling in the state’s offshore waters….elsewhere, the rig pulled out of North Dakota was the Williston basin rig, and the rig pulled out of Oklahoma was the last Arkoma Woodford natural gas rig….that Arkoma Woodford rig, the rig pulled out of the Texas Haynesville, and the removal of a natural gas rig from West Virginia’s Marcellus account for the decrease of three natural gas rigs this week, and that leaves nothing else on the board unexplained…
DUC well report for May
Monday of this past week saw the release of the EIA’s Drilling Productivity Report for June, which includes the EIA’s May data for drilled but uncompleted oil and gas wells in the 7 most productive shale regions….for the fourteenth time in fifteen months, this report showed a decrease in uncompleted wells nationally in May, as both the drilling of new wells and completions of drilled wells decreased, but drilling decreased by more…..for the 7 sedimentary regions covered by this report, the total count of DUC wells decreased by 33 wells, falling from a revised 7,624 DUC wells in April to 7,591 DUC wells in May, which was also 12.6% fewer DUCs than the 8,681 wells that had been drilled but remained uncompleted as of the end of May of a year ago…this month’s DUC decrease occurred as 428 wells were drilled in the 7 regions that this report covers (representing 87% of all U.S. onshore drilling operations) during May, down by 287 from the 715 wells that were drilled in April and the lowest number of wells drilled in the history of this report, while 461 wells were completed and brought into production by fracking, a decrease of 262 well completions from the 723 completions seen in April, and down by 65% from the 1,317 completions seen in May of last year, and also the lowest number of completions in one month since completions have been reported by the EIA….at the May completion rate, the 7,591 drilled but uncompleted wells left at the end of the month represents a 16.5 month backlog of wells that have been drilled but are not yet fracked, up from the 10.8 month DUC well backlog of a month ago, with a recognition that this normally indicative backlog figure is being skewed by record low completions…
Both oil producing regions and natural gas producing regions saw a net DUC well decreases in May, even as some basins still showed small increases…the number of uncompleted wells remaining in Oklahoma’s Anadarko basin decreased by 15 in May, falling from 677 at the end of April to 662 DUC wells at the end of May, as 14 wells were drilled into the Anadarko basin during May while 29 Anadarko wells were being fracked….there was also a decrease of 13 DUC wells in the Eagle Ford of south Texas, from 1,362 DUC wells at the end of April to 1,349 DUCs at the end of May, as 55 wells were drilled in the Eagle Ford during May, while 68 already drilled Eagle Ford wells were completed…in addition, the drilled but uncompleted well count in the Niobrara chalk of the Rockies’ front range decreased by 5 to 478, as 35 Niobrara wells were drilled in May while 40 Niobrara wells were completed…on the other hand, DUCs in the Permian basin of west Texas and New Mexico increased by 6, from 3,462 DUC wells at the end of April to 3,468 DUCs at the end of May, as 201 new wells were drilled into the Permian, while 195 wells in the region were being fracked….at the same time, DUC wells in the Bakken of North Dakota increased by 3, from 861 DUC wells at the end of April to 864 DUCs at the end of May, as 33 wells were drilled into the Bakken in May, while 30 of the drilled wells in that basin were being fracked…
Among the natural gas producing regions, the drilled but uncompleted well count in the Appalachian region, which includes the Utica shale, fell by 10 wells, from 532 DUCs at the end of April to 513 DUCs at the end of May, as 61 wells were drilled into the Marcellus and Utica shales during the month, while 71 of the already drilled wells in the region were fracked….on the other hand, the natural gas producing Haynesville shale of the northern Louisiana-Texas border region saw their uncompleted well inventory increase by 1 to 257, as 29 wells were drilled into the Haynesville during May, while 28 of the already drilled Haynesville wells were fracked during the same period….thus, for the month of May, DUCs in the five major oil-producing basins tracked by in this report (ie., the Anadarko, Bakken, Niobrara, Permian, and Eagle Ford) decreased by a net of 24 wells to 6,821 wells, while the uncompleted well count in the natural gas basins (the Marcellus, Utica, and the Haynesville) decreased by 9 wells to 770 wells, although as this report notes, once into production, more than half the wells drilled nationally will produce both oil and gas…
Chemical buildout won’t lead to ‘jobs boom,’ governors told –– The prospect of a petrochemical buildout in the Ohio River Valley was already a divisive issue. It was ballyhooed by some as an economic generator and decried by others for greenhouse gas emissions. That scenario became a bit more polarizing Monday when it got a resounding thumb’s down on economics. Lacking a formal name but not a purpose, a group of economists and engineers sent letters to the governors of Pennsylvania (Tom Wolf), West Virginia (Jim Justice) and Ohio (Mike DeWine). Organizers, according to an emailed news release, said Monday the tri-state region is “not likely” to experience a major buildout or “the kind of job creation that some predict.” The letter was cobbled together by eight college-affiliated economists and engineers and John Hanger, former head of the state Department of Environmental Protection. The missive also was distributed to the media, and it begins: “In Ohio, Pennsylvania and West Virginia, our goals for economic growth and job creation are being undermined by the mistaken belief that the region’s petrochemical and plastics manufacturing industries are poised to greatly expand and, in the process, generate large numbers of new jobs. “In fact, no such expansion and jobs boom is likely. And, unless we adopt new and better development strategies, we risk squandering hundreds of millions of dollars in public funds in pursuit of a vision that will not materialize.” Construction of an ethane cracker plant is well underway in Potter Township, Beaver County, Pa., a facility Shell Chemical Appalachia is erecting along the Ohio River. Two other petrochemical complexes had been discussed for the valley, until the ASCENT project in Wood County, W.Va., was canceled last summer. PTT-DLM still plans to build a cracker in Dilles Bottom, Ohio, but that endeavor is on hold after the company postponed a final investment decision.
Shell’s Falcon Pipeline Dogged by Issues with Drilling and Permit Uncertainty During Pandemic – Over the past few months, amid the COVID-19 pandemic and stay-at-home orders, Shell Pipeline Company has pressed onward with the construction of a 97-mile pipeline running through Ohio and western Pennsylvania. Shell plans to use the Falcon pipeline to supply its $6 billion plastics plant currently being built in Beaver County, Pennsylvania, with ethane, a raw material pulled from shale wells in the state and from neighboring Ohio.A DeSmog investigation found that Falcon’s construction has struggled with drilling problems and has continued even while one key water-crossing for the pipeline lacked state or federal permits. During that same time, vast numbers of other businesses in both states – including the Shell plastics plant itself – were forced to slow or stop activities in efforts to combat the spread of the deadly coronavirus. Throughout March and into April, Falcon was missing permits from state or federal regulators. Problems during a process known as horizontal directional drilling (HDD), which Shell attempted to use to install the Falcon pipeline under an Ohio creek called Wolf Run, forced the company to change its construction plans, and those permits had not yet been approved when the pandemic hit the region. Then, on April 15, just nine days after Falcon secured its final missing state permit, the legal status of its construction was again thrown into question, this time by events halfway across the country. A federal court hearing a challenge to the Keystone XL pipeline in Montana tossed out a nationwide permit issued for Falcon and many other oil and gas pipelines, finding that this particular permitting program failed to meet the standards of the nation’s cornerstone environmental laws. While appeals in that case remain pending, the U.S. Army Corps of Engineers was ordered to stop authorizing activities for new oil and gas pipeline construction under those permits until those legal questions were resolved. On Thursday, May 28, the Ninth Circuit rejected a request to put that order on hold until it issues its decision in that case. The Army Corps and Keystone XL’s backers “have not demonstrated a sufficient likelihood of success on the merits and probability of irreparable harm to warrant a stay pending appeal,” the court wrote.
Pa. attorney general charges Cabot Oil and Gas with environmental crimes – More than a decade after a water well exploded in the rural Northeast Pennsylvania town of Dimock, setting off a series of events that would plunge the town into the international spotlight, Pennsylvania has filed criminal charges against the company they say caused that explosion.Attorney General Josh Shapiro announced 15 criminal counts against the Houston-based Cabot Oil and Gas, including nine felonies, after recommendations from a grand jury. The charges stem from violations of the state’s Clean Streams law, as well as illegal industrial discharges. The grand jury report says the company’s “long-term indifference” to the damage it caused warrants penalties that rise beyond technical violations. Read the charging document here.”We find that, over a period of many years, and despite mounting evidence, Cabot Oil Gas failed to acknowledge and correct conduct that polluted Pennsylvania water through stray gas migration,” reads the grand jury presentment. “Indeed, some of these gas wells have been in place for more than a decade, yet Cabot has only recently taken steps to remediate them.”In announcing the charges, Shapiro cited Pennsylvania’s Environmental Rights Amendment, which guarantees clean air and water to all residents.”Frackers come from all over the nation,” Shapiro said, “walk into our communities and sometimes without care or consequence, strip us of those basic rights.”Shapiro said a decade later, the company has not fixed the problem.Methane is colorless and odorless and, in the right concentration, can lead to explosions.Although issues with gas drilling and water contamination began surfacing soon after drilling began in 2008 in Dimock, it wasn’t until the release of the 2010 HBO documentary Gasland that the town was thrust into the spotlight.Levels of methane were so high in some instances that residents could light their tap water on fire. They complained of headaches and rashes after they showered. They described their water looking like Alka Seltzer, or muddy.
Pennsylvania’s impact fee collection down 20% – Pittsburgh Business Times – Pennsylvania’s impact fee on natural gas production brought in $200 million in 2019, a decline of about $50 million that matches the tougher times in the industry. Washington County once again received the most impact fees of any county in Pennsylvania, although it was down more than $2 million from a year ago.The Pennsylvania Public Utility Commission, which collects the funding every year, said $42 million of the drop was due to the average price of natural gas being $2.63 per million British thermal units in 2019 compared to $3.09 per million BTUs in 2018. Last year’s collection also included a nearly $9 million adjustment for previous well production.The 2018 total was a record since the impact fee took effect in 2012. About $109 million of the impact fee collections will go to local communities and counties who are directly impacted by shale drilling, while $72.2 million will go to the Marcellus Legacy Fund and $18.4 million is reserved for state agencies who receive money from the impact fee Washington remained on top in terms of the county receiving the most from the impact fees, with $6.6 million. But that was down from the $8.4 million it received in 2018. The next-biggest county, Susquehanna, will receive $5.7 million down from the $7.18 million it received in 2018. Of the top counties receiving money from 2019’s impact fee, Greene will receive $4.7 million and Butler County will get $2.1 million.
Former Pa. House Speaker Mike Turzai takes job as general counsel for Peoples Natural Gas -One day after resigning as speaker of the Pennsylvania House of Representatives, Mike Turzai has been hired as general counsel for Peoples Natural Gas.The North Shore-based utility, which was acquired by Bryn Mawr-based Essential Utilities Inc. (formerly known as Aqua America), announced the long-rumored appointment on Tuesday. Mr. Turzai announced his resignation from the House on Wednesday.Mr. Turzai, a Republican who lives in Marshall with his wife and three sons, represented the state’s 28th Legislative district, which encompasses the suburbs in northern Allegheny County, for nearly two decades. He was elected speaker of the house in 2015.When he announced in January that he wouldn’t seek re-election, Mr. Turzai said he received a lot of interest from private companies. It was a pitch from his longtime friend Chris Franklin, CEO of Essential, that prompted Mr. Turzai to leave before his term expired.
State Supreme Court denies Sunoco’s appeal over permits for Mariner East 1 buildings in Lebanon County – Energy Transfer declined to say what it will do after the Pennsylvania Supreme Court ruled that buildings housing part of Sunoco’s Mariner East 1 pipeline were built without required permits.In a June 1 decision, the Supreme Court upheld an earlier ruling that the buildings in West Cornwall Township should not be assumed to be exempt from typical construction permitting. “The [Supreme Court’s] decision does not impact our operation of the pumps or the pipeline,” said Lisa Coleman, a representative for Energy Transfer, which owns Sunoco. She did not respond directly to a question about Sunoco’s next steps. The plaintiffs are part of an advocacy group called Concerned Citizens of Lebanon County. One of them, Pam Bishop, said that to get the correct permit, Sunoco will “have to go through the process that they should have gone through five years ago.”Sunoco had appealed a decision by the Commonwealth Court last October. Concerned Citizens of Lebanon County had sued West Cornwall Township’s zoning board and Sunoco, claiming the building permit didn’t take safety risks into account. One of the two garage-sized buildings without a proper permit houses a pump station, which moves natural gas liquids along the Mariner East 1 pipeline. Natural gas liquids include propane, ethane, and butane. If natural gas liquids leak out of pipelines, they can form a combustible cloud of gas at ground level. Some residents of West Cornwall Township believe the buildings pose a safety risk. In court documents, plaintiffs say they worried about the potential for leaking natural gas liquids to pool in the building. Environmental attorney Rich Raiders testified that, in the event of an explosion, parts of the building could fall into neighboring properties. In October, a three-judge Commonwealth Court panel revoked the building permit because it was issued to Sunoco under an implied exemption for public utilities in the township zoning code. Judge P. Kevin Brobson wrote, “We reject the notion that an exemption from local zoning can be implied to exist.” The court did not rule on Mariner East 1’s status as a public utility, nor on the township’s right to place restrictions on public utilities.
Work begins on Southern Reliability Link pipeline through Burlington County – Major work on the Burlington County phase of New Jersey Natural Gas’ Southern Reliability Link kicked off Monday morning and is expected to continue through the next 18 months, according to utility officials. After numerous delays work has finally started on the Burlington County section of a controversial pipeline intended to transport natural gas to neighboring Ocean and Monmouth counties. Major work on the Burlington County phase of New Jersey Natural Gas’ Southern Reliability Link kicked off Monday morning and is expected to continue through the next 18 months, according to utility officials. The 30-mile, high-pressure line is planned to run through Ocean, Monmouth and Burlington counties, where it will connect with a new compressor station in Chesterfield. Work has already been completed in Ocean and Monmouth counties, leaving the Burlington County section as the final work left to complete before the company can put the controversial project into service after years of delays due to regulatory and permitting issues, as well as a still ongoing court fight with environmental groups. New Jersey Natural Gas officials have said the pipeline will enhance the reliability of its gas delivery to its more than 500,000 customers, mostly in Ocean and Monmouth counties, but also on the Lakehurst side of Joint Base McGuire-Dix-Lakehurst. The base is a critical mobility, training and engineering site and New Jersey’s second-largest employer. Opponents have argued the planned route for the line is too close to homes and businesses and will pose a significant safety and pollution risk. They also contend the base will receive no direct benefit.
FERC Approves MVP River Drilling Permit – After receiving federal approve for drilling under the Roanoke River, the Mountain Valley Pipeline LLC (MVP) aims for a full in-service date in early 2021. On June 11, Mountain Valley provided a schedule and timing update in preparation for completion of its 303-mile natural gas transmission line. Total project work is approximately 92 percent complete.Mountain Valley Pipeline received approval from the Federal Energy Regulatory Commission (FERC) to drill under the Roanoke River in southwest Virginia. Construction of the Mountain Valley pipeline has been stalled because of federal permits and legal challenges. The pipeline company hopes to have all the needed permits in place for the project by the end of 2020. The $5.5 billion project is owned by joint-venture partners EQM Midstream Partners, NextEra US Gas Assets, Con Edison Transmission, WGL Midstream and RGC Midstream. The 42-in. natural gas pipeline will run from northwestern West Virginia to southern Virginia, with a capacity of approximately 2 billion cubic feet per day (Bcf/d) from the Marcellus and Utica shale region. For the last several months, Mountain Valley’s primary focus has been continued environmental stabilization and restoration work, and maintenance of existing erosion and sediment controls along the right-of-way. Forward construction is anticipated to resume when MVP receives its Biological Opinion and the Federal Energy Regulatory Commission lifts the project’s Stop Work Order.MVP’s 2021 in-service date reflects changes to the previously planned construction schedule, which includes the continued timing uncertainty of permits for crossing the Jefferson National Forest and Appalachian Trail, roughly 3.7 miles; and waterbodies, which total approximately 10 miles of pipe. In connection with the adjusted in-service date, total project costs for MVP may potentially increase roughly 5% above the project’s $5.4 billion estimate, primarily due to the need to adapt to complex judicial decisions and regulatory changes – creating carrying costs and requiring supplemental crews to safely maintain the entire 303-mile route during the halt of construction and through the upcoming winter months.
Supreme Court Removes Hurdle for $8 Billion Atlantic Coast Pipeline – The Supreme Court removed a legal barrier to the construction of an $8 billion pipeline that would deliver natural gas from West Virginia, ruling the project could run under a major East Coast hiking trail. The court, in a 7-2 opinion by Justice Clarence Thomas on Monday, overturned a lower-court ruling that found the U.S. Forest Service didn’t have the authority to grant a special-use permit that allowed developers of the Atlantic Coast Pipeline to construct an underground segment beneath a section of the Appalachian National Scenic Trail in Virginia. The Atlantic Coast Pipeline is a partnership in which Dominion Energy Inc. and Duke Energy Corp. are major investors. It would transport natural gas from West Virginia across 600 miles to sites in Virginia and North Carolina. The companies say the project is needed to help meet East Coast demand for cleaner-burning fuel. The pipeline was announced in 2014 but has faced delays, with the current price tag totaling about $8 billion. Environmentalists argued the pipeline’s path could harm ecologically important national forests, with threats of soil erosion and damage to wildlife habitat. They said the project would harm an especially picturesque section of the Appalachian Trail in Virginia located near Reed’s Gap and the Wintergreen Resort. The trail runs more than 2,000 miles from Maine to Georgia.
Supreme Court clears way for Atlantic Coast Pipeline to cross Appalachian Trail – The Atlantic Coast Pipeline can cross under the Appalachian Trail, the United States Supreme Court ruled on Monday. By a 7 to 2 margin, the court reversed a lower court’s decision and upheld a permit granted by the U.S. Forest Service that the project’s developers could tunnel under a section of the iconic wilderness in Virginia.The court took the case after Dominion Energy, one of the largest utilities in the South, appealed a Fourth Circuit Court of Appeals ruling last year that said the U.S. Forest Service violated federal law when it approved the pipeline to cross the Appalachian Trail. The issue, the lower court ruled: It was the National Park Service’s call to approve that request. (Dominion, based in Richmond, Virginia, is the lead developer on the Atlantic Coast Pipeline, or ACP, project; North Carolina utility Duke Energy, as well as Southern Company, also own shares.)The case looked at whether the Forest Service had authority under the Mineral Leasing Act to grant rights-of-way within national forest lands traversed by the Appalachian Trail. “A right-of-way between two agencies grants only an easement across the land, not jurisdiction over the land itself,” Chief Justice John Roberts wrote for the court’s opinion. So the Forest Service had enough authority over the land to grant the permit. The dissent, by Justices Sonia Sotomayor and Elena Kagan, argued that the “outcome is inconsistent with the language of three statutes, longstanding agency practice, and common sense.” According to The Washington Post, the plaintiffs in this case, both Dominion and the Forest Service, had argued that other pipelines cross the Appalachian Trail a total of 34 times. “The Atlantic Coast Pipeline will be no different,” Dominion said in a statement after the decision. “To avoid impacts to the Trail, the pipeline will be installed hundreds of feet below the surface and emerge more than a half-mile from each side of the Trail.” The decision could set an important precedent for public lands, said Greg Buppert, senior attorney for the Southern Environmental Law Center, or SELC, which is involved in multiple lawsuits against the pipeline. This particular Appalachian Trail section on federal land, which is remote, rugged, and wild, “deserves the highest protection the law provides,” according to Buppert. But this ruling likely signals to developers of the 300-mile Mountain Valley Pipeline that they could have an easier time crossing under the trail at a separate location in Virginia; attorneys for the nearly-complete project called it a “key missing link,” the Roanoke Times reported.
Supreme Court Rules Atlantic Coast Pipeline Can Cross Appalachian Trail, but the Battle Might Not Be Over – The Supreme Court ruled 7 to 2 Monday that the controversial Atlantic Coast Pipeline (ACP) can pass underneath the Appalachian Trail.The ruling removes one barrier to the pipeline, which has been delayed six years, but it still requires eight other permits, and environmental groups vowed to keep fighting.”With the ACP still lacking 8 permits, this decision is just plugging just one hole on a sinking ship,” director of the Sierra Club’s Beyond Dirty Fuels Campaign Kelly Martin said in a statement. “Nothing in today’s ruling changes the fact that the fracked gas Atlantic Coast Pipeline is a dirty, dangerous threat to our health, climate and communities, and nothing about the ruling changes our intention to fight it.”The pipeline, a joint project of Duke Energy and Dominion Energy, would carry fracked natural gas 600 miles from West Virginia to Virginia and North Carolina, as NPR reported.At stake in Monday’s decision is the part of its route that would cross the Appalachian Trail in Central Virginia where the trail overlaps with the George Washington National Forest.The Forest Service granted the pipeline a permit for the crossing in 2018, but a coalition of environmental groups led by the Southern Environmental Law Center (SELC) sued, arguing that the trail crossing was under the jurisdiction of the National Park Service. The Fourth Circuit Court of Appeals agreed and tossed the Forest Service permit in December of that year.But the companies appealed and the Supreme Court ruled in their favor Monday, arguing that the Forest Service controlled the land and had just granted the National Park Service a right of way to maintain the trail. “If a rancher granted a neighbor an easement across his land for a horse trail, no one would think that the rancher had conveyed ownership over that land,” Justice Clarence Thomas wrote for the majority, NPR reported. Only Justices Sonia Sotomayor and Elena Kagan disagreed. “In her noteworthy dissent, Justice Sotomayor clearly gets what should be obvious: that the Appalachian Trail is land in the National Park system,” Natural Resources Defense Council Climate & Clean Energy Program attorney Gillian Gianettti said in a statement. “And under federal law, a pipeline plainly cannot cross land in the National Park system.” However, SELC said the remaining permits could be a major hurdle to the project. The Fourth Circuit Court of Appeals vacated the Forest Service permit on three other grounds not covered by the Supreme Court decision, NPR reported. The project also lacks permits relating to its impacts on endangered species, air and water, SELC pointed out.The organization also pointed out that the decision comes as both Virginia and North Carolina are moving away from fossil fuels and towards renewable energy. Virginia passed the Virginia Clean Economy Act in April, which requires utilities to shut down all gas plants by 2045. And North Carolina’s Clean Energy Plan requires the state to reduce emissions to 70 percent of 2005 levels by 2030 and achieve carbon neutrality by 2050. A pending case before the D.C. Circuit Court of Appeals will determine if the Federal Energy Regulatory Commission was correct in determining the ACP necessary when it granted it a permit in 2017.
Dominion seeks more time to complete U.S. Atlantic Coast natgas pipe – (Reuters) – Dominion Energy Inc asked U.S. energy regulators for two more years to complete the long-delayed $8 billion Atlantic Coast natural gas pipeline from West Virginia to North Carolina, which the company now expects to enter service in early 2022. “Due to unforeseen delays in permitting, additional time is required in order to complete the construction,” Dominion said in a filing late on Tuesday. The U.S. Federal Energy Regulatory Commission (FERC) approved Dominion’s request to build Atlantic Coast in October 2017, authorizing the company to complete the project by October 2020. Atlantic Coast, the nation’s most expensive gas pipe, is one of several projects delayed in recent years by state opposition and local and environmental legal and regulatory battles. The company still needs to renew permits from the U.S. Forest Service and U.S. Fish and Wildlife Service (FWS) that were knocked out by decisions in the U.S. Court of Appeals for the Fourth Circuit, and a state air permit for a compressor in Virginia. Dominion said it expects to receive the necessary approvals by the end of the year. The company already received one ruling in its favor this week when the U.S. Supreme Court reversed a Fourth Circuit decision and ruled that the Forest Service has legal authority to permit the pipe to cross under the Appalachian Trail. Dominion suspended construction of the 600-mile (966-km) project in December 2018 after the Fourth Circuit stayed a biological opinion from the FWS that allowed construction in areas inhabited by endangered species. Atlantic Coast is owned by units of Dominion and Duke Energy Corp. When Dominion started work on the 1.5 billion cubic feet per day pipe in the spring of 2018, the company estimated it would cost $6.0-$6.5 billion and be completed in late 2019.
U.S. natural gas production efficiency continued to improve in 2019 – The U.S. Energy Information Administration’s (EIA) latest Drilling Productivity Report (DPR) was updated on Monday, June 15. Analysis of underlying data on natural gas well efficiency shows how U.S. natural gas production increased in 2019 because, in part, of greater productivity of new wells drilled in shale and tight formations. Initial production rates for natural gas production from new wells in the DPR’s seven regions have generally increased since at least 2007.The average new well in the Haynesville, Permian, Eagle Ford, Niobrara, and Bakken regions in 2019 produced more natural gas than wells drilled in previous years in those same regions. This trend has persisted for 13 consecutive years in all DPR regions except the Haynesville region, which had a brief productivity decline between 2013 and 2015. More effective drilling techniques, including the increasing prevalence of hydraulic fracturing and horizontal drilling, have increased initial production rates. In particular, the injection of more proppant – sand or similar particulate material suspended in water or other fluid – during the hydraulic fracturing process and the ability to drill longer horizontal well components (also known as laterals) have improved well productivity. Since 2007, gross natural gas production from the Appalachia and Haynesville DPR natural gas regions has grown at an average annual rate of 20%. In addition to rapid growth of natural gas production from these natural gas regions, production of associated natural gas in the Permian, Eagle Ford, Bakken, Niobrara, and Anadarko oil regions remains significant, accounting for 46% of the natural gas production from all DPR regions. Overall,associated gas production accounted for 37% of U.S. natural gas gross withdrawals in 2018.
U.S. natgas futures fall to one-month low on weaker demand – (Reuters) – U.S. natural gas futures fell to a one-month low on Monday on forecasts for lower demand over the next two weeks than previously expected despite slowing production. Front-month gas futures fell 6.2 cents, or 3.6%, to settle at $1.669 per million British thermal units, their lowest since May 15. Refinitiv said production in the Lower 48 U.S. states fell to an average of 87.5 billion cubic feet per day in June from a 16-month low of 88.2 bcfd in May and an all-time monthly high of 95.4 bcfd in November. With warmer weather coming, Refinitiv forecast U.S. demand, including exports, would rise from 77.8 bcfd this week to 84.9 bcfd next week. That, however, was lower than Refinitiv’s forecasts on Friday of 79.1 bcfd this week and 85.4 bcfd next week. The amount of pipeline gas flowing to U.S. LNG export plants fell to an average of 4.1 bcfd (42% utilization) in June, down from an eight-month low of 6.4 bcfd in May and a monthly record high of 8.7 bcfd in February. Utilization was about 90% in 2019. U.S. liquefied natural gas exports dropped in recent months as buyers canceled dozens of cargoes for the summer with U.S. gas prices trading mostly higher than in Europe since late April due to demand destruction from the coronavirus and record-high European stockpiles, among other things. U.S. pipeline exports, meanwhile, are rising as North American consumers crank up their air conditioners. Refinitiv said pipeline exports to Canada averaged 2.3 bcfd in June, up from a seven-month low of 2.2 bcfd in May but still well below the all-time monthly high of 3.5 bcfd in December. Pipeline exports to Mexico averaged 5.3 bcfd this month, up from 4.8 bcfd in May but shy of the record 5.6 bcfd in March.
U.S. natgas fall to 2-mth low on rising output, low LNG exports – (Reuters) – U.S. natural gas futures fell over 3% to a two-month low on Tuesday as output slowly edges higher while liquefied natural gas exports remain low. Front-month gas futures fell 5.5 cents, or 3.3%, to settle at $1.614 per million British thermal units, their lowest since April 15. Refinitiv said production in the Lower 48 U.S. states averages just 87.5 billion cubic feet per day in June, down from a 16-month low of 88.2 bcfd in May and an all-time monthly high of 95.4 bcfd in November. But on a daily basis, output rose to 88.3 bcfd on Monday from a 19-month low of 85.7 bcfd in late May. With warmer weather coming, Refinitiv forecast U.S. demand, including exports, would rise from 77.4 bcfd this week to 85.1 bcfd next week. That, however, is similar to Refinitiv’s outlook on Monday. The amount of pipeline gas flowing to U.S. LNG export plants averaged just 4.1 bcfd (42% utilization) in June, down from an eight-month low of 6.4 bcfd in May and a record high of 8.7 bcfd in February. Utilization was about 90% in 2019. U.S. liquefied natural gas exports dropped in recent months after buyers canceled dozens of cargoes for the summer in April and May when gas was more expensive in the United States than in Europe due to global coronavirus demand destruction and record-high European stockpiles. U.S. pipeline exports, meanwhile, are rising as North American consumers crank up their air conditioners. Refinitiv said pipeline exports to Canada averaged 2.3 bcfd in June, up from a seven-month low of 2.2 bcfd in May but still well below the all-time monthly high of 3.5 bcfd in December. Pipeline exports to Mexico averaged 5.2 bcfd this month, up from 4.8 bcfd in May but shy of a record 5.6 bcfd in March.
U.S. natgas futures edge up on forecasts for higher demand next week – (Reuters) – U.S. natural gas futures edged up on Wednesday on a confirmation of forecasts for higher demand next week after falling to a two-month low in the prior session. That price gain came despite a slow recovery in output and continued low liquefied natural gas (LNG) exports. Front-month gas futures rose 2.4 cents to settle at $1.638 per million British thermal units (mmBtu). On Tuesday, the contract settled at its lowest since April 15. Refinitiv said production in the Lower 48 U.S. states averaged just 87.6 billion cubic feet per day (bcfd) in June, down from a 16-month low of 88.2 bcfd in May and an all-time monthly high of 95.4 bcfd in November. On a daily basis, however, output was up to one-month high of 88.3 bcfd this week from a 19-month low of 85.7 bcfd in late May. With warmer weather coming, Refinitiv forecast U.S. demand, including exports, would rise from 77.9 bcfd this week to 85.1 bcfd next week. That was similar to Refinitiv’s outlooks on Monday and Tuesday. The amount of pipeline gas flowing to U.S. LNG export plants averaged just 4.0 bcfd (41% utilization) in June, down from an eight-month low of 6.4 bcfd in May and a record high of 8.7 bcfd in February. Utilization was about 90% in calendar 2019. U.S. liquefied natural gas exports dropped in recent months after buyers canceled dozens of cargoes for the summer in April and May when gas was more expensive in the United States than in Europe due to global coronavirus demand destruction and record-high European stockpiles. That drop in LNG exports helped cut next-day gas at the Henry Hub benchmark in Louisiana NG-W-HH-SNL to $1.43 per mmBtu for Wednesday, its lowest since hitting a record low of $1.03 in December 1998.
US working natural gas in storage rises by 85 Bcf, smallest build in four weeks: EIA –US natural gas storage inventories rose 85 Bcf in the week ended June 12, the US Energy Information Administration reported June 18, as gas demand from power generators continued to increase amid an extended spell of summer-like weather across the Lower-48 states. The injection was 6 Bcf above an S&P Global Platts’ survey of analysts calling for a 79 Bcf addition to stocks. Responses to the survey ranged from injections of 70 Bcf to 86 Bcf. The weekly build was just 2 Bcf/d below the five-year average injection of 87 Bcf, according to EIA data. US inventories climbed to 2.892 Tcf as a result, equivalent to a 722 Bcf, or 33%, surplus to the year-ago level of 2.170 Tcf. The surplus to the five-year average barely narrowed during the week, falling to 419 Bcf, or about 17%, above its average level for mid-June. The weekly injection was the smallest volume of gas added to inventories in four weeks, propelled by a modest tightening in the US supply-demand balance. Total supply during the week was down about 900 MMcf/d to an average 90 Bcf/d, propelled by a drop in offshore production from Tropical Storm Cristobal and a 600 MMcf/d drop in net pipeline imports from Canada, S&P Global Platts Analytics data showed. Total US gas demand during the week was buoyed by a surge in exports to Mexico, which climbed to a single-day record of 5.8 Bcf/d, adding about 400 MMcf/d in additional demand on the week. In the US domestic market, warmer weather drove gas-fired power burn demand higher by 2.3 Bcf/d. A continued decline in US feedgas demand, which was down another 1.2 Bcf/d on the week, weighed on the balances, adding to the market’s increasingly bearish sentiment. The NYMEX July gas futures contract traded in a narrow range June 18, hovering near its prior-day close at $1.64/MMBtu. After plummeting to a fresh 20-year low at just $1.38/MMBtu June 16, the Henry Hub cash market has weighed on prompt futures, which are down 17 cents, or about 9% in the past week. Similar bearishness has extended into summer forwards markets too, with the balance June, July, and August contracts settling at an average price of just $1.63/MMBtu June 17. Weakness in the cash, futures, and forwards markets could linger in the weeks ahead as gas demand struggles to recover from the coronavirus pandemic and US gas production continues to rebound. Through mid-June, LNG feedgas demand has averaged just 4 Bcf/d this month, down from a prior-year average at more than 5.5 Bcf/d and a record high in March at over 9.6 Bcf/d. With additional cargo cancellations now expected in July and August, it’s likely that LNG feedgas demand will remain depressed through the summer months.
U.S. natgas futures rise on forecasts for warmer weather, higher demand – (Reuters) – U.S. natural gas futures climbed almost 2% on Friday on forecasts for warmer weather and higher air conditioning demand over the next two weeks. Front-month gas futures rose 3.1 cents, or 1.9%, to settle at $1.669 per million British thermal units. For the week, however, the front-month lost about 4% after output rebounded earlier this week, putting the contract down for a third week in a row for the first time since January. Refinitiv said production in the Lower 48 U.S. states averaged just 87.6 billion cubic feet per day (bcfd) in June, down from a 16-month low of 88.2 bcfd in May and an all-time monthly high of 95.4 bcfd in November. On a daily basis, however, output hit a one-month high of 88.3 bcfd this week, up from a 19-month low of 85.7 bcfd in late May. With warmer weather coming, Refinitiv forecast U.S. demand, including exports, would rise from 77.8 bcfd this week to 85.8 bcfd next week and 87.1 bcfd in two weeks. That is higher than Refinitiv’s outlooks from Monday-Thursday. The amount of pipeline gas flowing to U.S. LNG export plants averaged just 4.0 bcfd (41% utilization) in June, down from an eight-month low of 6.4 bcfd in May and a record high of 8.7 bcfd in February. Utilization was about 90% in calendar 2019. U.S. pipeline exports, meanwhile, are rising as North American consumers crank up their air conditioners.
From Hurricane Maria to COVID, Gas Lobbyist-turned-Trump Energy Lawyer Uses Crises as ‘Opportunity’ – Steve Horn – Among a string of recent environmental rollbacks, President Donald Trump’s U.S.Department of Energy (DOE) aims to vastly narrow the scope of environmental reviews for those applying for liquefied natural gas (LNG) export permits. The proposal has been guided by Bill Cooper, a former oil and gas industry lobbyist who’s now a top lawyer for the DOE.On May 1, the DOE issued a proposal to limit environmental reviews for LNG export permit proposals so that the review applies to only the export process itself – literally “occurring at or after the point of export.” The rule would take off the table for consideration lifecycle greenhouse gas analyses, broader looks at both build-outs of pipelines and power plants attached to the export proposals, and other potential environmental impacts.It comes as many larger forces up the pressure on LNG projects: The oil and gas industry is facing financial crisis, exports of fracked gas to the global market are steeply waning, and the COVID-19 pandemic and accompanying economic nosedive are marching on in the United States. The DOE’s Bill Cooper, an oil and gas attorney by background with a long history of navigating the industry through crises both inside and outside of the federal government, signed off on the regulatory proposal. Now DOE General Counsel, Cooper has proven instrumental in creating today’s U.S. regulatory regime both for fracking for natural gas and exporting it. This attempted rule change is just the latest chapter in that story. For Cooper, crisis has consistently served as an opportunity to implement regulatory change to favor the oil and gas industry. As DeSmog has reported, Cooper played a critical role in getting regulatory exemption language now known as the “Halliburton Loophole” inserted into the 2005 energy bill. That loophole, in essence, ushered in the modern fracking boom by giving the industry exemptions from U.S. Environmental Protection Agency (EPA) enforcement of the Clean Water Act and Safe Drinking Water Act when companies use the horizontal drilling technique key to unlocking shale oil and gas. In 1999, the industry had openly admitted it could likely not perform the drilling technique without such regulatory relaxation. However, Cooper, working as legal counsel for the House Energy and Commerce Committee, came through with a legislative fix in the 2005 energy bill.
Mississippi Set To Become The 13th State To Criminalize Fossil Fuel Protests – Mississippi is on the verge of becoming the 13th state in the past three years to slap new penalties on protests against fossil fuel infrastructure. A bill that cleared the state Legislature earlier this week makes knowingly trespassing any property where oil, gas or petrochemical pipelines or tanks are located a misdemeanor punishable by up to six months in prison and a $1,000 fine. Individuals who cause damage or losses that total more than $1,000 ― for example, by halting production at a refinery or stopping the flow of fuel through a pipeline ― could face felony charges punishable by up to seven years in prison and fines of up to $10,000. The bill also threatens any “organization that aids, abets, solicits, compensates, hires, conspires with, commands or procures a person to commit the crime of impeding critical infrastructure” with fines of up to $100,000 and civil action from companies to recoup “damages for lost profits, whether or not any fine is imposed.” The legislation passed 67-to-47 in the Magnolia State’s House of Representatives in March, just before quarantine orders to prevent the spread of the coronavirus pandemic delayed the legislative session. The state Senate voted 43-to-9 on Monday to approve it. Gov. Tate Reeves (R) did not respond to a request for comment, but is expected to sign the legislation into law.
4 utility workers injured in blast, fire in Maumelle -A gas explosion and fire in Maumelle on Thursday afternoon injured four employees of utility company CenterPoint Energy after a reported rupture in an underground natural gas main. Three homes near the fire were evacuated, according to the Maumelle Fire Department. The gas ignited near the area of Edgewood Drive and Windwood Lane, not far from the Maumelle Community Center. The gas main was shut off at 2:25 p.m. and the fire extinguished, officials said. According to Division Chief Michael Cossey of the Fire Department, firefighters received a call about a gas-line rupture about 10:10 a.m. related to a contractor working in the area. Utility workers were investigating at the scene when the gas ignited and caused a fire, according to Ross Corson, a spokesman for CenterPoint Energy.
St. James residents seek permission to hold Juneteenth ceremony at possible slave cemetery – Attorneys for a group of St. James Parish residents are seeking a temporary restraining order that would grant them access to a historic cemetery on the parish’s west bank where Formosa Plastics is building a massive new facility. The request for a restraining order, filed Monday in the 23rd Judicial District Court, comes after talks between residents and the plastics company about visiting the gravesite on a large piece of property broke down. A temporary restraining order would prohibit Formosa from stopping residents from visiting the burial ground, where archaeological consultants have turned up evidence of what may have been a slave cemetery associated with the Buena Vista Plantation. Under Louisiana law, landowners cannot categorically and unreasonably deny descendants and others access to cemeteries on their property. But the origins of those buried at the site have not been verified. Meanwhile, residents who are seeking access to the site are also concerned about a pipeline that runs through the cemetery, which they believe puts them at risk of being arrested under a state law that prohibits trespassing on or near “critical” oil and gas infrastructure – including pipelines, chemical plants and ports. Those found guilty of violating the law can be sentenced to up to five years in prison.
Tellurian delays construction on $27B Louisiana energy project – Natural gas company Tellurian has pushed the start of construction on its $27 billion Driftwood LNG project near Lake Charles, Louisiana, to next year and is reconsidering the need to build the $4.2 billion Permian Global Access Pipeline to serve the Driftwood facility. Reduced demand, low natural gas prices and the COVID-19 pandemic have made it difficult for Tellurian to firm up deals with equity investment partners, according to comments made by CEO Meg Gentle that were first reported by S&P Global. She said the company expects to be able to have the necessary agreements in place in the first half of 2021 so that it can secure financing and start construction. When Tellurian awarded Bechtel $15.2 billion in contracts for construction of the project’s export facility in 2017, construction was expected to start in 2018, with the facility operational in 2022. Engineering for the project, according to a recent conference presentation, is 30% complete. Both the pipeline and export facility have secured all necessary permits. Bechtel’s contract for the Driftwood project consists of four fixed-price, lump-sum, turnkey agreements for engineering, procurement and construction services. The four, staggered phases of the project on the 1,000-acre site will include:
- 20 liquefaction units.
- Liquefaction technology.
- 20 GE refrigeration compressors.
- Three 235,000 cubic-meter, full-containment LNG storage tanks.
- Three marine loading berths.
Bechtel, which has also invested $50 million in Tellurian, is entrenched in the energy sector and has delivered approximately 30% of the world’s LNG capacity. The contractor is also heading up construction of the $6 billion Shell ethane cracker and chemicals plant in Beaver County, Pennsylvania, where workers have complained that they have not been provided with adequate protection against the novel coronavirus, according to KDKA CBS Pittsburgh. In March, Shell temporarily suspended construction at the site until it could install safeguards.
Energy company sues US over costs from continuing oil leak (AP) – A New Orleans company is challenging a U.S. Coast Guard claim that the company owes millions of dollars in costs and penalties related to a continuing oil leak in the Gulf of Mexico. Taylor Energy’s federal lawsuit, dated Monday, is the latest salvo in a legal battle over a spill that began when Hurricane Ivan toppled a platform in the Gulf in 2004. The company and the Coast Guard have been at odds over what should be done to halt the leak, how much oil has leaked, and whether oil collected from the scene by a contractor hired by the Coast Guard came from an active flow of oil from the Taylor well site. In a letter to Taylor officials on June 2, government lawyers say they will seek $43 million to cover costs of removing the oil, plus civil penalties related to the leak. No coastal environmental damage has been reported from the ongoing seepage. Two other federal lawsuits filed by Taylor Energy, dealing with orders to contain the spill and the selection by the Coast Guard of a contractor to collect leaking oil, are set for trial in December. In its latest filing, Taylor points to a study done by experts who have worked as consultants for the company, indicating that the oil collected at the scene came not from a flowing reservoir but from sediment where oil was trapped. Taylor Energy is named for its late founder, the oil man and philanthropist Patrick F. Taylor. The company says on its website that it sold all its oil and gas assets in 2008 and exists now only to respond to the toppled platform.
Florida lawmakers press Interior on offshore drilling — A bipartisan group of Florida lawmakers is questioning the Interior Department after it was reported last week that the agency could start pursuing oil and gas drilling off the coast of Florida following the election this November. Four sources told Politico about the plan, noting that the Trump administration is waiting because of how unpopular offshore drilling is in the state. An Interior Department spokesperson, in response, characterized the article as “#FakeNews based entirely on anonymous sources who don’t know what they’re talking about.” “Current offshore plans do not expire until 2022, and @Interior does not plan to issue a new report in November,” the spokesperson tweeted. In their Monday letter, the 18 Florida lawmakers asked the administration when it planned to release its next offshore drilling proposal and whether it would consider excluding lease sales from new areas in the eastern Gulf of Mexico and south Atlantic. “Florida relies on coastlines unencumbered by oil and gas drilling to sustain its economy, preserve its marine life and natural resources, and protect our national security,” said the letter, led by Rep. Darren Soto (D-Fla.). “This past April marked ten years since the Deepwater Horizon disaster, when we saw firsthand the destruction offshore drilling can have on our state,” the lawmakers added. “Our state and local economies cannot sustain another disaster like that.” In the crucial swing state, offshore drilling is widely disliked, especially given the impacts of the 2010 Deepwater Horizon spill on the state’s tourism industry. A 2018 state amendment to block offshore drilling was also approved by nearly 70 percent of Florida voters. Currently, a moratorium protects the Florida’s gulf waters from offshore drilling until mid-2022. The House delegation has tried to extend it, pushing through legislation that would permanently block drilling near the state, though it has yet to be considered by the Senate.
Offshore Drillers Scrap Assets to Fit Market Made Smaller by COVID-19 Downturn – Offshore drillers are scrapping premium equipment to right-size their fleets amid the downturn brought on by the COVID-19 pandemic, anticipating that addressing the market from the supply side will help improve their positions when the demand side returns. “The supply side is finally getting some much-needed self-help as we’re now seeing offshore drillers elect to scrap/retire a number of higher-quality 6th-gen assets (albeit largely of the cold-stacked variety),” analysts with Tudor Pickering Holt & Co. said June 3. Sixth-generation semisubmersible offshore drilling rigs, designed in response to increasing oil prices and dayrates in the late 2000s, are among the most advanced rigs in offshore drilling fleets. The rigs can drill in water depths of 10,000 feet or more and are designed for a wide range of operating environments. Stuart Robert Jackson, CFO of deepwater drilling contractor Seadrill Ltd., said the company would likely scrap some assets that are already cold-stacked, or shut down and stored with minimal staffing and maintenance, since low crude oil prices would limit the returns on the assets and the duration of cold-stacking would elevate reactivation costs. Up to 10 rigs may be scrapped over the coming months, he said. London-based Valaris plans to “preservation-stack” competitive rigs, including three drillships, a semisubmersible and five jackups, President and CEO Thomas Burke said during an April 30 earnings call. “By putting these rigs into a lower state of readiness, we expect to realize more than $50 million of annualized cost savings beginning in the latter half of this year,” Burke said. The company also will retire three sixth-generation modern drillships, four benign water semisubmersibles and four jackups. Scrapping these 11 rigs is expected to save the company more than $30 million in stacking costs annually once they are sold, the CEO said. In the Gulf of Mexico alone, roughly $4 billion in investment has been cut from the offshore market in 2020, a 22% reduction from 2019, Wood Mackenzie analysts said June 4. The analysts expect $7.4 billion in spending in the Gulf of Mexico, 35% below pre-COVID-19 projections.
Exclusive: Chesapeake Energy to file for bankruptcy as soon as this week-sources – (Reuters) – Chesapeake Energy Corp is preparing to file for bankruptcy as soon as this week, said three people familiar with the matter, becoming the largest oil and gas producer to unravel after an energy market rout caused by the coronavirus outbreak. The Oklahoma City-based company, co-founded by the late wildcatter Aubrey McClendon, is in the final stages of negotiating a roughly $900 million debtor-in-possession loan to support its operations while under Chapter 11 bankruptcy-court protection, two of the sources said. The company is also in talks with creditors to “roll up” some of its existing debt and make it part of the bankruptcy loan, bringing the total debtor-in-possession financing closer to $2 billion, the sources added. The company is reeling under a mountain of debt totaling more than $9 billion. Chesapeake is also attempting to negotiate an equity infusion from creditors to help it emerge from bankruptcy proceedings, one of the sources said. Chesapeake plans to complete its negotiations with its creditors and file for bankruptcy as soon as Thursday, the three sources said. The timing could slip to next week depending on the progress the company makes in these discussions, the sources added. If the company manages to emerge from bankruptcy, creditors that include Franklin Resources Inc, will take over Chesapeake in exchange for eliminating more than $7 billion of its debt under the outlines of a plan being negotiated, one of the sources said. Franklin is among Chesapeake’s most significant creditors, holding large portions of its debt.
Chesapeake Energy’s likely bankruptcy follows years of debt and a natural gas glut – – A company that bet as aggressively and as visibly as it could on America’s natural gas boom – and then bet some more, helping push that boom even further – has been unable to squirm free in the series of busts that followed and is in talks with its creditors that could lead to bankruptcy court. Chesapeake Energy, based a thousand miles from the bay it’s named after, helped remake Oklahoma City when times were good thanks to its founder’s enthusiasms, which included an NBA team, an Olympic rowing center and white-water course, arts programs, and support for local schools. The company capitalized on new technologies in horizontal drilling and hydraulic fracturing, and in the years leading up to 2012, took on billions of dollars in debt to keep growing. The philanthropic founder, Aubrey McClendon, said that America could become a gas exporter and that gas would be the bridge fuel to a cleaner future. All that largely came true, except that the success of fracking drove the price of gas down so far the company could no longer bear the burden of its debt. Covid-19 was the final insult. More than a dozen energy companies have sought refuge in Chapter 11 bankruptcy this spring as demand cratered worldwide – including Whiting Petroleum and Extraction Oil & Gas – and Reuters reports that Chesapeake may soon join their ranks. Chesapeake didn’t invent fracking and it didn’t discover new fields, but it grew to become the second-largest gas producer in the United States, and McClendon was the energetic prophet of natural gas prosperity. But the heyday ended in 2013, when he was ousted from the company. Three years later, he was indicted on charges of price fixing in a case involving a new company he had started, and the day after the charge was made public, he died when his car hit a bridge abutment.
Chesapeake Energy Drilled Its Own Grave – Chesapeake Energy is reportedly on the brink of bankruptcy.. While the recent slump in commodity prices might go down as the culprit, the company’s issues run much deeper than that. The biggest problem is that the company’s management team has made a series of missteps over the last few years that made matters much worse. Here’s a look back at some of their head-scratching moves that contributed to its impending demise. In late 2014, Chesapeake Energy made what seemed like a brilliant move at the time. The company unloaded some of its Marcellus and Utica Shale assets to Southwestern Energy for roughly $5 billion in cash. That move helped fortify its financial position during a deep oil price downturn. At the time of the deal, Chesapeake had roughly $11.5 billion of outstanding debt. However, instead of applying all of its financial windfall toward debt reduction, Chesapeake used most of it for other things. One of the big blunders was allocating $1 billion of it to repurchase stock. While the move initially retired a meaningful amount of shares, Chesapeake has gone on to significantly dilute investors via debt exchanges and an acquisition: The subsequent wipeout from the dilution and other factors incinerated the $1 billion the company used to repurchase its shares. Chesapeake also used some of the cash proceeds to cover the gap between cash flow and capital expenses to develop new wells so that it could grow its production. That strategy of selling assets to cover cash flow shortfalls would continue for the next several years. Because of that, debt has barely budged from its late 2014 level despite the Southwestern deal, as well as several subsequent asset sales (including offloading the rest of its Utica shale assets for $2 billion in 2018): Another disastrous move by Chesapeake’s management team was the purchase of WildHorse Resource Development, which closed in early 2019. The roughly $4 billion purchase price included the assumption of WildHorse’s debt, as well as a cash component. As a result, the deal added $1.375 billion of debt to Chesapeake Energy’s balance sheet, contributing to the increase in its total debt from $8.168 billion at the end of 2018 to $9.78 billion at the end of the 2019’s first quarter. While the company chipped away at some of that debt since then, its total debt outstanding currently stands at about $9 billion. In hindsight, if the company didn’t take on nearly $1.4 billion of debt to buy WildHorse or continue outspending cash flow on drilling more wells, it might not have needed to rely on more asset sales to meet its upcoming debt maturities.
The US Has Already Lost More Than 100,000 Oil And Gas Jobs – The US oil and gas labor market is amongst the world’s most severely hit by the downturn that the Covid-19 pandemic has brought, a Rystad Energy analysis of the latest data from the US Bureau of Labor Statistics (US BLS) reveals. More than 100,000 oil and gas jobs have already been lost in total, with most of them coming from the support activities market. The data shows that the four oil and gas segments most affected are support activities for oil and gas operations (44,550 jobs cut from a pre-Covid-19 level of 233,550), pipeline and gas and related construction (16,000 jobs cut from 227,000), drilling of oil and gas wells (13,450 jobs cut from 79,450) and oil and gas extraction (9,600 jobs cut from 156,600). In addition to the above four segments from the US BLS, Rystad Energy has included more components of the oil and gas industry chain, thus independently estimating the total job cuts to exceed 100,000 to date. The support activities segment in particular reveals a staggering employment slump of 20% compared to February’s pre-Covid-19 levels. “The job cuts can be attributed mainly to the nosediving oil prices driven by a sharp contraction in domestic oil demand, which has resulted in an unprecedented demand-supply imbalance. In response to the weakened demand, operators and service providers alike have been frantically cutting jobs,” says Rystad Energy’s Vice President Energy Service Research Matthew Fitzsimmons. Heavy construction labor demand in the US increased by 3.4% in May, but the oil and gas industry did not contribute to this increase. Since the outbreak of the pandemic in the US in early February, oil and gas construction jobs have decreased by more than 10%. We believe this sector within the oil and gas industry will take a more cautious approach to new construction activity, waiting for the safety risks associated with Covid-19 to recede. In addition to battling the safety risks with ongoing work, various large operators are now delaying or pulling out of new facility construction. In Louisiana alone, more than 40% of liquefied natural gas (LNG) investments scheduled for this year have been postponed or canceled.
How negative oil prices revealed the dangers of the futures market – A historic drop occurred on April 20, when the price of West Texas Intermediate crude dropped by almost 300%, trading at around negative $37 per barrel. The price of oil has steadily recovered, jumping by nearly 90% in May and registered the best month on record for WTI. However, the petroleum industry is still reeling from the effects of the coronavirus pandemic. Major companies like Chevron, Exxon and ConocoPhillips have announced deep production cuts and Whiting Petroleum in April became the first major company in the industry to file for bankruptcy protection.The crash in demand for oil that followed the pandemic played a major role in the move to negative prices. “At the trough, we probably saw demand in April bottom out down 30%. So we’ve never seen anything like this certainly in the last 40 years since world oil markets have developed,” said Severin Borenstein, a professor of business at the University of California, Berkeley.To make matters worse, a price war erupted between oil giants Saudi Arabia and Russia in early March after OPEC and its allies failed to reach an agreement on deeper supply cuts. As supply remained steady while demand struck record-breaking lows, the industry quickly began running out of storage space to put their oil. This was devastating news for investors of WTI futures who are expected to take physical possession of the oil when the contract expires.”WTI is special in a way because it’s so tightly connected to physical oil,” said Derrick Morgan, senior vice president of American Fuel & Petrochemical Manufacturers. As the delivery date for WTI grew near, investors began a massive sell-off to take the contract off their hands, prompting an unprecedented crash into the negative territory.The historic drop quickly sent shock waves through the U.S. financial market. The Dow plunged by over 1,200 points over the following two days and brokerage firms took multimillion-dollar hits to cover customers’ losses. However, experts point out that although the event was unprecedented, there was no need to panic. “There were very few contracts. There was very little trading at those prices and the price very quickly rebounded into positive territory,” according to Borenstein. Experts think the impact of the turbulent prices will likely be more severe for the U.S. shale industry, which is often in heavy debt due to its high production costs.
Saudi Oil Exports to U.S. Plunge To Lowest Level in 35 Years – After flooding the U.S. with crude earlier this year, Saudi Arabia has all but cut off the taps to the American oil market. The kingdom has exported just one cargo to the U.S. so far in June, equivalent to about 133,000 barrels a day, tanker-tracking data compiled by Bloomberg show. That’s about one-tenth of the 1.3 million barrels a day it shipped in April, when Riyadh flooded the global market during a brief price war against Russia. If the low pace of exports is sustained in the second half of the month, U.S. imports of Saudi crude could drop to the lowest level in 35 years, helping the American crude market re-balance, according to traders and analysts. “Saudi oil arrivals will fall just as domestic refiners will start raising runs and domestic production continues to decline,” said Amrita Sen, chief oil analyst at consultant Energy Aspects Ltd. “U.S. refiners will have to import from elsewhere and run down stocks,” she added. To be sure, several Saudi tankers haven’t yet indicated their final destinations, so the final tally into the U.S. could be a tad higher. Yet, the trend so far in June is unmistakable: the deluge of Saudi oil that threatened to overwhelm American refiners is dwindling. Saudi oil industry officials, speaking privately, say the kingdom is unlikely to boost shipments into the U.S. in the second half of the month and into July. By slashing U.S. crude exports, the Saudis can influence the most highly visible oil market in the world as American customs data allow for near real-time monitoring of shipments. Less Saudi petroleum is likely to reduce the closely watched American crude stockpiles, amplifying the price impact. The recent inundation of Saudi crude in the U.S. is largely the lingering effect of a price war earlier this year. For much of 2019 and early 2020, Saudi Arabia shipped relatively little crude into America, with average arrivals running at about 475,000 barrels a day, according to U.S. government data. But that changed in April, when Riyadh opened the taps after failing to reach an agreement with its OPEC+ partners to cut production. Saudi crude takes about 45 days to reach the U.S. Gulf of Mexico and the U.S. West Coast, so the impact of the April export flood wasn’t felt until late May and early June, when U.S. imports of Saudi crude jumped to about 1.5 million barrels a day. As the Saudi tankers unloaded their cargo, U.S. crude stocks climbed to a record high, putting pressure on oil benchmarks.
.
include(“/home/aleta/public_html/files/ad_openx.htm”); ?>


