from the St Louis Fed
— this post authored by Charles Gascon, Regional Economist, and Kathryn Bokun, Research Associate
The Federal Reserve Bank of Dallas recently introduced the Social Distancing Index (SDI) using geolocation data constructed at the county, metropolitan statistical area (MSA), state, and national levels.[ 1] The SDI uses seven mobility variables that capture the length of time devices are at home or away as well as the distance devices travel from home.[ 2] A higher SDI indicates more social distancing.

In this context, social distancing more accurately reflects individuals’ decisions to stay at home, not necessarily whether other social distancing guidelines – such as maintaining a 6-foot distance – are followed when individuals choose to leave home.
National Trends in Social Distancing
All indexes are scaled so that the national SDI reaches 100 in the second week of April, with the index averaging zero for January and February 2020. The figure below plots the national SDI from Jan. 3 to May 9. The color of each data point corresponds to SDI level based on five groupings of the SDI measure. Generally, a value less than 25 represents the level of activity prior to social distancing guidelines, and a value greater than 100 represents the level of activity during the peak of social distancing.
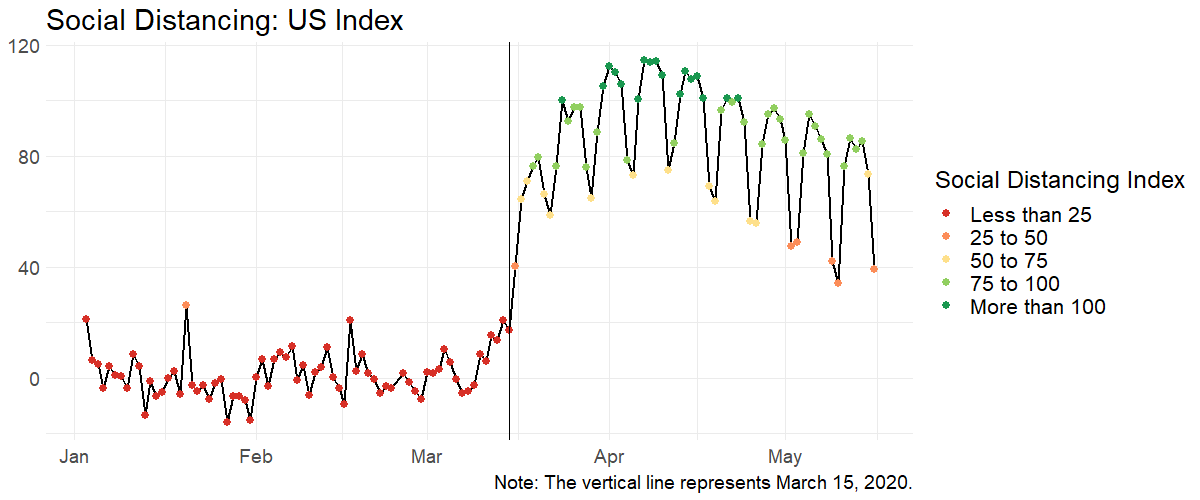
Nationally, the largest increase in the SDI occurred during the week of March 15 (noted by the vertical line), when it increased from 17 to 59 the following Sunday. This indicates that mobility dropped by 2.5 times. As the number of new COVID-19 cases declined and regions relaxed stay-at-home orders, the SDI turned downward.
Social Distancing Fluctuations during the Week
There is a cyclical pattern over the course of a week within the index as well. The figure below illustrates this daily variation by highlighting the SDI by month and day of the week for the nation, for MSAs and for all rural counties.
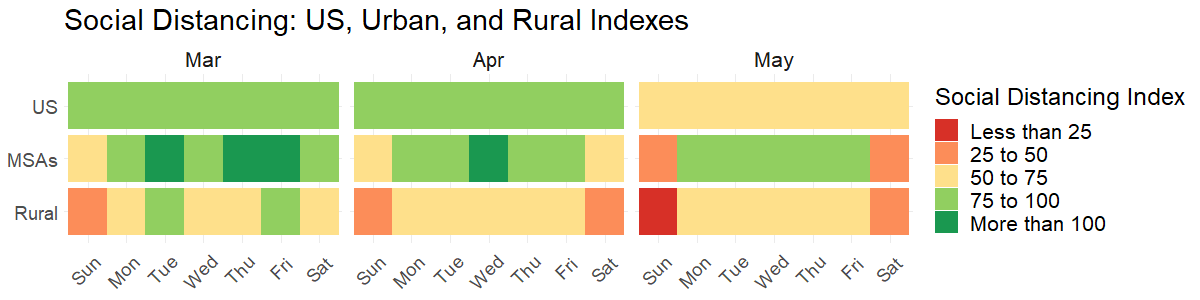
The SDI sharply drops on the weekends. For the national index, notice that the weekdays are green (indicating higher SDI values), but weekends are yellow or orange (indicating lower SDI values).
The SDI for all MSAs was generally higher or equal to the national SDI. While SDI for all rural counties shows just a slight increase in social distancing and generally trends below the national index. Social distancing appears to be most effective during weekdays in metropolitan areas.
At first glance, this may suggest that metropolitan areas are more effective as social distancing. However, this may also occur as people in rural areas need to travel longer distances to reach essential services. With lower levels of population density in these areas, this may not mean greater interaction with other persons.
Social Distancing in the Eighth Federal Reserve District
The final figure below plots the SDI for 13 of the largest MSAs in the Eighth District.
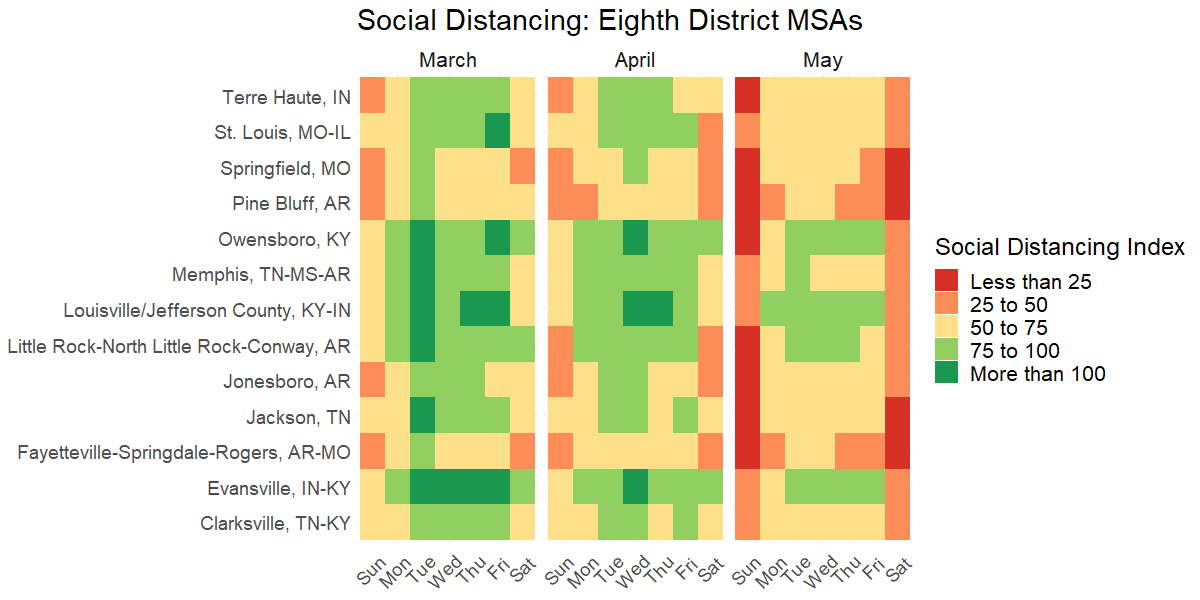
The St. Louis metro area and Evansville, Ind.-Ky., had some of the highest index values for weekdays in March and April. By May, weekday social distancing declined from levels in March, with the sharpest declines on Saturdays.
In smaller MSAs, social distancing practices in May look more similar to the trend in rural counties. For example, Pine Bluff, Ark., and Jackson, Tenn., showed some of the lowest levels of social distancing during weekdays, with weekends returning to precrisis levels of activity.
Summary
The SDI shows a sharp increase in social distancing at the national, state, MSA and county levels during the week of March 15 in response to the declaration of national emergency due to the COVID-19 pandemic. Social distancing appears most strongly practiced during weekdays in metropolitan areas. However, social distancing generally declines in May across geographies. As states and counties begin to reopen, this information could be important in understanding the effectiveness of stay-at-home orders on household mobility.
Notes and References
1 The SDI uses daily geolocation data from 16 to 20 million mobile devices available by the firm SafeGraph.
2 The SDI is the first principal component, or a weighted average, of each of the underlying series.
Additional Resources
- St. Louis Fed’s COVID-19 resource page
- On the Economy: COVID-19, School Closings and Labor Market Impacts
- On the Economy: COVID-19 and Unemployment Risk: State and MSA Differences
Source
https://www.stlouisfed.org/on-the-economy/2020/may/social-distancing-mostly-week
Disclaimer
Views expressed are not necessarily those of the Federal Reserve Bank of St. Louis or of the Federal Reserve System.


