from the St Louis Fed
— this post authored by Bill Emmons, Lead Economist; Ana Kent, Policy Analyst; and Lowell Ricketts, Lead Analyst, Center for Household Financial Stability
Based on the headlines, it seems like consumer debt – the combination of car loans, student loans, mortgages and other types of debt – hits a new peak every quarter. For those of us who are students of history, this may elicit feelings of déjà vu.

The elevated mortgage debt levels seen during the housing bubble proved to be untenable for many consumers, leading to financially destructive defaults and foreclosures. Based on the current trend, it would appear that consumers are borrowing more than ever before, raising questions about the sustainability of these debt levels. However, our analysis through the St. Louis Fed’s Center for Household Financial Stability sheds some light on why this might not be the case based on two relatively common adjustments.
Highs in Consumer Debt
First, some facts seem to corroborate the narrative. As of the end of the second quarter of 2019, total consumer debt amounted to $13.9 trillion. That’s the highest it’s been since data in the Federal Reserve Bank of New York and Equifax’s Consumer Credit Panel (CCP) have been available. In fact, this is the 10th consecutive quarter where total consumer debt has hit a historic high.
We focused on mortgage debt, which is particularly interesting given that this was the epicenter of the housing bubble and eventual bust that caused the Great Recession. Total mortgage debt in the U.S. amounted to $9.3 trillion in the third quarter of 2008 (accounting for the lion’s share of total consumer debt), as seen in the figure below. As of the end of the second quarter, mortgage debt surpassed the previous record with $9.4 trillion in debt.
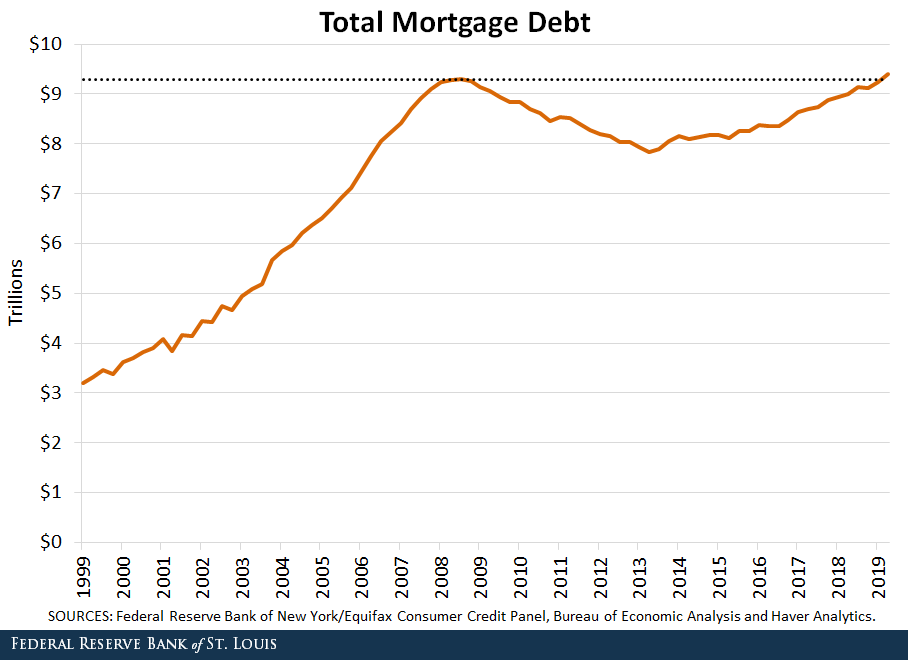
DESCRIPTION: This line graph shows total nominal mortgage debt in the U.S. from the first quarter of 1999 to the second quarter of 2019. Mortgage debt rose steadily from 1999 to a peak of $9.3 trillion observed in the third quarter of 2008. Debt levels declined after that to a low of $7.8 trillion in the second quarter of 2013. Following that point, total mortgage debt levels rose again until surpassing the historic peak in the second quarter of 2019. In percentage terms, this is 1.2% above the peak.
Adjusting for Inflation
Debt values can be expressed in nominal terms or real (inflation-adjusted) terms. Nominal terms reflect the actual dollar amount of the debt obligation for the specific period. This makes time comparisons difficult, because prices change due to inflation (why your grandpa may reminisce that a soda was only $0.10 “back in my day”).
Inflation not only pushes up soda prices but also loan principals, or the amount borrowed. Thus, consumer debt also rises to a certain degree due to rising price levels in the broader economy.
That’s when real terms can save the day by adjusting nominal values to make consumer debt comparable over time. We adjusted mortgage debt levels across the time period to 2019 dollar values. The first figure is in nominal terms, but the figure below shows that real mortgage debt remains well below the peak registered prior to the Great Recession.

DESCRIPTION: This line graph shows total real mortgage debt in the U.S. from the first quarter of 1999 to the second quarter of 2019. All values were adjusted to be in 2019 dollars. After adjusting for inflation, total real mortgage debt reached a maximum of $10.8 trillion in the first quarter of 2008. As of the second quarter of 2019, real mortgage debt was $9.4 trillion, approximately $1.4 trillion less than its peak. In percentage terms, this is 13.2% below the peak.
Adjusting for the Number of Consumers
To accurately gauge the popularity of consumer debt in the broader economy, it’s helpful to adjust for the number of potential borrowers. The CCP population consists of all Americans with a Social Security number and a credit file. As the population grows, so does the number of consumers. By virtue of this expansion alone, we can also expect consumer debt levels to rise.
Dividing total real mortgage debt by total consumers gives us an insight into how much mortgage indebtedness exists per consumer in the economy, on average. The result can be seen in the figure below.

DESCRIPTION: This line graph shows total real mortgage debt per consumer in the Consumer Credit Panel from the first quarter of 1999 to the second quarter of 2019. All values were adjusted to be in 2019 dollars. Real mortgage debt per consumer reached its maximum of $45,106 in the fourth quarter of 2008. The latest observation was $34,730, approximately $10,376 less than its peak. In percentage terms, this is 23% below the peak.
By this adjusted measure, mortgage debt dips even further below the peak of borrowing prior to the Great Recession. It’s true that mortgage debt is spread over fewer consumers now than in 2008, but real mortgage debt has declined by even more.
It’s clear across all three figures that mortgage debt is growing. However, looking at nominal mortgage debt captures only part of the story. By the adjusted measures shown here, American consumers have a long way to go before recreating the indebtedness that characterized the housing bubble.
Additional Resources
- Open Vault: What Wealth Inequality in America Looks Like: Key Facts & Figures
- Housing Market Perspectives: Recession Signals: Home Sales Trend Lower in All Four Regions
- On the Economy: How Do Students Pay for College?
Source
https://www.stlouisfed.org/on-the-economy/2019/october/consumer-debt-new-peak-depends
Disclaimer
Views expressed are not necessarily those of the Federal Reserve Bank of St. Louis or of the Federal Reserve System.


