from the Atlanta Fed
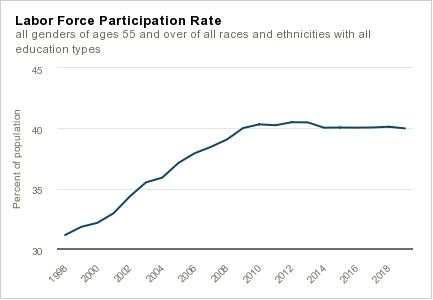
The rate of labor force participation (LFP) by people age 55 and over had been rising during the decade leading up to the Great Recession. But more recently, as the following chart shows, the share of older individuals engaged in the labor market has barely budged. (We should note that for all the charts in this post, the data are from the Current Population Survey from the U.S. Bureau of Labor Statistics and the authors’ calculations.) What behavioral and demographic factors could be underlying these trends?
We can use the Atlanta Fed’s Labor Force Dynamics web page to explore why the 55-and-over population has a relatively flat LFP rate of late. One factor working to depress older Americans’ LFP rate is the increase in the share of those 55 and older who are retired: from 46.9 percent in the second quarter of 2014 to 47.8 percent in the second quarter of 2019 (see the chart).

This change in the overall retirement rate of the 55-plus cohort is actually the result of the union of two opposite forcesone demographic and one behavioral. From the perspective of demographics, a greater share of the population is reaching the typical retirement age threshold of 65. For instance, the share of people aged 65 and older has increased from 18 percent in the second quarter of 2014 to 20.3 percent in the second quarter of 2019 (see the chart).

This demographic shift is important because the retirement rate is much higher for those 65 and older compared to those from 60 to 64 years old. For example, the retirement rate in 2019 for those 60 – 64 is around 25 percent, but it’s 56 percent for those aged 65 – 69, and it’s 81 percent for those 70 and older (see the chart).

However, the retirement rate among those 60 – 64 and those 65 – 69 has also declined in recent years. This change in behavior within older age groups is partly offsetting the downward pressure on participation coming from having a larger share of population over 65.
A second factor that has worked against the overall retirement effect and helped push up the LFP rate of the 55-plus population has been a decline in the share of older individuals saying they are not participating in the labor force because of disability or illness. This rate has decreased from 8.6 percent in the second quarter of 2014 to 8.1 percent in the second quarter of 2019 (see the chart).

As the chart below shows, this shift is largely a demographic effect. Nonparticipation because of disability/illness drops off significantly as people turn 65, so the fact that a greater share of people 55 and older are now 65 and older decreases the overall share of nonparticipation for disability/illness reasons as well. However, it’s important to note that a lower disability/illness rate for those 65 and older doesn’t mean that this older population is actually less disabled or sick. It is more that individuals in the data fall into only one category, and those 65 and older are more likely to say they are retired than to say they are disabled or ill.

A third force helping push up the LFP rate is the decline in the share of older individuals on the sidelines of the labor market – those who are not participating but nonetheless want a job – from 1.8 percent in the second quarter of 2014 to 1.6 percent in the second quarter of 2019 (see the chart).

This “shadow labor force” effect on participation is mostly the result of changes in behavior (that is, a reduced propensity to remain on the sidelines within age groups) rather than from demographic changes because the rate has declined within age groups, whereas the levels are roughly similar across age groups (see the chart).

To put these various pieces together, the following chart summarizes the overall contributions of demographic and behavioral forces on the LFP rate among the 55-plus population between the second quarter of 2014 and the second quarter of 2019. The chart shows that the contributions stemming from changes in demographics and behavior have largely offset each other.

As I’ve already described, the biggest demographic effects come from having more people at an age with two specific characteristics: a relatively high rate of nonparticipation because of retirement and a relatively low rate of nonparticipation because of disability or illness. But as the following chart shows, from the second quarter of 2014 to the second quarter of 2109, the retirement demographic dominates, so the overall demographic LFP effect is a negative one.

Conversely, the largest behavioral shifts are, first, a lower propensity within older age groups to stay out of the labor force because of retirement and, second, a lower share of older people wanting a job but not looking for one. As the following chart shows, from the second quarter of 2014 to the second quarter of 2019, these behavioral changes combine to push up LFP by enough to nearly offset the demographic shifts.

It seems reasonable to presume that the aging population will continue to be an important source of downward pressure on the LFP rate of older Americans over the next few years. What will be telling is whether or not the behavioral shifts we have seen will persist as strongly as they have up to this point and continue to provide a countervailing positive influence on participation.
The tools on the Atlanta Fed’s Labor Force Dynamics web page are very useful for understanding what’s behind changes in LFP for different demographic groups. In addition to cuts for different age groups, you can look at differences between men and women and among different racial and ethnic groups and levels of educational attainment. You can download the chart data – the charts in this blog are downloaded images from the web page – and even download the underlying Current Population Survey microdata from the Kansas City Fed’s CADRE web page if you want to create your own cuts. Check it out!
Source
About the Authors

John Robertson, a senior policy adviser and

Ellyn Terry, an economic policy analysis specialist, both in the Atlanta Fed’s research department
include(“/home/aleta/public_html/files/ad_openx.htm”); ?>


