from the St Louis Fed
— this post authored by Bill Emmons, Lead Economist; Ana Kent, Policy Analyst; and Lowell Ricketts, Lead Analyst, Center for Household Financial Stability
The demographic makeup of the country is rapidly changing. In The Bigger They Are, The Harder They Fall: The Decline of the White Working Class, we documented decreases in the shares of income, wealth and population of whites without a four-year college degree (hereafter, white working-class). Their absolute numbers are shrinking as well.

Today, we’re kicking off a series extending that work. The first post in this three-part series will examine the national and regional trend. In the next blog post, we’ll explore the changing demographics at the state and county level. In the final post, we’ll dive deeper into potential causes of the decline and economic consequences.
National and Regional Change
Using the Current Population Survey Annual Social and Economic Supplement, we estimated five-year growth rates shown in the figure below.1

DESCRIPTION: This bar and line chart shows the five-year growth estimates of the population of the white working class in the United States between 1975 and 2018. The bars show the growth of the population in millions and the line shows the share of the total population that is white working class at the end of each five-year period. For example, between 1975 and 1980 the white working-class grew by 2.1 million people and made up 66% of the population in 1980. Between 2015 and 2018, the white working-class shrank by 2.6 million people and its share decreased to 40% of the population in 2018.
The data indicate that the non-Hispanic white working-class’ decline in absolute numbers has been consistent for many years. Looking at the civilian noninstitutionalized population age 25 and older, the white working-class’ population peaked in 1995 at 95.6 million people. Its population has fallen in each consecutive year following 2009. In 2018, the white working-class population reached a 37-year low of 87.1 million individuals. Meanwhile, the overall civilian noninstitutionalized U.S. population age 25 and older increased by 65% during the same time span.
The white working-class’ share of the overall population has also fallen steadily and is now at an all-time low. In 1975, over 7 in 10 U.S. individuals were white working class.2 Each year thereafter, their share decreased, dipping below a majority (49.8%) in 2004 and hovering just below 40% in 2018. (See the figure below.)
In contrast, non-Hispanic whites with at least a four-year college degree and the group of Hispanics, blacks and other nonwhite races with less than a four-year degree steadily increased their overall shares for more than 40 years and have very similar population sizes today: 55.3 million and 55.8 million in 2018, respectively.
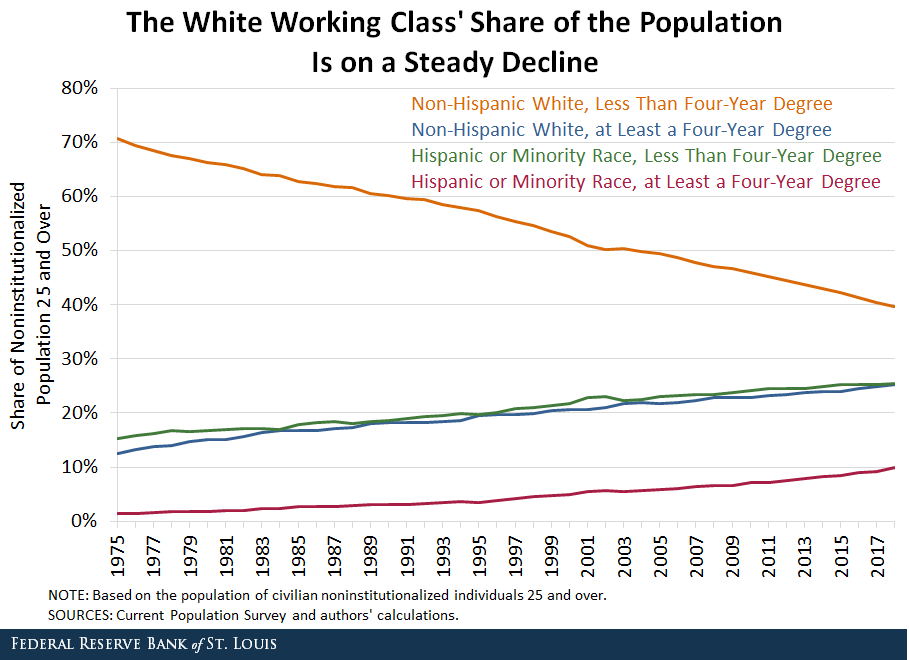
DESCRIPTION: This line graph shows the changing shares of the U.S. population for various groups between 1975 and 2018. From top to bottom, the lines represent non-Hispanic whites with less than a four-year degree; Hispanics, blacks and other nonwhite races with less than a four-year degree; non-Hispanic whites with at least a four-year degree; and Hispanics, blacks and other nonwhite races with at least a four-year degree. In 1975, these shares were 71%, 15%, 12% and 1%, respectively. In 2018, these shares were 40%, 25%, 25% and 10%, respectively.
This national demographic transformation has not been distributed evenly across regions. Between 1975 and 2018, the white working-class’ shares fell more steeply in the Northeast and West than in the Midwest and South, as seen in the figures below.


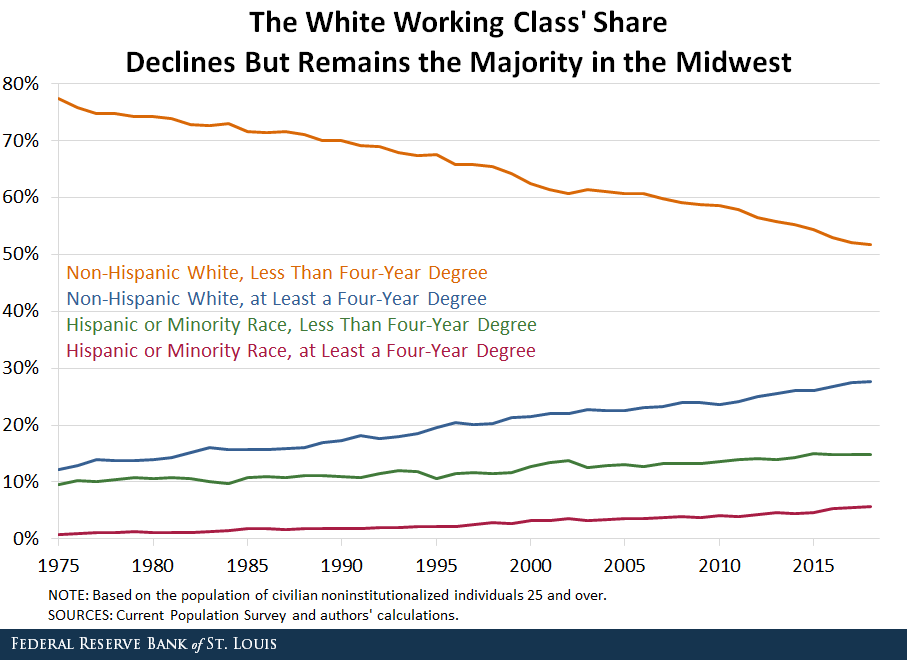

DESCRIPTION: These line charts show the changing shares of the U.S. population for various groups between 1975 and 2018 by region. The groups are non-Hispanic whites with less than a four-year degree; non-Hispanic whites with at least a four-year degree; Hispanics, blacks and other nonwhite races with less than a four-year degree; and Hispanics, blacks and other nonwhite races with at least a four-year degree.
Only the Midwest remains majority-white working-class (52%). In the Northeast and South, the white working class is the largest group defined by education and race/ethnicity, but it is less than a majority (39% and 38%, respectively). In the Northeast, the second largest group is white four-year college grads at 30%, while it is the nonwhite working class in the South at 29%. In the Western U.S., the nonwhite working class’ share began to surpass that of the white working class in 2016 and stood at 33% in 2018, compared to the white working-class’ share of 31%.
Why Is the White Working Class in Decline?
Both the white working class’ share and its absolute numbers are shrinking. In fact, our projections indicate that the white working class will be a minority group by 2034.3 Several trends may help to explain this group’s decline. For example, the shares and numbers of white four-year college graduates (i.e., white grads) and nonwhites are increasing.4
Many more whites are college grads today, and a combination of immigration and higher nonwhite birthrates has driven up the number of minorities (with and without college degrees). While difficult to disentangle the relative importance of these effects, the population shares of white four-year college graduates and nonwhites more than doubled between 1975 and 2018 (to 25% and 35%, respectively), indicating both are key factors in the white working-class’ declining share.
Of course, the shrinking absolute numbers of the white working-class also contribute. Other researchers have convincingly argued that increases in “deaths of despair” – including alcohol, drug and other opioid-related deaths, and suicides – have hit middle-aged whites with less than a bachelor’s degree particularly hard.5
Whatever the cause, the decline of this group will undoubtedly continue to have lasting economic and social consequences for the U.S.
Notes and References
1 The final period is a shorter range of 2015-2018.
2 Civilian noninstitutionalized population age 25 and older.
3 Our forecasting estimates indicate the white working class will reach minority status between 2032 and 2034.
4 Necessarily, shares of the population must add up to 100%. This means that as the white working class’ share declines, the share of at least one other group must increase.
5 See Case, Anne; and Deaton, Angus. “Mortality and morbidity in the 21st century.” Brookings Papers on Economic Activity, Spring 2017.
Additional Resources
- Demographics of Wealth: The Bigger They Are, The Harder They Fall: The Decline of the White Working Class
- On the Economy: Is College Still Worth It? It’s Complicated
- On the Economy: College Education Persists Less for Blacks and Hispanics
- Bridges: A Checkerboard, Not a Melting Pot: Racial and Educational Diversity in the Eighth District
Source
Disclaimer
Views expressed are not necessarily those of the Federal Reserve Bank of St. Louis or of the Federal Reserve System.


