from the St Louis Fed
— this post authored by B. Ravikumar, Senior Vice President and Deputy Director of Research, and Brian Reinbold, Research Associate
The rise of globalization has led to increasingly complicated supply chains. Raw materials and intermediate goods now move strategically throughout the world before a final good reaches the consumer. Traditional measures of trade, such as those which track exclusively gross trade flows, often do a poor job of capturing this complexity of goods moving along the supply chain.

For example, when Apple’s iPhone is assembled in China and then shipped to the U.S., the factory cost of the iPhone (about $240) will be added to the U.S. trade deficit with China.1 The factory cost includes cost of components to make the iPhone – such as a touchscreen display from Japan, processors from Taiwan and memory from South Korea – and the cost of assembling the components. The assembly cost estimate is only $8.46, or less than 4 percent, of the factory cost of an iPhone.
In other words, the U.S. would run a $240 trade deficit in terms of gross trade with China, but only an $8.46 trade deficit in terms of value-added trade.
What Is Value-Added Trade?
Traditional trade measures record gross, or total, flows of goods and services every time they cross a border. This includes the cost of inputs, plus the value added by each country. Such traditional trade measures lead to double counting, since countries trade intermediate goods for further processing.
Additionally, as we saw in the iPhone example above, such measures neglect the role of other countries in the supply chain. One way to combat this issue is to look at the value added, such as labor compensation and profits, by each country at each step of the production process. This provides a better way of incorporating the intricacies of today’s global supply chain into trade accounting.
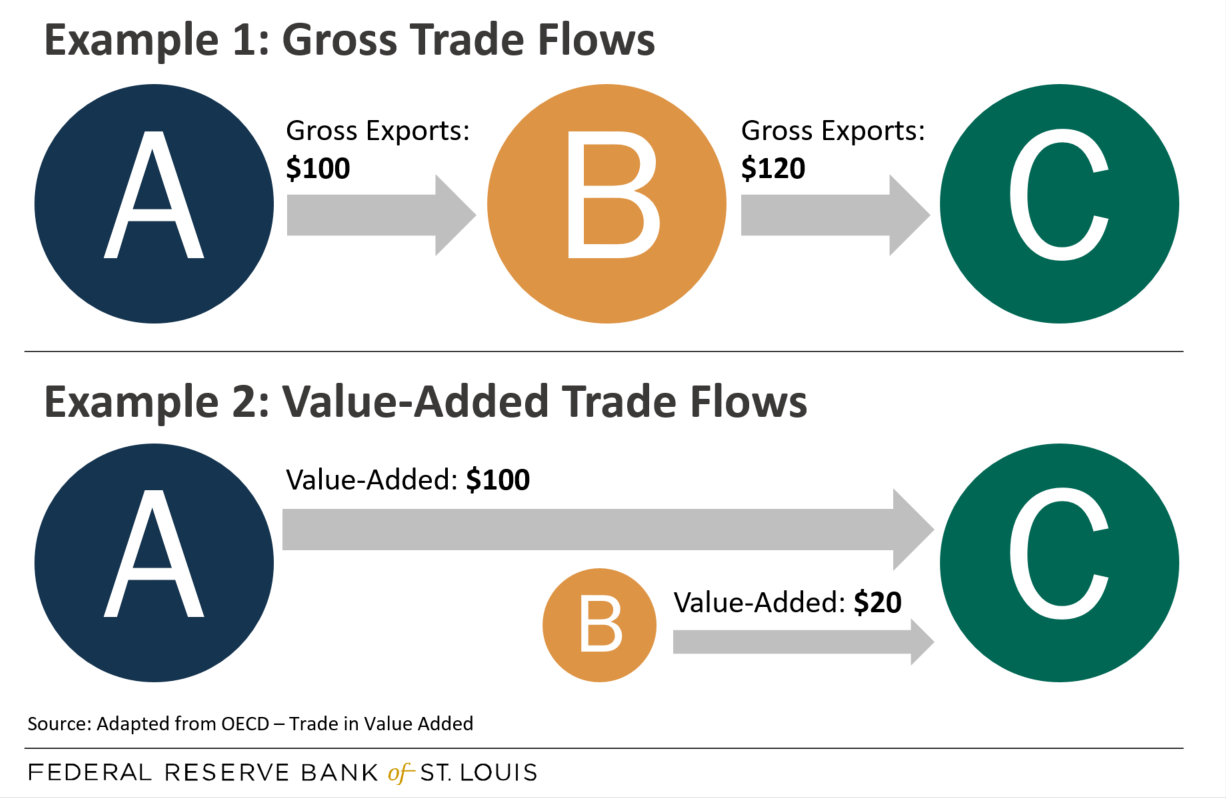
The figure below provides a simple schematic that illustrates the difference between gross and value-added trade flows.
Suppose that Country A ships $100 worth of raw materials to Country B, and Country B further processes them into $120 worth of goods. Country B then ships these goods to Country C.
- Example 1: Although Country B only added $20 of value, traditional trade measures would conclude that Country B exported goods worth $120 to Country C.
- Example 2: On the other hand, value-added trade would only count the value each country uniquely added in the production process. Country A would have exported $100 worth of goods to Country C, and Country B would have exported $20 worth of goods to Country C.
The table below further summarizes this example by highlighting Country C’s trade deficit with countries A and B. Using gross trade flows, Country C would run a $120 trade deficit with Country B but would not have had a trade deficit with Country A.
Under value-added trade, Country C’s trade deficit would be distributed differently. Country C would instead have a $100 trade deficit with Country A and a $20 trade deficit with Country B. Note that Country C’s global trade deficit (i.e., the sum of the trade deficits with Country A and B) is the same under both accounting systems. Although simple, this example summarizes the salient differences between gross and value-added trade flows.
| Deficit with | Gross Trade Deficit | Value-Added Trade Deficit |
|---|---|---|
| Country A | $0 | -$100 |
| Country B | -$120 | -$20 |
| World (Country A + Country B) | -$120 | -$120 |
| Federal Reserve Bank of St. Louis | ||
A Different Perspective
The OECD provides value-added trade statistics from 2005-15.2 The table below shows the U.S. trade balance in 2015 for several major trading partners in terms of gross trade and value-added trade.
| Gross Trade Balance (in Billions) | Value-Added Trade Balance (in Billions) | |
|---|---|---|
| Brazil | $18.5 | $15.4 |
| Canada | -$32.1 | -$9.9 |
| China | -$251.5 | -$219.2 |
| France | $4.8 | $0.04 |
| Germany | -$58.2 | -$60.4 |
| Hong Kong | $5.2 | $3.6 |
| India | -$61.2 | -$49.0 |
| Italy | -$32.4 | -$25.3 |
| Japan | -$26.4 | -$33.3 |
| Mexico | -$79.0 | -$40.0 |
| Netherlands | $15.4 | $4.3 |
| South Korea | -$11.8 | -$21.9 |
| U.K. | -$20.3 | -$18.7 |
| Federal Reserve Bank of St. Louis | ||
| Source: OECD-WTO: Statistics on Trade in Value Added | ||
The U.S. ran a $32 billion gross trade deficit with Canada in 2015, but only a $10 billion value-added trade deficit. With Mexico, the U.S. ran a $79 billion gross trade deficit but only a $40 billion value-added trade deficit. The U.S. trade deficit with Canada and Mexico declines by 70 percent and 50 percent, respectively, when looking at the value-added trade balance as opposed to the gross trade balance.
We also see that the U.S. trade deficit with China is reduced by 13 percent, possibly reflecting the use of foreign content in many Chinese exports as we saw in the iPhone example.
It is also worth noting that the U.S. global trade deficit remains the same under both gross and value-added trade flows, and it is only the bilateral trade balance that differs depending on whether one looks at gross or value-added trade flows.
Conventional trade statistics may have been sufficient when goods were produced entirely within a nation’s borders, but with increasingly complicated supply chains, and an increasingly interconnected global economy, value-added trade can provide a more accurate picture of global trade.
Notes and References
1 Dedrick, Jason and Kraemer, Kenneth L. “Intangible assets and value capture in global value chains: the smartphone industry” (PDF), Economic Research Working Paper No. 41, World Intellectual Property Organization, November 2017.
2 “Measuring trade in value added,” in Interconnected Economies: Benefiting from Global Value Chains, OECD Publishing, Paris, 2013.
Additional Resources
- On the Economy: How Is the U.S. Trade Balance Shifting?
- On the Economy: What’s Behind the Global Decline in Trade Barriers?
- Dialogue with the Fed: The Economics of Trade
Source
https://www.stlouisfed.org/on-the-economy/2019/april/value-added-trade-measure
Disclaimer
Views expressed are not necessarily those of the Federal Reserve Bank of St. Louis or of the Federal Reserve System.


