
Written by rjs, MarketWatch 666
 Here are some selected new articles from the week ended 14 July 2018.
This article is a feature every Monday evening on GEI.
Please share this article – Go to very top of page, right hand side, for social media buttons.
US gasoline output at a record high, oil supplies at a 41 mo. low; global oil output up in June after May revised lower
Oil prices ended sharply lower this week, after hitting an air pocket and dropping more than 5% on Wednesday, on the back of the announcement of the resumption of Libyan oil output…after falling a half percent to $73.80 a barrel on an increase in US crude supplies last week, contracts for US light sweet crude for August delivery rose 5 cents to $73.85 a barrel on Monday, as reports that Canada’s Syncrude operations would resume activity sooner than expected cut off a rally higher….oil prices then rose 26 cents to $74.11 a barrel on Tuesday, on continued production outages globally, and expectations that sanctions against Iran would limit supplies…on Wednesday, however, oil prices collapsed, with US crude falling $3.73 to $70.38 a barrel, after Libya announced they had resumed exports, and the OPEC reported an increase in oil output; at the same time, North Sea Brent crude, the international benchmark, fell $5.46 to $73.33 per barrel, a daily price move more than three standard deviations from the mean, and the largest one-day drop since February 2016…while Brent crude rebounded $1.11 higher on Thursday, US oil prices were mostly mixed, slipping another 5 cents to $70.33 a barrel at the close, as the resumption of Libyan output offset warnings from the IEA that OPEC was facing a spare capacity crunch…US prices then climbed 68 cents to $71.01 on Friday, but still posted a sharp 3.8% loss for the week, as oil traders weighed returning Libyan supply and global trade disputes against indications of tighter crude supply and shrinking spare output capacity…
Natural gas prices also ended the week lower, dropping in four out of 5 trading sessions in sliding a total of 10.6 cents to $2.752 per mmBTU by the end of the week, despite forecasts for the return of hot weather and a smaller than expected injection of surplus gas into storage….the natural gas storage report for week ending July 6th from the EIA indicated that natural gas in storage in the US rose by 51 billion cubic feet to 2,203 billion cubic feet over the week, which left our gas supplies 725 billion cubic feet, or 24.8% below the 2,869 billion cubic feet that were in storage on July 7th of last year, and 519 billion cubic feet, or 19.1% below the five-year average of 2,722 billion cubic feet of natural gas that are typically in storage after the first week of July…the consensus forecast was for an addition of 56 billion cubic feet to gas in underground storage, so this 51 billion cubic feet increase was a bit below what had been expected, and quite a bit lower than the 77 billion cubic foot of weekly surplus natural gas that has typically been added to storage during the first week of July… since US natural gas supplies as July 6th were still 1,587 billion cubic feet below the 3,790 billion cubic feet we had stored after the first week of November last year, this week’s 51 billion cubic foot addition to supplies now means that we’ll need to add an average of 93 billion cubic feet per week over the next 17 weeks to get our gas supplies back to a normal level before the next heating season’s withdrawals begin…since that’s now unlikely, it means that if the upcoming winter is much colder than normal, then parts of the country will run out of natural gas in storage and shortages will occur before the winter is over…understand, there is no one responsible for seeing that we have adequate natural gas supplies going into the winter, and that US gas producers have a greater incentive to liquefy and export gas at three times the domestic price than to store it here, since any gas shortages that develop will only cause the price to rise, making their remaining gas output more profitable…
The Latest US Oil Data from the EIA
This week’s US oil data from the US Energy Information Administration, covering the week ending July 6th, indicated that due to a big drop in our oil imports, the week saw the largest withdrawal from our commercial crude supplies since 2016….our imports of crude oil fell from last week’s 16 month high by an average of 1,624,000 barrels per day to an average of 7,431,000 barrels per day, while our exports of crude oil fell by an average of 309,000 barrels per day to an average of 2,027,000 barrels per day during the week, which meant that our effective trade in oil worked out to a net import average of 5,404,000 barrels of per day during the week ending July 6th, 1,315,000 barrels per day less than the net of our imports minus exports during the prior week…at the same time, field production of crude oil from US wells was again reported as unchanged at 10,900,000 barrels per day, which means that our daily supply of oil from our net imports and from wells totaled an average of 16,304,000 barrels per day during the reporting week…
At the same time, US oil refineries were using 17,652,000 barrels of crude per day during the week ending July 6th, just 1,000 barrels per day less than they used during the prior week, while at the same time 1,805,000 barrels of oil per day were reportedly being pulled out of oil storage in the US….hence, this week’s crude oil figures from the EIA appear to indicate that our total working supply of oil from net imports, from oilfield production, and from storage was 457,000 more barrels per day than what refineries reported they used during the week….to account for that disparity, the EIA needed to insert a (-457,000) barrel per day figure onto line 13 of the weekly U.S. Petroleum Balance Sheet to make the data for the supply of oil and the consumption of it balance out, essentially a fudge factor that is labeled in their footnotes as “unaccounted for crude oil”… (for more on how this weekly oil data is gathered, and the possible reasons for that “unaccounted for” oil, see this EIA explainer)…
Further details from the weekly Petroleum Status Report (pdf) show that the 4 week average of our oil imports fell to an average of 8,271,000 barrels per day, which was still 5.9% more than the 7,811,000 barrel per day average we imported over the same four-week period last year….the 1,805,000 barrel per day drop in our total crude inventories was all withdrawn from our commercially available stocks of crude oil, as the amount of oil in our Strategic Petroleum Reserve was unchanged….this week’s crude oil production was reported as unchanged despite a 29,000 barrel per day increase in output from Alaska, because the EIA has recently decided to round the weekly oil production estimates to the nearest 100,000 barrels per day, to more closely reflect their inability to accurately model oil output from all the wells in the lower 48 states, and there was no change in the rounded total….US crude oil productionfor the week ending July 7th 2017 was reported at 9,397,000 barrels per day, so this week’s rounded oil production figure is roughly 16.0% above that of a year ago, and 29.3% more than the interim low of 8,428,000 barrels per day that US oil production fell to during the last week of June of 2016…
US oil refineries were operating at 96.7% of their capacity in using 17,652,000 barrels of crude per day during the week ending July 6th, down from 97.1% of capacity the prior week, but still a refinery capacity utilization rate well above historical norms…the 17,652,000 barrels of oil that were refined this week were among the largest refinery throughput figures on record, topped only by the prior three weeks in June of this year, and the 17,725,000 barrels per day that were being refined during the last full week of August 2017….this week’s refinery throughput was also 2.4% higher than the 17,244,000 barrels of crude per day that were being processed during the week ending July 7th a year ago, when US refineries were operating at 94.5% of capacity….
Even with the amount of oil being refined virtually unchanged this week, gasoline output from our refineries was much higher, rising by 388,000 barrels per day to a record high of 10,699,000 barrels per day during the week ending July 6th, after our refineries’ gasoline output had increased by 169,000 barrels per day during the week ending June 29th....with this week’s increase, our gasoline production during the week was 2.2% more than the 10,365,000 barrels of gasoline that were being produced daily during the week ending July 7th of last year…at the same time, our refineries’ production of distillate fuels (diesel fuel and heat oil) fell by 21,000 barrels per day to 5,442,000 barrels per day, after rising by 67,000 barrels per day the prior week…however, this week’s distillates production was still at a seasonal high, and 1.7% higher than the 5,349,000 barrels of distillates per day that were being produced during the week ending July 7th, 2017…
With gasoline production at a record high, we’ll take a look at an historical graph of that production so we can see what’s going on there…
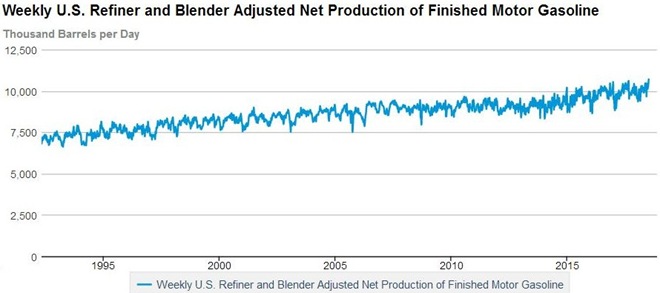
The above is a screen copy of the interactive graph that accompanies the EIA spreadsheet for “Weekly U.S. Refiner and Blender Adjusted Net Production of Finished Motor Gasoline” which gives us the weekly totals in thousands of barrels per day of our total gasoline production from 1992 to the present, adjusted as indicated…it’s a poor graph, but you should be able to see that our gasoline production has been steadily rising over the entire span of this graph, thus repeatedly setting “new record highs” along the way during the summer and winter seasonal peaks of production…ie, the 10,699,000 barrels of gasoline that were produced per day during the week ending July 6th broke the previous record of 10,566,000 barrels per day that had been produced during the week ending August 18th, 2017, which in turn broke the record of 10,537,000 barrels per day set during the week ending December 23rd, 2016, which in turn broke the record of 10,456,000 barrels per day set six weeks earlier….the point being that as long as US refining continues to expand and gasoline production continues to increase, production records are going to be set along the way…so if it hadn’t been this week, more than likely we would have seen another gasoline production record sometime later this year…
However, even with our gasoline production at a record high, our supply of gasoline in storage at the end of the week still fell by 694,000 barrels to 238,997,000 barrels by July 6th, the eleventh decrease in 18 weeks, but just the 12th decrease in 35 weeks, as gasoline inventories, as usual, were being built up over the winter months….our supplies of gasoline fell because our exports of gasoline rose by 699,000 barrels per day to 1,186,000 barrels per day even as the amount of gasoline supplied to US markets fell by 594,000 barrels per day to 9,275,000 barrels per day, while our imports of gasoline rose by 205,000 barrels per day to 853,000 barrels per day….but even after this week’s decrease, our gasoline inventories were still 1.4% higher than last July 7th’s level of 235,656,000 barrels, and roughly 10.6% above the 10 year average of our gasoline supplies for this time of the year…
Meanwhile, with our distillates production little changed, our supplies of distillate fuels increased by 4,125,000 barrels to 117,557,000 barrels during the week ending July 6th, the largest jump in distillate inventories since the first week of this year…that was as our exports of distillates fell by 258,000 barrels per day to 1,152,000 barrels per day, after falling by 426,000 barrels per day the previous week, while our imports of distillates rose by 12,000 barrels per day to 104,000 barrels per day, and while the amount of distillates supplied to US markets, a proxy for our domestic consumption, fell by 321,000 barrels per day to 3,805,000 barrels per day, after increasing by 514,000 barrels per day the prior week…however, since this week’s big inventory increase comes after our distillate supplies had shrunk by 14,452,000 barrels over the six weeks to May 18th on the way to falling to a 13 year low, our distillate supplies for the week ending July 6th still remain 20.8% below the 153,553,000 barrels that we had stored on July 7th, 2017, and roughly 14.7% lower than the 10 year average of distillates stocks for this time of the year…
Finally, with that big drop in our oil imports coming while refineries were consuming oil at near record pace, the week saw the largest withdrawal of oil from our commercial supplies of crude oil since September 2016, as our commercial crude supplies fell by 12,633,000 barrels during the week, from 417,881,000 barrels on June 29th to 405,248,000 barrels on July 6th, which turns out to be the least amount of oil we’ve had in storage since February 20, 2015…and after falling 33 weeks over the past year, our oil inventories as of July 6th were 18.2% below the 495,350,000 barrels of oil we had stored on July 7th of 2017, 17.5% below the 491,172,000 barrels of oil that we had in storage on July 8th of 2016, and 5.6% below the 429,368,000 barrels of oil we had in storage on July 10th of 2015, when the US glut of oil had already risen above the nearly stable supply levels of under 400 million barrels during the prior years…
OPEC’s Monthly Oil Market Report
With oil prices again responding to any changes in OPEC’s oil output, we’ll next take a look at OPEC’s July Oil Market Report (covering June OPEC & global oil data) next, which was released Wednesday of this week and is available as a free download, and hence it’s the report we check for monthly global oil supply and demand data…the first table from this monthly report that we’ll look at is from the page numbered 61 of that report (pdf page 71), and it shows oil production in thousands of barrels per day for each of the current OPEC members over the recent years, quarters and months, as the column headings indicate…for all their official production measurements, OPEC uses an average of estimates from six “secondary sources”, namely the International Energy Agency (IEA), the oil-pricing agencies Platts and Argus, the U.S. Energy Information Administration (EIA), the oil consultancy Cambridge Energy Research Associates (CERA) and the industry newsletter Petroleum Intelligence Weekly, as an impartial adjudicator as to whether their output quotas and production cuts are being met, to thus resolve any potential disputes that could arise if each member reported their own figures…
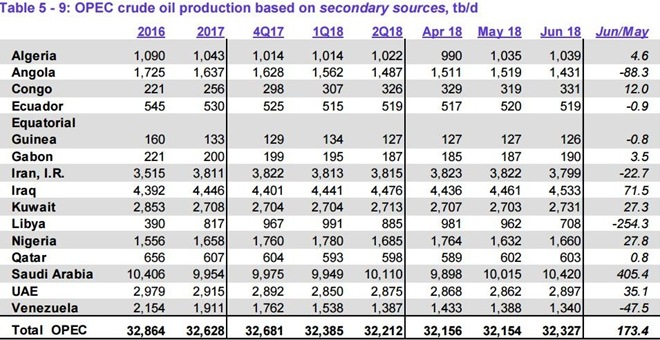
As we can see on this table of official oil production data, OPEC’s oil output increased by 173,400 barrels per day in May to 32,327,000 barrels per day, from their May production total of 32,154,000 barrels per day….that May figure was originally reported as 31,869,000 barrels per day before the addition of new member Congo, so the May output of the other OPEC members was therefore revised 34,000 barrels per day lower with this report (for your reference, here is the table of the official May OPEC output figures as reported a month ago, before this month’s revisions)…as you can tell from the far right column above, an increase of 405,400 barrels per day in the output from Saudi Arabia was main reason that the cartel’s output rose, as that increase more than offset the decrease of 254,300 barrels per day in Libyan output, the decrease of 88,300 barrels per day in Angolan output, and the decrease of 47,500 barrels per day in Venezuelan output…with an original output quota set at 10,060,000 barrels per day for the Saudis, their output is now well above their allocation, but with OPEC output excluding the Congo at 31,996,000 barrels per day, OPEC’s total oil output is still 734,000 barrels per day below the 32,730,000 barrels per day revised quota they agreed to at their November 2017 meeting, mostly on the big drop in Venezuelan output…
The next graphic we’ll include shows us both OPEC and world monthly oil production on the same graph, over the period from July 2016 to June 2018, and it comes from the page numbered 62 (pdf page 72) of the July OPEC Monthly Oil Market Report…on this graph, the cerulean blue bars represent OPEC oil production in millions of barrels per day as shown on the left scale, while the purple graph represents global oil production in millions of barrels per day, with the metrics for global output shown on the right scale…

OPEC’s preliminary data indicates that total global oil production rose by a rounded 600,000 barrels per day to 98.01 million barrels per day in June, apparently after May’s global output total was revised down by 450,000 barrels per day from the 97.86 million barrels per day global oil output that was reported a month ago, as non-OPEC oil production rose by 430,000 barrels per day in June after that revision….global oil output for June was also 1.74 million barrels per day, or 1.5% higher than the 96.59 million barrels of oil per day that were being produced globally in June a year ago (see the July 2017 OPEC report online (pdf) for the year ago details)…after the downward revision to global output, OPEC’s June oil production of 32,327,000 barrels per day represented 33.0% of what was produced globally during the month, up from the 32.6% share reported for May, with the addition of Congo’s output also contributing to OPEC’s share increase…OPEC’s June 2017 production was at 32,611,000 barrels per day, which means that the 13 OPEC members who were part of OPEC last year, excluding new members Congo and Equatorial Guinea, are still producing 741,000 fewer barrels per day of oil than they were producing a year ago, during the sixth month that their production quotas were in effect, with the 598,000 barrel per day decrease in output from Venezuela from that time largely responsible for their output drop…
Despite the 600,000 barrel per day increase in global oil output in June, the downward revisions to May output meant that we again saw a small deficit in the amount of oil being produced globally during the month, as this next table from the OPEC report will show us…
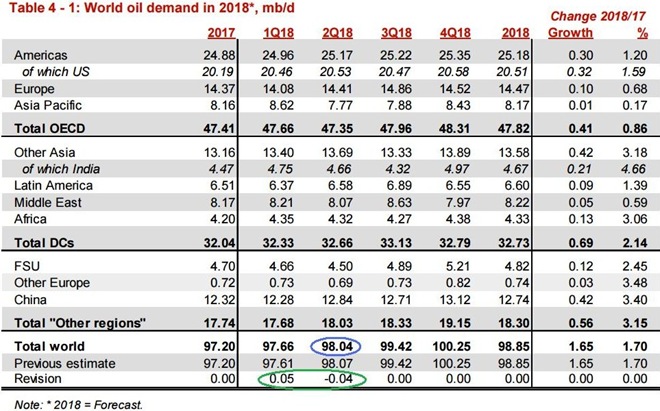
The table above comes from page 32 of the July OPEC Monthly Oil Market Report (pdf page 42), and it shows regional and total oil demand in millions of barrels per day for 2017 in the first column, and OPEC’s estimate of oil demand by region and globally quarterly over 2018 over the rest of the table…on the “Total world” line of the third column, we’ve circled in blue the figure that’s relevant for June, which is their revised estimate of global oil demand during the second quarter of 2018…
OPEC’s estimate is that during the 2nd quarter of this year, all oil consuming regions of the globe have been using 98.04 million barrels of oil per day, which is a downward revision of a rounded 0.04 million barrels of oil per day from their prior estimate for the 2nd quarter, as we’ve circled in green….meanwhile, as OPEC showed us in the oil supply section of this report and the summary supply graph above, the world’s oil producers were producing 98.01 million barrels per day during June, which means that there was a small shortfall of around 30,000 barrels per day in global oil production vis-a vis the demand estimated for during the month…
At the same time that 2nd quarter global demand was being revised a rounded 40,000 barrels per day lower, May’s global output total was revised down by 450,000 barrels per day to 97,410,000 barrels per day, so that means that the shortfall for May now works out to 630,000 barrels per day, revised from the 220,000 barrel per day shortfall we had figured on a month ago…the 2nd quarter revision to global demand also means that the global shortfall for April would be revised from the 480,000 barrels per day that we figured last month to 440,000 barrels per day…
However, as is also circled in green above, while global oil demand figures for the second quarter were revised lower, global oil demand figures for the first quarter of 2018 were revised 50,000 barrels per day higher, which means that our previously recomputed oil surplus for the first quarter of 2018 will have to be recomputed again…based on the revisions of a month ago, we had figured a global oil surplus of 180,000 barrels per day for March, a surplus of 360,000 barrels per day for February, and a surplus of 200,000 barrels per day for January…each of those surplus figures thus have to be revised lower based on revised higher demand, so hence our new figures will show a surplus of 130,000 barrels per day for March, a surplus of 310,000 barrels per day for February, and a surplus of 150,000 barrels per day for January…totaling it all up, that means that for the first six months of 2018, global oil demand exceeded production by 16,270,000 barrels, a relatively small oil shortfall that is the equivalent of roughly four hours of global oil production at the June rate…
This Week’s Rig Count
US drilling activity increased for the second time in five weeks, but for 13th time in the past 16 weeks during the week ending July 13th, as the steady increase in drilling for oil we saw with higher oil prices the first half of this year has stalled over the past month…Baker Hughes reported that the total count of active rotary rigs running in the US increased by 2 rigs to 1054 rigs over the week ending on Friday, which was 102 more rigs than the 952 rigs that were in use as of the July 14th report of 2017, but was down from the recent high of 1929 drilling rigs that were deployed on November 21st of 2014, the week before OPEC began their attempt to flood the global oil market…
The count of rigs drilling for oil was unchanged at 863 rigs this week, which was 98 more oil rigs than were running a year ago, while it was still well below the recent high of 1609 rigs that were drilling for oil on October 10, 2014…at the same time, the number of drilling rigs targeting natural gas formations increased by 2 rigs to 189 rigs this week, which was also up by 2 from the 182 natural gas rigs that were drilling a year ago, but way down from the modern high of 1,606 natural gas rigs that were deployed on August 29th, 2008…in addition, there continues to be two rigs drilling this week that are considered to be “miscellaneous”, in contrast to no such “miscellaneous” rigs in use a year ago….
With a second platform starting operations off the coast of Texas, drilling activity in the Gulf of Mexico increased by 1 rig to 19 rigs this week, which was still 2 fewer than the 21 platforms that were deployed in the Gulf of Mexico a year ago…however, the drilling platform that had been deployed offshore from Alaska was shut down this week, so the total US offshore count remains at 19 rigs, down by 2 rigs from the total 21 offshore rigs that were drilling a year ago…however, there was also a platform that started drilling on an inland body of water in southern Louisiana this week, so there are now 5 such “inland waters” rigs operating, up from 3 on inland waters a year ago…
The count of active horizontal drilling rigs was unchanged a 930 horizontal rigs this week, which was still 126 more horizontal rigs than the 804 horizontal rigs that were in use in the US on July 14th of last year, but down from the record of 1372 horizontal rigs that were deployed on November 21st of 2014…meanwhile, the directional rig count increased by 1 rig to 68 directional rigs this week, which was still down from the 72 directional rigs that were in use during the same week of last year…in addition, the vertical rig count increased by 1 rig to 56 vertical rigs this week, which was still down from the 76 vertical rigs that were operating on July 14th of 2017…
The details on this week’s changes in drilling activity by state and by shale basin are included in our screenshot below of that part of the rig count summary pdf from Baker Hughes that shows those changes…the first table below shows weekly and year over year rig count changes for the major producing states, and the second table shows the weekly and year over year rig count changes for the major US geological oil and gas basins…in both tables, the first column shows the active rig count as of July 13th, the second column shows the change in the number of working rigs between last week’s count (July 6th) and this week’s (July 13th) count, the third column shows last week’s July 6th active rig count, the 4th column shows the change between the number of rigs running on Friday and those of the equivalent weekend report of a year ago, and the 5th column shows the number of rigs that were drilling at the end of that reporting week a year ago, which in this week’s case was on Friday the 14th of July, 2017…
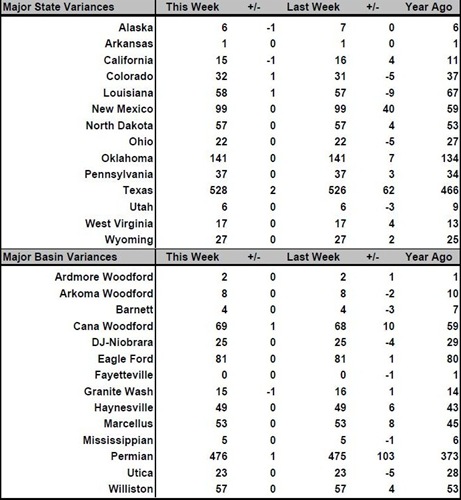
As you can see, there was not much variation in the rig counts across the states or the primary basins from a week ago…all the major basin changes seen above were oil rigs, as the two rig increase in natural gas drilling took place in basins not tracked separately by Baker Hughes, or more than likely would have been conventional rig start ups, as the rig on the inland waters platform likely was; as you can see, the major natural gas basins, including the Marcellus and the Utica, saw no change…
Five Well Permits Issued in Ohio’s Utica – Five new permits for horizontal wells were issued in the Utica shale region of eastern Ohio last week, according to the Ohio Department of Natural Resources. All five permits were secured by Oklahoma City-based Ascent Resources Utica LLC, which recently announced a deal to acquire assets and properties of Hess Corp., CNX Resources, Utica Minerals Development, and another unnamed party, totaling $1.5 billion.Ascent secured three permits to drill wells in Belmont County and two in Harrison County, according to ODNR.The number of rigs operating in the Utica shale for the week ended July 7 stood at 18, one less than the previous week.As of July 7, ODNR has issued 2,843 horizontal well permits in the Utica. Of that number, 2,371 are drilled and 1,913 are in production.There were no permits issued for northern tier of the Utica in Ohio, which encompasses Mahoning, Trumbull and Columbiana counties.However, Houston-based Hilcorp Energy Co. was awarded permits to drill four vertical wells in nearby Lawrence County and two vertical wells in Mercer County in western Pennsylvania, according to the Pennsylvania Department of Environmental Protection. Hilcorp received permits to drill two conventional wells in Mahoning Township and two others in Pulaski Township in Lawrence County, while it received two permits to drill conventional wells in Jefferson and Shenango townships in Mercer County.
Utica Shale well activity as of July 7 –
- DRILLED: 295 (300 as of June 23)
- DRILLING: 163 (162)
- PERMITTED: 472 (472)
- PRODUCING: 1,913 (1,905)
- TOTAL: 2,843 (2,839)
Five horizontal permits were issued during the week that ended July 7, and 18 rigs were operating in the Utica Shale.
Utica Shale Natural Gas Production Hit New Record in First Quarter – Ohio’s unconventional natural gas production continued its upward climb in the first quarter, jumping more than 40% year/year (y/y) and setting a new state record at 531.3 Bcf.That’s up from 371.9 Bcf in 1Q2017 and an increase from the previous record of 503 Bcf in 4Q2017, according to data released Wednesday by the Ohio Department of Natural Resources (ODNR). Oil production meanwhile continued to seesaw. It declined by about 4% y/y, dropping to 3.9 million bbl in the first quarter. Oil production has fluctuated over the last several quarters, reflecting a broad shift to dry gas production that occured about two years ago across much of the Appalachian Basin when oil prices remained low. While oil volumes slowly crept back up from lows for sequential increases last year, for example, they fell from roughly 18 million bbl in 2016 to 16.4 million bbl in 2017. First quarter oil production was also down slightly from 4Q2017, when unconventional producers reported 4.2 million bbl. Ohio law does not require separate reporting of natural gas liquids (NGL) or condensate. Those totals are included in natural gas volumes. Some Appalachian operators in the region have, however, reported more NGL development since late last year as prices have improved. ODNR’s first quarter report listed 1,949 horizontal shale wells, 1,909 of which reported oil and gas production during the period. The data consists almost entirely of Utica Shale production. The average amount of oil produced by each well was 2,066 barrels, while the average amount of natural gas produced was 278.5 MMcf over 86 average days in production. To date, the state has issued 2,843 horizontal Utica permits and 2,371 of those have been drilled. That’s up compared to the 2,518 permits issued at roughly the same time last year and the 2,014 that were drilled at that time.
Ohio shale production spikes, and what that means for the state – Output spiked at Ohio shale wells in the first three months of the year, state data shows.The Ohio Department of Natural Resources indicates that 1,949 shale wells produced 531.3 billion cubic feet of natural gas in the first quarter, a 43 percent uptick from the 371.9 billion cubic feet they produced in the first quarter of 2017. Oil dropped just a bit in that time, with shale wells in the state producing 3.94 million barrels, down almost 4 percent from 4.09 million barrels a year ago. Each well produced an average of 2,066 barrels of oil and 278.4 million cubic feet of natural gas.The wells producing the most gas were in Monroe, Belmont and Jefferson counties, while the top wells for oil were in Guernsey and Harrison counties. Eclipse Resources and Ascent Resources Utica Holdings LLC held most of the top wells in both categories. “Well, the trend is our friend, and the Utica continues to impress as natural gas play,” Dan Alfaro, Energy in Depth spokesman, told me. “Production levels are continuing to increase as market value does, and the necessary infrastructure continues to be built out. … There is a lot of promise for future investments from other energy-intensive industries like steel, and the petrochemical industry.” This comes at a time when energy advocates promote the Appalachian energy industry in Pennsylvania, Ohio and West Virginia in a bid to elevate it to a global energy hub. “Any significant recession in the country has always been preceded by a huge spike in gas prices,” Karen Alderman Harbert, CEO of the U.S. Chamber of Commerce’s Global Energy Institute, told me. But in the Buckeye State, years of investments in Utica shale assets since gas prices spiked a decade ago are making energy costs cheaper and more stable for both consumers and businesses, she said.
Natural Gas Pipeline Designed to Meet Ohio Demand Gets Favorable EA from FERC – FERC has issued a favorable environmental assessment (EA) for RH energytrans LLC’s Risberg Line Project, which would move 55,000 Dth/d of natural gas from northwest Pennsylvania to northeast Ohio to meet increasing demand.Federal Energy Regulatory Commission staff concluded “that approval of the proposed project, with appropriate mitigating measures, would not constitute a major federal action significantly affecting the quality of the natural and human environment.” The U.S. Army Corps of Engineers and the Pennsylvania Fish and Boat Commission were the cooperating agencies in preparing the EA. Now that it’s completed, FERC’s environmental review schedule puts the project on track for a federal authorization deadline of Sept. 27. The Commission is accepting public comment on the EA until July 30 [CP18-6-000].The project would take gas from an interconnect with Tennessee Gas Pipeline in Crawford County, PA, to help meet peak day supply deficits and new industrial demand in Ashtabula County, OH. Utility Dominion Energy Ohio entered into a binding precedent agreement as the foundation shipper for 40,000 Dth/d. At the time RH energytrans filed for a certificate of public convenience and necessity late last year to construct the 60-mile pipeline, North Atlantic Iron Corp. expressed interest in contracting for 15,000 Dth/d of firm transportation. The company plans to build a pig iron plant in Ashtabula on Lake Erie.
DOE focuses on Appalachia in its updated 2018 NGL primer – The U.S. Department of Energy (DOE) has published the 2018 Natural Gas Liquids (NGL) primer, highlighting the resource’s potential and focusing on the Appalachian region. The publication is an update of the 2017 version, reporting larger than previously estimated projections for ethane production from the Marcellus and Utica shale plays. According to the updated information, the Appalachian region has experienced near-exponential growth in natural gas production which is expected to increase for decades. EIA projects that natural gas production in the East region – where the Appalachian Basin is the principal contributor – will quadruple from 2013 to 2050. “Industry has made significant investments in natural gas and NGL infrastructure to support the boom in production in Appalachia this decade,” the primer says. “New investments to take advantage of the NGL resources in the region have been identified by industry, and forecasts for production over the decades to come highlight the opportunity for additional investments across the NGL supply chain.” The 2018 primer includes new data from the U.S. Energy Information Administration’s (EIA) 2018 Annual Energy Outlook, as well as forecasts from a recent EIA Short-term Energy Outlook. This includes updated information on infrastructure developments in the Appalachian region and a new section identifying research and development opportunities related to natural gas and NGL production, conversion and storage. Natural gas produced in Appalachia not only contains NGL, but also ethane and propane. The region has significant NGL resources that are projected to be economically recoverable over the next three decades. Appalachian NGL production is projected to increase more than 700 percent between 2013 and 2023. Significant industry investments in natural gas and NGL infrastructure will support the boom in Appalachian production in the coming decades. NGL storage and midstream infrastructure are of particular importance to the region because produced volumes do not align with the high seasonal variability in demand and often exceed pipeline takeaway capacity, which presents further investment opportunities using ethane as a feedstock.
Environmental group pushes for stepped up air pollution rules for gas industry – Environmentalists want the Wolf Administration to roll out tighter controls on methane pollution from existing wells and compressor stations to go along with those on new ones.The state Department of Environmental Protection in June announced stepped-up requirements for new wells and compressor stations, facilities that help keep the gas moving through pipelines.The additional move to add already-producing wells and operating compressor stations would be even more important as “protections are being rolled back at the federal level,” said Andrew Williams, director of regulatory and legislative affairs for the Environmental Defense Action Fund.In announcing the new limits last month, Gov. Tom Wolf said that as Pennsylvania is second to only Texas in natural gas production, the state is “uniquely positioned to be a national leader in addressing climate change while supporting and ensuring responsible energy development.”Neil Shader, a DEP spokesman, said the agency is “in the early stages” of developing new regulations for methane emissions from existing wells and compressor stations.Methane has become a hot-button because it’s considered “a potent greenhouse gas, with more than 80 times the climate warming impact of carbon dioxide over a 20-year timespan,” according to Williams’ group.The rules put in place in June came over the objections of the natural gas industry.“Methane does not appear to be increasing at levels that make specific limits and controls necessary,” the Marcellus Shale Coalition said in comments submitted to DEP.The group also complained that the limits set by the state appear “arbitrary.” In a statement provided Friday, the coalition’s president David Spigelmyer said the group would not welcome additional rules to limit methane pollution.
Sunoco’s stand-in ME2 line leaked gasoline at Darby Creek, pipeline map indicates – A 12-inch pipeline that Sunoco plans to use to carry natural gas liquids along unfinished parts of the Mariner East route appears to be the same line that recently leaked gasoline into a creek near Philadelphia International Airport, according to government mapping data and Sunoco’s own statements. Sunoco wants to repurpose part of the pipeline that runs from Point Breeze near Philadelphia to the Montello terminal at Sinking Spring, near Reading in Berks County. The line would carry propane, ethane and butane while Mariner East 2, the first of the new pipelines, is being completed. The company said the stretch to be converted runs between Wallace and Middletown townships, a distance of about 25 miles.The company has informed state and federal regulators that it plans to convert the existing pipeline from carrying petroleum products such as gasoline, and reverse the direction of flow, so that it can begin supplying customers with natural gas liquids before completion of the long-delayed Mariner East 2.Conversion of the 12-inch pipeline, which, like the repurposed Mariner East 1, was built in the 1930s, has renewed claims by opponents of the Mariner East project that public safety is at risk, this time by the use of a line that has leaked at least three times in its history, according to federal data as well as state and local officials.The latest leak was first reported in mid-June at Darby Creek in Delaware County.
Two protesters arrested at pipeline construction site in Middletown — Two demonstrators – part of a group that dubbed themselves the “Mama Bear Brigade” including mothers and grandmothers – were arrested Tuesday when they sat down and blocked construction of Sunoco’s Mariner East 2 pipeline on Pennell Road.Accompanied by six supporters, the area-residents staged a sit-in protest of the pipeline construction.Arrested for trespassing, a summary offense, by Pennsylvania State Police, were Middletown residents Fran Sheldon and Meaghan Flynn. They were soon released by police. Attorney and former state Senate candidate Tanner Rouse will represent Sheldon and Flynn.The “Mama Bear Brigade,” including Middletown Township residents and Glenwood Elementary School parents, staged the protest and are women concerned about their children and grandchildren in the blast zone of the pipeline. “The mothers and grandmothers on-site had written letters, signed petitions, testified, and met with the governor and now they are feeling that there is no other choice,” Hughes said. “They are taking children’s safety into their own hands and trying to stop construction.”
Rover Pipeline Should Be Fully Responsible for Stream Impacts – The Rover Pipeline in northern West Virginia has a long history of negligence – 18 water quality violations and two cease and desist orders since April 2017. You may have read in the news that WVDEP has issued Rover a penalty of $430,000 for 14 of those violations. The proposed agreement to that penalty is now open for public comment.While WV Rivers commends WVDEP for holding Rover accountable for their water quality violations, we request the penalty be adjusted in a way that fully considers Rover’s repeated negligence and disrespect of environmental law, and strongly deters other pipeline companies from following suit. View our letter to WVDEP here. Over the last year, Rover’s erosion impacted 35 streams and created unlawful water quality conditions approximately 92 times. $430,000 doesn’t cover the costs to reclaim the damage they’ve inflicted on West Virginia’s streams and the local residents who depend on them. Nor does it match in scale a penalty for a project with a construction budget of $4.2 billion. That’s why we are requesting WVDEP reconsider Rover’s penalties and deny them any future projects.
Landslide caused West Virginia pipeline explosion, Columbia Gas reports – Columbia Gas Transmission has told federal pipeline regulators that a landslide was the apparent cause of the rupture and explosion of a new natural gas pipeline in Marshall County, W.Va., last month. The site of the break was at the bottom of a steep hill on Nixon Ridge, just south of Moundsville. The Pipeline and Hazardous Materials Safety Administration incident report, provided to the Post-Gazette by environmental activist organization Climate Investigations Center, indicates that officials inside Columbia’s control room got an alert about low pressure on the line at 4:16 a.m. on June 7 and sent someone to investigate. Marshall County 911 reported getting calls just a few minutes later reporting an explosion. At 4:37 a.m., the emergency agency called Columbia to report the news. (26 pp filing embedded) The carbon steel pipe, manufactured by Durabond in 2015, was not operating above its maximum pressure at the time of the incident. When it burst, it spewed $437,250 worth of natural gas. No one was injured. TransCanada, which owns the Columbia Gas Transmission system, has been working on repairing the pipeline, pushing back the expected in-service date from early July to the middle of the month.“The weather in the region has continued to create challenging conditions during the remediation process,” the company said on a website it uses to communicate with customers.Lindsey Fought, a spokesperson with TransCanada, said the company is continuing to cooperate with federal authorities in the investigation.She confirmed that the federal pipeline agency and TransCanada’s “internal findings point to land subsidence as the cause of the rupture.”It may take months or years for federal regulators to complete their investigation of the Marshall County incident. When a natural gas liquids pipeline burst into flames in Follansbee, W.Va., in 2015, it took PHMSA more than a year to close the case, declaring that the root cause was subsidence. A final report for the Spectra Energy pipeline that ruptured in Salem Township, Westmoreland County in 2016 is still not posted on the federal site.
Explosion triggers safety notice for TransCanada –Federal regulators yesterday said that land movement may have triggered a natural gas pipeline explosion at a remote West Virginia site last month and thatsimilar conditions exist at a half dozen other spots along the line.The Pipeline and Hazardous Materials Safety Administration warned TransCanada yesterday that it intends to impose new safety-related requirements on a portion of the Leach XPress pipeline in response to the risk of land subsidence, which might have been responsible for an explosion last month that blew an 83-foot section of pipe into the air, released 165 million cubic feet (mmcf) of natural gas and triggered a fireball that burned for several hours.The incident took place in a remote area and no injuries or damage to private property was reported (Greenwire, June 7).PHMSA’s notice of proposed safety order, issued to TransCanada Corp. subsidiary Columbia Gas Transmission LLC, points to geological factors in the incident and could pose a challenge for other projects proposed for construction in similar steep, unstable Appalachian terrain.The pipeline that failed was constructed last year and went into service early this year, raising questions around why it failed so quickly and dramatically.”The preliminary investigation suggests that the failure was the result of land subsidence causing stress on a girth weld,” PHMSA said in the notice. An initial report on the incident filed by TransCanada and released earlier this week notes the cause of the failure as a landslide not related to heavy rains or floods. “Since the failure, TransCanada has identified six other points along the pipeline that, based on their geotechnical flyover, are areas of concern to the existence of large spoil piles, steep slopes, or indications of slips,” it said.
Part of TransCanada Leach gas pipe back in service after W. Va. blast (Reuters) – TransCanada Corp’s Columbia Gas Transmission (TCO) unit said on Thursday it returned to service a section of the Leach Xpress natural gas pipeline downstream from a pipe blast in West Virginia in early June.Columbia said in a notice to customers that the Stagecoach-Leach Xpress meter in southeast Ohio has returned to service.The Stagecoach meter, the large connection at which different pipelines meet, in Monroe County on the Ohio-West Virginia border attaches to EQT Midstream Partners LP’s Strike Force South gathering fields in Monroe and Belmont counties in Ohio.Columbia Gas said it was still working on the site of the blast and expected the pipe to return to service in mid July. The shutdown of Leach Xpress forced producers using the line to find other pipes to ship gas out of the Marcellus and Utica shale regions of Pennsylvania, West Virginia and Ohio.Alternative pipelines include ETP’s Rover, Tallgrass Energy LP’s Rockies Express (REX), EQT Midstream Partners LP’s Equitrans and Enbridge’s Tetco, according to analysts at S&P Global Platts.Columbia Gas, which declared a force majeure after the blast, said the damaged section of pipe could affect movement of about 1.3 billion cubic feet per day (bcfd). One billion cubic feet of gas can fuel about 5 million U.S. homes for a day.Energy analysts said overall output in the Appalachian region was little changed by the blast as producers, like Range Resources Corp and Southwestern Energy Co, found other pipes to ship their gas.Appalachian output rose from 27.5 bcfd before the June 7 blast to as high as 28.1 bcfd over the weekend, according to Thomson Reuters data.The 1.5-bcfd Leach Xpress in West Virginia and Ohio, which entered full service at the start of 2018, transports Marcellus and Utica shale gas to consumers in the U.S. Midwest and Gulf Coast. The 12,000-mile (19,312-km) Columbia pipeline system, which TransCanada acquired in 2016, serves millions of customers from New York to the Gulf of Mexico.
TransCanada says blast-damaged Leach natgas pipe back in service on July 15 – (Reuters) – TransCanada Corp’s Columbia Gas Transmission expects the section of the Leach Xpress natural gas pipeline damaged in a blast in West Virginia in early June to return to service on July 15. Its return, however, requires approval from federal pipeline safety regulators, Columbia said on Thursday in a notice to customers using the pipeline. The U.S. Pipeline and Hazardous Materials Safety Administration (PHMSA) this week gave Columbia 30 days to respond to a list of corrective actions the agency proposed to improve the safety of the Leach pipe. Since the June 7 blast, Columbia has identified six other points along the pipeline that PHMSA said are “areas of concern” based on soil conditions and steep slopes or indications of slips. PHMSA has not identified the cause of the blast but said preliminary investigation suggests the failure was the result of ground movement that caused stress on a weld. That blast resulted in the ejection of about 83 feet (25.3 meters) of 36-inch (91-centimeter) pipe from the ditch and the loss of 165 million cubic feet of natural gas, PHMSA said. The explosion was in a remote rural area and caused no injuries or evacuations. The Leach shutdown forced producers using the line to find other pipes to ship gas out of the Marcellus and Utica shale regions of Pennsylvania, West Virginia and Ohio. Alternative pipelines include Dominion Energy Inc’s transmission system, Energy Transfer Partners LP’s Rover, Tallgrass Energy LP’s Rockies Express, Enbridge Inc’sTexas Eastern Transmission and Kinder Morgan Inc’s Tennessee Gas, according to analysts at S&P Global Platts. Columbia said the blast could affect movement of about 1.3 billion cubic feet per day. One billion cubic feet of gas can fuel about five million U.S. homes for a day. Overall output in the Appalachian region, however, was little changed as producers, like Range Resources Corp and Southwestern Energy Co, found other pipes to ship their gas.
Factbox: Leach XPress resumes partial service, full capacity by July 15 – Columbia Gas Transmission on Thursday said it was immediately resuming partial service on its Leach XPress segment, with full service scheduled to return by Sunday, July 15. The news comes after an explosion in Marshall County, West Virginia, suspended operations on June 7, leaving the pipeline under force majeure over the past 35 days.
- Early Thursday, Columbia said the upstream Stagecoach meter had returned to service effective for intraday cycle 1 on Gas Day July 12.
- Repairs on Leach XPress, upstream of Stagecoach, continue with a resumption of operations at the Eureka, Gibraltar and Majorsville meters expected by July 15.
- Wednesday’s evening-cycle nominations for Gas Day July 12 showed flow volumes at the Stagecoach meter at zero, but are subject to revision during subsequent intraday cycles on Thursday, S&P Global Platts Analytics data shows.
- Upstream receipts at Stagecoach are likely to return to levels near the pre-explosion average of 230 MMcf/d by later Thursday.
- Flows at Eureka, Gibraltar and Majorsville were at zero on Thursday, where they are expected to remain until the resumption of full capacity on the pipeline Sunday.
- Flows on Columbia’s mainline were estimated just below 2.6 Bcf/d Thursday. Mainline flows have averaged 2.6 Bcf/d, or about 1.1 Bcf/d below the pre-explosion average, since June 7
- Upstream production continues to be rerouted to Dominion Transmission, Rockies Express Pipeline, Rover Pipeline, Tennessee Gas Pipeline and Texas Eastern Transmission with flows still elevated Thursday. Since the June 7 incident, cumulative receipts on the dense network of alternate pipes are up by an average 1.3 Bcf/d.
- In spite of the force majeure on Leach XPress, Appalachian gas production has climbed about 3% since early June. Over the past seven days, total Northeast production has averaged nearly 28 Bcf/d, compared to a 27.2 Bcf/d average in the week prior to the incident.
Alert: West Virginia’s Pipeline Explosion Caused by a Landslide on Steep Terrain. Virginia’s Mountain Valley Pipeline, Being Built by a Serial Landslide Perpetrator, is Next. –On May 28 and June 4, we published two stories about a lawsuit filed in federal court in Richmond that pits Dominion Energy against Precision Pipeline, LLC, the Wisconsin company that is currently building the Mountain Valley Pipeline. The stories – which have garnered more than 37,000 readers – exposed previously unpublished expert reports – found here and here – that demonstrated Precisions Pipeline’s sheer incompetence in building a 30-inch diameter 55-mile long pipeline for Dominion in West Virginia and Pennsylvania.As we noted, the expert reports revealed that there were more than 50 landslides after the Precision Pipeline project was completed: “Yes, >50 landslides.In a 55-mile pipeline projectWith a 30-inch diameter.In non-mountainous terrain….”That’s an average of one landslide… every mile.The proposed Mountain Valley Pipeline is 300 miles long. Do the math.” The landslide risks at issue in the Dominion/Precision Pipeline lawsuit are terrifying because the Mountain Valley and Atlantic Coast Pipelines are proposed to be built through some of the steepest terrain in Virginia, with slopes as steep as 78% in places. This mountainous terrain is particularly susceptible to landslides when fill material generated by construction is deposited on slopes after the pipelines are buried. The reasons are discussed in this excellent short video, “The Truth is in the Proof.”One week after our stories were published, a brand new TransCanada/Columbia Gas pipeline exploded in West Virginia, generating a fireball that could be seen as far away as Pennsylvania. When the pipeline went on line in January 2018, company officials described it as “best in class” even though “whistleblowers at numerous pipeline companies have raised red flags about the impacts of rushed construction.”The West Virginia explosion occurred on a slope known as Nixon’s Ridge. Almost immediately after it occurred, stories started to circulate that workers had observed shifting soil during construction but were told to “just keep working” and “get the pipe in the ground.” Now the bombshell news just broke: “Columbia Gas Transmission has told federal pipeline regulators that a landslide was the apparent cause of the rupture and explosion of a new natural gas pipeline in Marshall County, W.Va., last month.” And it turns out it’s not the first time in recent years that a pipeline exploded in West Virginia due to a landslide: a similar explosion occurred in 2015 in a 20-inch pipeline.
Mountain Valley Pipeline cited for environmental violations (AP) – Regulators in Virginia are citing the Mountain Valley Pipeline project for environmental violations they say include the improper release of sediment into waterways. The Department of Environmental Quality announced Tuesday that it issued a notice of violation to the natural gas pipeline. Other alleged violations include failing to follow approved erosion and sediment control plans. The notice of violation requires pipeline representatives to discuss how to fix the problems and prevent future violations. It could result in civil fines. Pipeline spokeswoman Natalie Cox says the issues identified have either been restored or are being fixed. West Virginia regulators have also previously cited the project for similar issues. Tuesday’s announcement comes about a week after Mountain Valley agreed to temporarily suspend pipeline installation work in Virginia to improve erosion and sediment controls. The department has since approved work to restart in some areas.
VIRGINIA DEQ Takes Enforcement Action Against Mountain Valley Pipeline – The Virginia Department of Environmental Quality (DEQ) has issued a Notice of Violation (NOV) to Mountain Valley Pipeline, LLC (MVP) for alleged violations of the Virginia Stormwater Management Act and Regulations, the Virginia Erosion and Sediment Control Law and Regulations, the Virginia Water Protection Permit Program and Regulations, and Clean Water Act Section 401 Water Quality Certification No. 17-001 at locations where land disturbing activity is occurring along the MVP pipeline project. The alleged violations include failure to take corrective actions within required timeframes, failure to install (and improperly installed) best management practices in accordance with approved erosion and sediment control plans, release of sediment off the right-of-way, and sediment deposited in surface waters. These issues are located in Craig, Franklin, Giles, Montgomery, Pittsylvania and/or Roanoke counties. The issuance of an NOV is the first step toward generating enforcement action by DEQ. The NOV requires MVP representatives to contact DEQ within 10 days to discuss how to remedy the situation and how they will prevent future violations. Enforcement actions are frequently resolved with payment of civil charges and required actions to correct the violations. “The Notice of Violation process is standard procedure for DEQ to formally and publicly announce violations and determine a path forward for resolution,” said DEQ Director David Paylor. “The specific results of the NOV will be developed over the coming weeks and once finalized, shared with the public. We are concerned about these alleged violations and we are holding MVP accountable. We expect MVP to abide by the highest environmental standards, and we plan to resolve these issues fully in order to protect Virginia’s water quality.”
Franklin County wants pipeline company to reimburse it for public safety costs — Franklin County plans to ask the Mountain Valley Pipeline to cover public safety costs it has incurred as a result of the project. The idea to bill the pipeline’s builders stemmed from a meeting between pipeline and county officials to discuss public safety. After concerns were raised that an influx of calls to law enforcement during construction would pose a financial burden to the county, a pipeline representative suggested such costs be passed on to them, according to multiple county officials in attendance. Supervisors Ronnie Thompson and Mike Carter, both opponents of the pipeline, attended the meeting. Thompson recalled being told the pipeline “was to never cost the municipality anything when it came down.” He took that to mean Franklin County can bill Mountain Valley for associated costs, and directed county staff to look into doing so. County Administrator Brent Robertson characterized comments made at the meeting as more of a conversation than a formal agreement. He said the county’s approach to billing Mountain Valley for such costs is still evolving. The “crux of the discussion,” Robertson said, will be whether officials consider the response from law enforcement to fall within the realm of everyday responsibilities or something extra.
Mountain Forest Becomes Classroom Camp in Pipeline Fight – As Miracle Ridge rises toward its peak on Jack Mountain, the remnants of a wire fence divide the mountain between lower slopes where cows once pastured and a high, narrow spine of virgin forest. The trees – mostly oak and hickory – aren’t as big as the massive sugar maples on the lower slopes, but they’re just as old, surviving hundreds of years on shallow, rocky soil in high winds. Loggers haven’t touched this forest, nor have non-native plants invaded what Virginia‘s Division of Natural Heritage has declared a conservation site of “very high significance.” Now, the mountain ridge is becoming a classroom camp in the escalating battle over the Atlantic Coast Pipeline, which would level the forest and more than 3,000 feet of ridgeline on its 600-mile path from the West Virginia shale fields to natural gas markets in southeastern Virginia and North Carolina. “We anticipate people camping right where the pipeline is proposed,” said Bill Limpert, whose 120-acre property includes the mountainside he began calling Miracle Ridge after he and his wife, Lynn, purchased it nine years ago.The Limperts have opened their land to an anti-pipeline encampment, beginning Friday and extending to Sept. 9, about a week before a seasonal window opens for tree cutting to resume on the pipeline route planned by Dominion Energy and its partners.They expect as many as 20 campers a day to visit their land near Bolar in Bath County near its boundary with Highland County in the Allegheny Mountains. The camp is organized by the Chesapeake Climate Action Network, an environmental organization that opposes the production of natural gas through hydraulic fracturing, or fracking, and the construction of pipelines through environmentally sensitive areas to transport the fossil fuel to markets.
One week after suspension, some work resumes on the Mountain Valley Pipeline – After coming to a brief halt, construction of the Mountain Valley Pipeline is resuming piecemeal along its approximately 100-mile route through the New River and Roanoke valleys. The Virginia Department of Environmental Quality, which said the temporary suspension began June 29 after Mountain Valley failed to control runoff from work sites, identified two segments this week where improvements by the company were sufficient for work to restart. One area is in the Jefferson National Forest, and the other is between Mount Tabor and Catawba roads in Montgomery County. Mountain Valley’s efforts to correct erosion and sediment control measures along a third segment, where the natural gas pipeline will pass under the Blue Ridge Parkway in Roanoke County, were deemed deficient. Work cannot resume there yet, DEQ said in a summary posted to its website. Environmental regulators plan to inspect other areas and provide online updates as more clearances are granted. DEQ spokesman Greg Bilyeu could not say Friday how many sites will be reviewed. Critics said the brevity of the suspension, and the scarcity of details provided by DEQ, call into question the agency’s commitment to addressing problems and concerns that reached a critical mass as work on the interstate pipeline ramped up in May and June. “We believe that this was all a public relations stunt,”
Court: Louisiana oil pipeline construction can continue (AP) – Construction of a crude oil pipeline through Louisiana’s environmentally fragile Atchafalaya Basin swamp can continue under a federal appeals court decision handed down Friday. A divided panel of the 5th U.S. Circuit Court of Appeals vacated a lower court’s preliminary injunction blocking construction of the Bayou Bridge Pipeline. The 2-1 decision was a victory for Bayou Bridge Pipeline LLC, whose lawyers had urged the panel to throw out U.S. District Judge Shelly Dick’s injunction in April. Dick issued a preliminary injunction in February stopping pipeline construction in the Atchafalaya Basin swamp until a lawsuit by project opponents is resolved. But her injunction was suspended by a 5th Circuit panel in March, so construction continued even before Friday’s ruling. The company recently told the court that it expects to complete construction by October. The decision comes in a lawsuit by environmental groups, including Atchafalaya Basinkeeper, Waterkeeper Alliance, The Gulf Restoration Network and the Sierra Club. They sued Bayou Bridge Pipeline LLC and the U.S. Army Corps of Engineers. The lawsuit says the Corps violated the Clean Water Act and other environmental laws when it approved a permit for the project.
Still No Evacuation Plan for Vulnerable Residents at End of Louisiana’s Bayou Bridge Pipeline — Sharon Lavigne and Geraldine Mayho took me to meet some of the most vulnerable members of their community, handicapped residents of St. James, Louisiana, who live near a terminal where the Bayou Bridge pipeline will end. “These people have no way of getting out if there is a spill or explosion,” Lavigne told me. She explained with only one road in and out of the area, if the pipeline fails or an industrial accident occurs, “we are all trapped back here.” St. James is a predominantly low-income, African-American town of less than 1,000. It is located in the middle of a highly industrialized stretch of land along the Mississippi River, between Baton Rouge and New Orleans, known as Cancer Alley. The town is part of St. James Parish’s 5th District, an area that has transformed from mostly rural to industrial over the last decade.Numerous industrial projects including the Bayou Bridge pipeline currently are being built here.The Louisiana governor’s office recently announced the Taiwan- based Formosa Petrochemical Corp. purchased a 2,400-acre site along the west bank of the Mississippi River near the Sunshine Bridge, at the district’s edge. The company plans to build a $9.4 billion chemical manufacturing complex that it is branding as “the Sunshine Project.” But Lavigne and Mayho see it as one more nail in their coffins because they don’t believe a chemical manufacturing complex can operate so closely to their homes without adding to the air pollution their community already endures. The new industrial facilities and infrastructure like the Bayou Bridge pipeline will join a large number of oil storage tanks that were built close to many homes on St. James’ Burton Lane, where I visited and shot portraits of some of the residents with restricted mobility.
Former Putin adviser has secret investment in US energy firm praised by Trump – Vladimir Putin’s former chief of staff has a secret investment in an American energy company hailed by Donald Trump as creating jobs for American workers.Alexander Voloshin – who served as Boris Yeltsin’s chief of staff before working for Putin between 2000 and 2003 – has an undisclosed stake in American Ethane, a Houston-based firm that recently signed a multibillion dollar export deal with China. Voloshin is part of a consortium of Russian investors in American Ethane that at one point included the oligarch and billionaire Roman Abramovich.The revelation comes ahead of Trump’s four-day visit to the UK, beginning on Thursday, and his summit on 16 July with President Putin in Helsinki. In November 2017, Trump presided over a series of trade agreements with his Chinese counterpart, Xi Jinping. One of the biggest was a $26bn (£20bn) deal to supply liquid ethane to China, struck between privately owned American Ethane and a large Chinese conglomerate. Trump applauded and nodded vigorously as American Ethane’s CEO, John Houghtaling, signed a “historic” memorandum of understanding with his Chinese partner.The president was promoting “American prosperity and trade” in deals that would generate “thousands of American jobs”, the White House announced. In fact, the chief beneficiaries of the Trump-endorsed deal live and work in Moscow. One of them is Voloshin, who spent three years at Putin’s side, and headed his first presidential administration.
Differentials Aside, U.S. Onshore Could See 100 More Rigs Rising This Year, Says Raymond James – The U.S. rig count should continue to increase into the second half of this year, with up to 100 oil and gas rigs added, even with potential price differential issues in the No. 1 play, the Permian Basin, Raymond James & Associates Inc. said Monday.Analysts J. Marshall Adkins and Praveen Narra said they expect a nearly 100-rig count rise through the end of the December with “modest” growth continuing in 2019.The United States added five oil rigs in the onshore last week from a week before, bringing the domestic count to 1,052 from a year-ago tally of 952, according to Baker Hughes Inc. (BHI). For the oily onshore plays, Energent Group estimated the Permian count rose 0.2% week/week to 475 rigs, while the Eagle Ford Shale saw a 1.3% gain to 81 rigs and the Williston Basin, i.e. Bakken Shale, count climbed 5.6%.The average U.S. rig count for June 2018 was 1,056 — up 10 from the 1,046 counted in May, and up 125 from the 931 counted in June 2017, BHI said Monday.“Given the rig count outperformance in the first half of the year and continued growth in 2018, our average rig count comes in up about 22% this year at 1,070,” Adkins and Narra said.Following a “robust” exit rate in 2018 estimated at 1,160 rigs, the count should continue to rise, albeit more modestly, at around 14% in 2019 on “buffered support” from the Bakken and Eagle Ford shales.In 2020 and beyond, Raymond James analysts are forecasting “consistent multi-year growth” in the United States because of a tightening global market.Even with the negative press around widening Permian oil price differentials and lower Permian spot oil prices, he U.S. oilfield market is prime for continued growth in part because U.S. exploration and production (E&P) cash flows should be healthy in 2018, rising by 56% year/year and up again in 2019 by around 18%, which would support more spending, said Adkins and Narra. “Even if Permian oil price differentials widen to an irrational $25/bbl average over the next 18 months (as we are modeling), realized Permian spot prices would still be in-line with initial 2018 budgeting assumptions (in the low to mid-$50 range).”
CME, Cheniere to develop first U.S. LNG futures contract (Reuters) – CME Group Inc said on Tuesday it will develop the first physically deliverable U.S. liquefied natural gas futures contract as growing worldwide demand has made the United States a key LNG exporter. CME said the contract will take delivery at Cheniere Energy Inc’s Sabine Pass LNG export terminal in Louisiana. It could not say when it will launch the new product or provide details other than that it will trade on the CME’s New York Mercantile Exchange (NYMEX) like its Henry Hub natural gas futures. Overall world LNG consumption has risen to a record 39.0 billion cubic feet per day (bcfd) in 2017 from just 29.1 bcfd in 2010 and is expected to keep growing by about 3 percent a year through 2050, according to U.S. energy data. While LNG trade on exchanges like the CME is still small, experts believe volumes will increase rapidly in the near future as the United States becomes one of the world’s biggest LNG exporters. Total U.S. LNG export capacity is expected to rise to 10.1 bcfd of gas in 2020 from 3.8 bcfd now, making the country the third-biggest LNG exporter in the world by capacity in 2019. One billion cubic feet is enough to fuel about 5 million U.S. homes for a day. “We have spoken to the market and they have expressed a desire to have a physically delivered LNG contract that can help them manage price risks,” said Peter Keavey, global head of energy at CME. Pricing at Cheniere’s Sabine Pass is currently linked to the Henry Hub gas benchmark traded on CME’s NYMEX. Sabine Pass was the first terminal in the U.S. lower 48 states to produce and deliver super-cooled LNG for export to the world. Cheniere is the biggest buyer of gas in the United States, consuming over 3.1 bcfd, and is expected to increase purchases as more liquefaction trains at Sabine Pass and its Corpus Christi LNG export terminal enter service. The company’s current consumption represents almost 4 percent of total projected U.S. gas production of 81.3 bcfd in 2018. “With Cheniere behind the CME futures contract…the odds would favor the CME contract especially if Cheniere immediately starts to sell its LNG on a Sabine Pass contract basis,”
LNG Awakening Part 1: Buyers Seeking Transparency to Develop Price Benchmark -Buyers and sellers of liquefied natural gas (LNG) are starting to turn to online trading platforms to conduct their business in an effort to gain the transparency, liquidity and optionality they desire to trade physical cargoes, as well as an efficient marketplace to execute transactions.“Buyers want to have the choice for some optionality as well. They want flexibility,” said GLX CEO Damien Criddle, whose independent online platform trades LNG. Buyers last year sought contracts that averaged around seven years, Royal Dutch Shell plc said in its second annual outlook on the global LNG market.Most LNG in the global marketplace today is sold under long-term contracts of 10-20 years, fee structures still desired by most sellers. For example, Cheniere Energy Inc.’s recent deal with PetroChina International Co. Ltd. is to sell 1.2 million metric tons per year through 2043. However, there is a growing appetite from buyers for shorter contracts with more flexibility.The need for greater flexibility in a marketplace that has seen spot LNG volumes increase substantially in the last decade is one reason Criddle, a former LNG transaction lawyer, and his team formed GLX in 2015. The Singapore-based company launched its trading platform last year and now has more than 40 members from Asia, Australia, Europe, the Middle East and North America. Another five companies now are in the process of joining the exchange.GLX closed its first transaction on May 21. The deal was the first time Malaysia’s state-owned Petroliam Nasional Berhad, through subsidiary Petronas LNG Ltd. (PLL), sold an LNG cargo on an online trading platform. Criddle said a number of cargoes have negotiated using the platform, but the recent Petronas trade is the first to utilize the end-to-end functionality of GLX through to close the deal.
LNG Awakening Part 2: U.S. Exports on the Rise, But Limited Infrastructure in Thirsty Global Markets a Big Concern – Part two of a three-part series (See Part One; Part Three) For all the economic benefits that liquefied natural gas (LNG) exports are expected to bring to the United States, including bringing an estimated $30 billion back into the domestic economy, a lack of infrastructure to support demand and complex regulatory regimes in some of the fastest growing markets have left industry experts cautiously optimistic about growth potential.China surpassed South Korea as the second largest importer of LNG in 2017 with imports averaging 5 Bcf/d, exceeded only by Japanese imports of 11 Bcf/d, according to data from IHS Markit and official Chinese government statistics. Imports of LNG by China, driven by government policies designed to reduce air pollution, increased by 1.6 Bcf/d (46%) in 2017, with monthly imports reaching 7.8 Bcf/d in December. An expected surge in 2018 could put China in direct competition with Japan for the No. 1 spot.The surge in gas demand over the past year led to “severe strains” on China’s gas infrastructure, “as retail and wholesale prices increased sharply and LNG imports ramped up beyond notional capacity limits,” BP plc chief economist Spencer Dale said in a June webcast to discuss BP’s 67th annual Statistical Review of World Energy. The strain also led to widespread gas rationing, with households given priority over industrial use.“Some of these tensions and strains simply reflect the speed with which gas demand expanded. There’s a limit to how quickly LNG imports can be increased,” Dale said. “Imported pipeline gas didn’t grow by as much as perhaps expected. But the strains also highlighted the underlying weakness of gas infrastructure in China. The network of pipelines across China is incomplete leading to significant distributional issues. Even more important, gas storage capacity in China is inadequate to match the fluctuations in demand.”Effective gas storage in China is about 3% of consumption, compared to 20% in the United States and Europe, according to BP. “These types of structural issues can’t be fixed overnight and are likely to constrain the extent at which Chinese gas demand outside of the power sector can grow in the near-term,” Dale said.
LNG Awakening Part 3: Second-Wave Developers Optimistic About Future Despite Growing Trade Disputes– Part three of a three-part series (See Part One; Part Two) Even with the United States seemingly on the brink of an international trade war, and growing concern in the oil and natural gas industry that recently enacted tariffs on goods from China and other countries could threaten development, second-wave liquefied natural gas (LNG) developers appear to be cautiously optimistic that the economic and environmental benefits of U.S. exports will ensure future projects get off the ground. NextDecade Corp. CEO Matthew Schatzman recently touted LNG exports as a way for the U.S. government to positively impact the environment by promoting the use of low-cost natural gas over coal in both developed and emerging markets. NextDecade is developing the Rio Grande LNG export project at the southern tip of Texas in Brownsville. Schatzman told NGI he thinks the global market needs at least 150 million metric tons/year (mmty) of new liquefaction capacity by 2025. Two-thirds of the supply likely would come from North America, mainly from the U.S. Gulf Coast.“The U.S. has abundant natural gas reserves and is well-positioned to provide global markets with reliable, low-cost LNG. In fact, due to its abundance of natural resources, the United States has an opportunity to emerge as the world’s largest supplier of LNG in the coming years,” Schatzman said. Still, the recent tariffs imposed on steel and aluminum from China, the European Union, Mexico and Canada, as well as additional tariffs on Chinese products collectively valued at about $50 billion in 2018 trade values, are keeping some in the industry on pins and needles when it comes to whether the United States will be able to capitalize on the rapidly growing LNG demand in the Asia Pacific region. “Some of these LNG project developers have pointed out that Chinese customers are telling them that they can buy their LNG from several other producers,” an official with an LNG consultancy said. China’s three largest LNG suppliers today are Australia, Qatar and Malaysia, while pipeline imports come from central Asia and Myanmar.
LNG spot prices rally on tight supply, summer heat –Platts Snapshot video – Concurrent maintenance activities and outages on the supply side tightened the LNG market during the month of June. This caused a massive rally in the Platts JKM price for spot deliveries into Northeast Asia. Now we have to ask whether this trend is expected to continue, or if supply will come back in the coming months leading up to the winter.
Natural Gas Prices to Average $2.99 This Year, $3.04 in 2019, Says EIA – Higher natural gas production during the injection season is expected to offset low storage levels and will moderate upward price pressures this year, resulting in Henry Hub spot prices averaging $2.99/MMBtu for 2018, according to the Energy Information Administration (EIA).Prices next year are expected to average slightly higher at $3.04/MMBtu, EIA said in its latest Short-Term Energy Outlook (STEO), which was released Tuesday.The 2018 price forecast is unchanged from EIA’s previous STEO, while the 2019 price forecast is down 4 cents from $3.08/MMBtu.New York Mercantile Exchange contract values for October 2018 delivery traded during the five-day period ending July 5 suggest a price range of $2.37-3.59/MMBtu, encompassing the market expectation of Henry Hub prices in October at the 95% confidence level, EIA said.The front-month natural gas futures contract for delivery at Henry Hub settled at $2.84/MMBtu on July 5, a decrease of 13 cents/MMBtu from June 1.”Record-high natural gas production continues to limit upward price pressures,” according to EIA, which estimates that natural gas production reached 81.8 Bcf/d in June, 9.2 Bcf/d higher than in June 2017. “However, for the four weeks ending June 28, cooling degree days were 23% higher than normal, putting some upward pressure on natural gas prices.”Futures prices increased to $3.02/MMBtu on June 15, the first time prices were more than $3.00/MMBtu since January. “Additional natural gas consumption for power generation helped to keep natural gas inventories about 500 Bcf below the five-year (2013 – 17) average through June, despite rising production.” Following the coldest April in more than two decades and a resulting delay to the start of the summer injection season, inventories are expected to increase at the five-year average rate of growth during the injection season to reach 3.5 Tcf on October 31, 9% lower than the five-year average for the end of October, EIA said.
Power Demand Could Keep Natural Gas Storage at Deficit Despite Record Onshore Output – Even as Lower 48 natural gas production has reached record highs in recent days, strong power demand in the South Central region of the United States stands to challenge storage injections going into the peak summer period, according to Barclays Commodities Research.Daily natural gas flow volumes have climbed just north of 80 Bcf/d on a handful of days since the end of June. Growth has come from shale plays including the Marcellus and Utica despite infrastructure issues in the region, like the explosion on Columbia Gas Transmission’s Leach Xpress that has restricted flows on the pipeline and the still pending in-service requests for the final portions of Energy Transfer Partners LP’s Rover Pipeline. Incremental additions to takeaway capacity in the Permian Basin have allowed for continued production growth in that region as well.East Daley analysts have also noted that production from the Louisiana side of the Haynesville Shale “has been on a tear” since early 2017 as commodity prices have rebounded from 2016 lows. Natural gas production volumes hitting interstate pipelines have nearly doubled in the past 18 months, they said.Sample volumes showed the biggest sequential increases in 2Q2018 for Azure Midstream Energy LLC’s Holly system (up 52%), Momentum Midstream LLC’s M5/Indigo Blue Union (27%), Kinder Morgan Inc.’s Kinderhawk system (22%) and Aethon Energy’s Ibex system (22%).Given the production growth trajectory, Barclays researchers expect Lower 48 production to average 79.9 Bcf/d in 2018, up 7.3 Bcf/d year/year (y/y). Despite the surge in production, storage inventory deficits of historical levels remain.
Market Awaiting EIA Storage Report as August Natural Gas Called Lower — August natural gas futures were set to open Thursday about 1.6 cents lower at around $2.813/MMBtu, with the market looking ahead to a potentially leaner than average Energy Information Administration (EIA) storage report that could help gauge the impact of recent heat. Estimates for this week’s EIA report point to a build well shy of the five-year average. A Reuters survey of traders and analysts on average showed respondents anticipating a 56 Bcf build for the week ended July 6, with responses ranging from 47 Bcf to 67 Bcf. A Bloomberg survey produced a median 55 Bcf injection, with a range of 34 Bcf to 67 Bcf. IAF Advisors analyst Kyle Cooper predicted a 50 Bcf build, while Intercontinental Exchange EIA Financial Weekly Index futures settled Wednesday at an injection of 49 Bcf. Last year, EIA recorded a 59 Bcf build, and the five-year average is an injection of 77 Bcf “It was warmer than normal over most of the country besides portions of the Northwest and South, exceptionally hot across the Northeast and Great Lakes where mid-90s were observed, although tricky with the Fourth of July holiday,” NatGasWeather said. “Our algorithm sees a bullish outcome at 47-48 Bcf.” As for the latest weather data, the firm said overnight guidance failed to trend hotter for the last week of July, “seeing weather systems tracking across the northern and eastern U.S. with mostly comfortable conditions, although hot over the rest of the country with 90s and 100s. Essentially, still not impressive enough for the market’s liking across the Northeast late next week into the last week of July.
EIA report shows a weekly rise of 51 billion cubic feet in U.S. natural-gas supplies – The U.S. Energy Information Administration reported Thursday that domestic supplies of natural gas rose by 51 billion cubic feet for the week ended July 6. Market consensus had called for a rise just shy of 60 billion cubic feet, according to Schneider Electric. Total stocks now stand at 2.203 trillion cubic feet, down 725 billion cubic feet from a year ago, and 519 billion below the five-year average, the government said. August natural gas NGQ18, -0.39% fell 2.1 cents, or 0.7%, at $2.808 per million British thermal units, down from $2.824 before the supply data.
Natural Gas Is Not Filling Storage Quickly Enough Before Winter – Natural gas is not making any progress in whittling down its significant storage deficit. This will not be a big issue if the upcoming winter is warmer than normal, or even normal. However, if the upcoming winter is much colder than normal, then parts of the country will run out of natural gas in storage and shortages will occur before the winter is over. This could cause a large rally in natural gas prices before the end of winter, if the winter is much colder than normal. At this point in time it is too early to know what the temperatures will be for the upcoming winter. The latest EIA Natural Gas Storage Report shows the following: According to the EIA: “Working gas in storage was 2,203 Bcf as of Friday, July 6, 2018, according to EIA estimates. This represents a net increase of 51 Bcf from the previous week. Stocks were 725 Bcf less than last year at this time and 519 Bcf below the five-year average of 2,722 Bcf. At 2,203 Bcf, total working gas is within the five-year historical range.” The key number to focus on is that natural gas in storage is 519 Bcf below the five-year average, which is almost 20% below normal. What is also concerning is that natural gas in storage is getting closer to falling below the five-year minimum. Below is the EIA chart of the five-year average of natural gas in storage: The report states as of July 6, 2018, the five-year minimum in storage was 2,053 Bcf. With the latest storage levels at 2,203 Bcf, we are now only 150 Bcf above the five-year minimum. The five-year minimum occurred in 2014 when storage fell to 825 Bcf at the end of March. In 2014, the summer was mild and natural gas in storage rose at an above normal rate. That is not what is happening this summer. In early 2014 natural gas futures nearly doubled and spiked to over $6 per Mcf based on storage concerns. At that time natural gas prices were depressed based on a belief that growing supply was outpacing demand. The same conditions exist in today’s natural gas futures market. Hence, if storage concerns become real in early 2019 it is reasonable to expect a significant increase in natural gas futures prices from current levels.
Fourth-ever crude export sails from LOOP after record-setting load time – Another record-setting crude export out of the Louisiana Offshore Oil Port (LOOP) sailed Wednesday afternoon and is headed to the Caribbean after spending about four days loading, according to Platts vessel-tracking software. The Anne, a VLCC with a capacity of 2.02 million barrels of crude, is due on the Dutch Antilles island of St. Eustatius, on Tuesday and was north of Puerto Rico on Monday, according to cFlow, Platts trade flow software. A representative from LOOP did not return a request for comment Monday. LOOP loaded the tanker about two days faster than its previous best, which sailed only two weeks previously. Platts cFlow showed Anne arriving at LOOP on July 1 and the tanker departed on July 4. That compares with seven days at LOOP for Shaden and 10 days for Nave Photon and with six days for Eagle Vancouver, which were the first, second and third VLCCs to load at LOOP earlier this year, respectively. Four days is much faster than other VLCC load-times in the US Gulf Coast, which must either be partially or fully loaded using reverse lightering. Typically, US Gulf Coast VLCC loadings take on average 10 days to complete, according to a recent presentation by an Occidental Petroleum representative. However, as export terminals increase their capacities and fine tune their loading procedures, those load times are shortening. By comparison, the FPMC C MELODY, another VLCC was recently partially loaded in the US Gulf Coast at Enterprise Products’ Texas City dock on the Houston Ship Channel. That vessel arrived for loading in Texas City on June 21 and then moved to the Offshore Galveston Lightering Zone, where the remainder of the cargo was loaded via ship-to-ship transfer. FPMC C MELODY set sail on June 28 and is expected to arrive in Sikka, India, on August 9. FPMC C MELODY also made a one-day stop in St. Eustatius, where there are a number of blending and storage facilities.
Plans Afoot To Load Crude Onto VLCCs At More Gulf Coast Ports –For the first time ever, U.S. crude oil exports have hit the 3 MMb/d mark – a once-unthinkable pace equivalent to sending out 10 fully loaded Very Large Crude Carriers a week. VLCCs, with their 2-MMbbl capacity and rock-bottom per-bbl delivery costs, are the most cost-effective way to transport crude to distant markets like China and India. But there’s still only one terminal on the Gulf Coast that can fill a VLCC to the brim – the Louisiana Offshore Oil Port – and pipeline connections from key Texas and Oklahoma plays to LOOP are limited. Elsewhere along the coast, VLCCs need to be loaded in offshore deep water by reverse lightering from smaller vessels – a slower and more costly loading process. Change is a-comin’, though. Companies are testing the docking and partial loading of VLCCs at terminals along the Texas coast, and plans for a number of greenfield facilities capable of partially – or even fully – loading the gargantuan vessels at the dock are being considered. Today, we review the latest efforts to streamline the loading of VLCCs and what they mean for crude-export economics. As we said in our last look at VLCCs a few months ago (Rock the Boat), the use of the supertankers during the U.S.’s 40-year ban on most crude exports was largely limited to imports to LOOP,, occasional shipments out of the Valdez Marine Terminal in Valdez, AK (the southern terminus of the Trans-Alaska Pipeline System) and into Andeavor’s Berth 121 in Long Beach, CA – the two other U.S. facilities designed to handle VLCCs. Since the export ban was lifted in December 2015, though, crude exports – and interest in using VLCCs for exports out of the Gulf Coast – have been on the upswing. Figure 1 shows that in 2015, the last year the ban was in place, exports (almost all of them to Canada) averaged 465 Mb/d, according to the Energy Information Administration (EIA). Exports rose 27% (to just about 590 Mb/d) in 2016, then almost doubled in 2017 (to more than 1.1 MMb/d).
US expected to become world’s top oil producer next year – The U.S. has nosed ahead of Saudi Arabia and is on pace to surpass Russia to become the world’s biggest oil producer for the first time in more than four decades. The latest forecast from the U.S. Energy Information Administration predicts that U.S. output will grow next year to 11.8 million barrels a day. “If the forecast holds, that would make the U.S. the world’s leading producer of crude,” says Linda Capuano, who heads the agency, a part of the Energy Department. Saudi Arabia and Russia could upend that forecast by boosting their own production. In the face of rising global oil prices, members of the OPEC cartel and a few non-members including Russia agreed last month to ease production caps that had contributed to the run-up in prices. President Donald Trump has urged the Saudis to pump more oil to contain rising prices. He tweeted on June 30 that King Salman agreed to boost production “maybe up to 2,000,000 barrels.” The White House later clarified that the king said his country has a reserve of 2 million barrels a day that could be tapped “if and when necessary.” The idea that the U.S. could ever again become the world’s top oil producer once seemed preposterous. “A decade ago the only question was how fast would U.S. production go down,” said Daniel Yergin, author of several books about the oil industry including a history, “The Prize.” The rebound of U.S. output “has made a huge difference. If this had not happened, we would have had a severe shortage of world oil,” he said
A Storm Is Brewing For U.S. Oil Exports — Two geopolitical developments in recent weeks – U.S. sanctions on Iran and the escalating U.S.-Chinese trade war – are set to reshuffle the U.S. oil flows to the world’s fastest-growing oil market, Asia. On the one hand, the United States is pressing Iran’s oil customers to cut their Iranian crude imports by as much as possible. China is Tehran’s biggest oil buyer, and India is its second. While India is reportedly preparing for a drastic reduction of Iranian oil imports, China will continue to buy Iranian oil. On the other hand, China is threatening to impose a 25-percent tariff on U.S. crude oil and oil products after the U.S.-Chinese trade war took a turn for the worse in recent weeks. Such a tariff would make American crude oil uncompetitive in China, and U.S. oil sellers will have to find alternative buyers for their crude to replace the volumes they are currently selling to their second-largest oil customer after Canada.India is an obvious possibility – its imports and demand are surging, and it may be willing to replace at least part of its Iranian oil imports out of fear that its companies and the sovereign could lose access to the U.S. financial system should it continue to buy Iran’s oil.But the problem with India possibly replacing Iranian oil with U.S. crude is that American light oil isn’t a substitute for heavy high-sulfur Iranian crude.India began regular U.S. imports last year, but the volumes are currently small, especially compared to the U.S. crude exports to China, EIA data shows. But in May, India’s imports of U.S. crude oil jumped by nine times the April volumes – signifying that at least a partial switch is already underway “Shale crude is not an alternative to Iranian crude,” Sandy Fielden, director of research for commodities and energy at Morningstar, told Bloomberg. “Indian refiners can’t absorb all the U.S. oil that was going to China. They can import more, but can they process it?”
U.S. Exporters Will Be a Surprise Loser From Tariff Fight (WSJ) Who’s the biggest loser when tariffs are imposed on imports? The surprising answer: exporters. Though completely counterintuitive, theory and evidence show that taxes on imports act just like a tax on exports. Though it’s early, the Trump administration’s recent round of tariffs is already rippling out to exporters: Soybean farmers face plunging prices as China raises tariffs, Harley-Davidson will move production of motorcycles destined for the European Union out of the U.S., and BMW says foreign retaliation may hit exports from its South Carolina plant. Economists credit Abba Lerner, then a graduate student at the London School of Economics, for proving theoretically in 1936 that an import tariff was equivalent to a tax on exports. The Lerner Symmetry Theorem is considered a key principle of trade economics, like 19th century economist David Ricardo’s theory of comparative advantage. .The practical link was obvious to protectionists and free traders alike as far back as the 1600s, says Douglas A. Irwin, an economist and trade historian at Dartmouth College. They understood that a country that shuts out imports deprives its trading partners of money to buy exports. This, Mr. Irwin notes in his book “Clashing Over Commerce: A History of U.S. Trade Policy,” is why Americans were so divided over tariff policy in the 1800s. When Northern states succeeded in raising tariffs to protect their manufacturers, they angered Southern states who paid more for manufactured goods and suffered falling prices for their exports such as cotton and tobacco. Mr. Irwin’s data show that while exports and imports have varied between 3% and 25% of gross domestic product since 1790, the two tend to move together. The link was especially strong under the gold standard because trade imbalances were financed by gold flows. If the U.S. ran a trade surplus, gold would flow in, depriving foreigners of the means to purchase U.S. goods. Now that exchange rates float, the effect is less direct, and a country can pay for imports by borrowing in the capital markets, as the U.S. has since the late 1970s. Yet even now, exports and imports tend to rise and fall together, proof that the underlying relationship still holds. If the U.S., for any reason, cuts its imports from a trading partner, that country’s economy and currency both weaken, so it buys less from U.S. companies. If a tariff generated significant new demand for the protected American sector, the resulting boost to prices and jobs would put upward pressure on inflation, interest rates and the dollar, further hurting exports.
Pipeline shortage could choke North America’s oil supply -In its annual five-year oil forecast published Monday, the IEA warned that Canadian oil pipeline constraints are part of a wider capacity crisis brewing across North America. “Colossal growth in North American supply from 2018 to 2023 raises the crucial question of whether there is enough pipeline capacity to transport and sell all of that oil. If sufficient capacity is not built, the increase in production we foresee could be at risk, with serious implications for global markets.” “During 2018-19, West Texas and West Canada are likely to face shortages in midstream capacity brought about by a rapid production increase,” the IEA said. “The situation will be much more severe in Canada than West Texas as legal delays mean capacity is unlikely to increase before the end of 2019.”
Saudi refinery exports first gasoline barrels to U.S. (Reuters) – A refinery in Saudi Arabia has shipped its RBOB gasoline to the United States for the first time, a potential precursor for more deliveries to a region where prices are currently at seasonal three-year highs. The 400,000 barrels-per-day Jubail Satorp refinery, a joint venture between Saudi Aramco and French company Total, said in its verified Twitter account that it sent the shipment of reformulated blendstock gasoline – commonly called RBOB – to the United States. It did not say whether those barrels had arrived yet, and its exact destination was unclear. The shipment is unusual because when Satorp was founded in 2008, it was not expected to send RBOB to the United States, as Saudi gasoline demand remained strong, said Robert Campbell, head of oil products research at Energy Aspects in New York. Motor gasoline inventories in the United States fell to about 239 million barrels in the week to July 6, according to U.S. Energy Department data. Stockpiles were up from the same time last year, when inventories totaled 235.7 million barrels. Market participants expect the additional supply could slow U.S. inventory drawdowns. RBOB prices have been trading at seasonal three-year highs as crude has rallied in the midst of the busy U.S. summer driving season. Cash prices for the product in New York Harbor were at 2.00 cents per gallon above the futures benchmark on the New York Mercantile Exchange on Tuesday, the highest seasonally since 2015. The RBOB futures contract on NYMEX settled at $2.1603 a gallon on Tuesday. Energy trading companies often route vessels based on favorable spreads for crude oil and products, and right now moving gasoline to the United States is more profitable. But this shipment also could mean demand in Saudi Arabia is weakening, Campbell said. The shipment suggests that the Americas has become one of the best destinations for surplus gasoline, he added. “It’s tough because that means Asia really is quite significantly oversupplied,” Campbell said.
US jet fuel output soars amid record-breaking summer travel – This summer has seen oil prices at their highest levels in four years, but you would never guess that by looking at the statistics for US travel or jet fuel market fundamentals data. As Americans have taken to the skies in unprecedented numbers this summer, the US oil complex has churned out record-breaking amounts of jet fuel, supported by favorable production margins. In the first week of July, the S&P Global Platts assessment for the US Gulf Coast Brent crude to jet fuel cracking margin averaged $11.34/b, the highest that average has been since 2013 and about 31% above the previous four-year average of $8.63/b. Platts data shows that cracking margins in New York Harbor, Chicago and Los Angeles have followed similar patterns this year, which has helped lift US output to record levels. Nationwide jet production rose to 1.944 million b/d in the week that ended June 29, the highest that figure has ever been since the US Energy Information Administration began tracking it in 1982. This broke the previous all-time high set just a week earlier. The US Transportation and Security Administration said the Friday before Independence Day, June 29, was the second-busiest day in the history of the agency, with more than 2.67 million individuals screened at checkpoints nationwide, according to a July 3 notice. The week that ended June 30 was also the single busiest week for TSA screenings, and, combined with the two previous weeks, this amounted to the busiest consecutive 21 days on record, the TSA said.
US Refineries Persist in Using Toxic Acid, Despite Safer Alternatives – Fifty refineries across the United States use hydrofluoric acid. Because this highly toxic substance can travel for miles in the form of a potentially fatal ground-hugging cloud, however, use of the chemical continues to prove highly controversial – rarely more so than now, given recent accidents at some of these refineries and potential rule changes that call into question the chemical’s long-term future in the oil refining industry. In January 2017, California regulators announced that they were taking steps to potentially phase out a modified version of the acid being used at the two refineries in the state, but the rule is still being thrashed out, and it’s too soon to say whether an outright ban on hydrofluoric acid will be enacted there. Hydrofluoric acid is used as a catalyst to transform crude oil into high-octane gasoline. If released into the environment in California, its ability to travel for miles would put at risk the densely populated neighborhoods surrounding both refineries in the South Bay region of Los Angeles. Proponents of the status quo warn of the costs associated with switching to alternative processes, which could mean gasoline price spikes and plants potentially shuttered. But Sally Hayati, president of the Torrance Refinery Action Alliance, a local community group pushing for hydrofluoric acid to be phased out, believes that industry is exaggerating the costs of moving away from the chemical, and warns of the potential consequences of allowing its continued use. The Air Quality Management District (AQMD) is “bending too much to political and economic pressure by the refineries, and they’re not paying enough attention to their mandate to protect public safety,” she said about the agency responsible for the rule change. “There’s no other solution other than to get rid of [hydrofluoric acid].”
Oil’s New Technology Spells End of Boom for Roughnecks – After 20 years in the oil-and-gas industry, Eric Neece wasn’t surprised when he was laid off by GE Oil & Gas in Conroe, Texas, in 2015 after oil prices plummeted. He figured his job would come back when prices crept back up.He was almost right. The work came back. But Mr. Neece’s former job as a well logger – measuring well conditions thousands of feet underground – was gone. Those duties are increasingly being overseen remotely and handled by automation. Technology has already transformed labor needs in most of the world’s manufacturing. It’s now upending the energy business, foretelling the end for one of the last sectors in America where blue-collar workers could depend on jobs paying six-figure salaries. “Our industry has had a lot of people making $150,000 out in the field,” said Kathryn Humphrey, who spent two decades at BP PLC before retiring from the company’s digital oil field program in 2013. Those days are going away, she said.For Mr. Neece, the changes could reduce the number of jobs he used to do by more than 25%, analysts said. Automated control systems can send commands to underground tools that capture data on a well’s geologic formations, flow rate and other variables. Smaller teams of technical specialists located in remote operations centers are replacing laborers on the ground, who in the past made adjustments manually. The energy sector had been shielded from pressure to innovate by high oil prices. When prices fell 75% over 20 months beginning in 2014, oil and gas companies were finally forced to modernize to squeeze out profits. Many found they could use new technologies to do the work better and cheaper, with fewer people. They have invested billions of dollars on what the industry dubs “digital oil fields,” embracing artificial intelligence, automation and other technologies.
A decade of fracking research: What have we learned? — When oil and gas developers began using hydraulic fracturing to tap previously unaccessed sources of fossil fuels across the United States, the American public had a few questions. Will this process pollute drinking water? Will it cause cancer in the communities close to well sites? What are the ramifications for global climate change? Hydraulic fracturing – or fracking, as it is more commonly known – is just one small part of the broader process of unconventional oil and gas development. The extraction technique, popularized about a decade ago, has helped unlock hydrocarbons trapped in tight shale formations, spawning a vast web of rigs, wells and energy infrastructure across the country. Every element of that network carries its own risks for water contamination, air pollution, health and climate change. Scientists have, in some cases, been able to distill the likelihood and severity of those risks. But not always. “Those who have black-and-white views on this issue would be well served to look at the research and try to understand the other side’s position,” said Daniel Raimi, a University of Michigan lecturer and senior research associate at the think tank Resources for the Future (RFF). In his recent book, “The Fracking Debate: The Risks, Benefits, and Uncertainties of the Shale Revolution,” Raimi addresses some of the most divisive questions about the shale boom, including “Will fracking make me sick?” and “Is fracking good for the climate?” (Energywire, Jan. 26). Many times the answer is: We don’t know yet.
Opponents speak out against anchor supports for oil pipeline (AP) – More than two dozen people spoke out at a public hearing against a proposal for more anchor supports in the Straits of Mackinac to bolster twin oil pipelines. Enbridge Inc. is asking the Department of Environmental Quality to allow installation of 48 additional supports for its Line 5 pipes. A public hearing Wednesday evening in Mackinaw City drew waterfront property owners, environmentalists and others. Line 5 extends from Superior, Wisconsin, to Sarnia, Ontario. A nearly 5-mile (8-kilometer) section runs beneath the straits, where Lake Huron and Lake Michigan converge. The company has made several requests to install supports after gaps were discovered beneath the pipes. The DEQ earlier granted a permit for 22 supports. Environmental groups want Line 5 decommissioned and say the supports wouldn’t necessarily make it safer.
Left Wing Activists Target New Mexico Officials In Brutal Fight Over Mundane Fracking Rule – Environmentalists in a small New Mexico county are ratcheting up the rhetoric against local fracking ordinances as government officials fear the fight is taking on new and terrifying dimensions. Members of the state’s Sandoval County commission claim activists are haranguing them for contemplating rules permitting gas extraction. Documents also show activists are pressuring commissioners to block industry representatives from discussing future ordinances on natural gas production.“We got blasted by the public about being racists and baby killers,” Jay Block (pictured), one of the commission’s two Republicans, told The Daily Caller News Foundation, referring to insults people hurled at him during debates about gas exploration in the county. Block is in an untenable position, stuck in between an animated anti-gas movement and concerns about the county’s economic well-being. “The citizens are driving the narrative,” said Block, a conservative who worked for the Jack Kemp presidential campaign in 1987. “They are delivering misinformation to the public and not one time has the industry been invited,” he added, referring to the Citizens Watch Group (CWG), an activist group created after the commission voted down ordinances in 2017 following significant public outcry. The proposed ordinance would have banned drilling and fracking within 750 feet from homes, schools, hospitals, and fresh water supplies. It also required areas to be fenced and that operators provide certificates showing they have safe water use agreements. Any violations would result in a $300 fine.
Oil and gas community says proposed ballot measure would ban fracking in Colorado – – The debate on the topic of how far should oil and gas operations be from homes and schools could get a lot more intense if a proposed ballot measure in Colorado qualifies for the ballot. Currently, oil and gas operations cannot take place within 500 feet of a home or building and 1,000 feet from a school. “I really am concerned with the proximity of wells to homes and schools,” said Beth Ewaskowitz, a supporter of the campaign.Ewaskowitz, who lives in Erie, said she got involved in the signature gathering-effort after being concerned for her son’s safety. “I counted it up and there are 156 wells within a one mile radius of our home, Ewaskowitz said. Ewaskowitz said 2,500 feet is not an arbitrary number; it is equivalent to a half-a mile or the typical area evacuated when something goes wrong. In order to make the ballot, more than 98,000 signatures are needed. Campaign organizers declined to say how close they are but one official said “they are on track to make the ballot.”The oil and gas community is preparing for a major and costly political fight should this qualify for the ballot.“I consider this to be a ban on oil and gas in Colorado,” said Dan Haley, president and CEO of the Colorado Oil and Gas Association.Haley, like all major energy groups, is opposed to the measure, believing more than $7 billion in economic activity would be lost if this would be approved – not to mention thousands of jobs. “This would be a huge hit on our economy, we are talking about 100,000 jobs over the next five years if this were to pass,” Haley said.
North Dakota’s Oil Tax Collections In June: 72% Higher Than Predicted — July 13, 2018 – From “top North Dakota news stories” this week:Several categories of state tax collections are well above forecast, thanks largely to the resurgence in the state’s oil industry.The combination of higher oil prices and increased oil production has tax collections well ahead of the forecast made during the 2017 legislative session.North Dakota oil producers received an average of $61.11 per barrel during the month of April, with near-record production of 1.22 million bbl/day.Legislators forecast production at less than a million bbl/day at a price of $47.00/bbl, so tax collections for the month of June were 72% higher than predicted.Corporate and personal income tax, motor vehicle excise tax and sales tax collections are also running ahead of the budget forecast.The upside in the oil industry has been partially offset by lower commodity prices for grain and livestock. [Always something to complain about.]The surge in oil tax revenue, including a deposit of nearly $59 million in June, has pushed the state’s Legacy Fund balance to more than $5.5 billion. See 1Q18 taxable sales data here.
Red Fawn Fallis sentenced in DAPL protest case – Red Fawn Fallis was sentenced Wednesday for her role in a shooting incident during the Dakota Access oil pipeline protests. Fallis will serve 57 months in federal prison for one count of civil disorder and one count of possession of a firearm and ammunition by a felon. The sentences will run concurrently. Fallis is also sentenced to three years of supervised probation after her release. Chief Judge Daniel Hovland also put special conditions on her supervised release including drug and alcohol treatment and treatment for mental health issues. Hovland said she would not get credit for time served in a halfway house after she was arrested in January for violating her pretrial release agreement. Hovland says he is recommending placement in Phoenix or Tucson, Ariz. Fallis spoke at her sentencing saying that she feels remorse and takes responsibility for her actions. She also says she is doing the best she can to move forward and operate in a way that is best for her and the community. Both sides can appeal the sentence within 14 days of the judgement being signed.
Natural gas supply and consumption grow significantly from the first half of 2017 to the first half of 2018– Natural gas supply and consumption have grown significantly from the first half of 2017 through the first half of 2018. According to data from PointLogic Energy, total natural gas consumption in the Lower 48 states averaged 87.4 billion cubic feet per day (Bcf/d) during the first half of 2018, which is 8.4 Bcf/d (11%) greater than during the first half of 2017. The total supply of natural gas averaged 84.8 Bcf/d during the first half of 2018, a 7.8 Bcf/d (10%) year-on-year change.Natural gas consumption in the first half of 2018 grew in all sectors compared with the year-ago levels:
- The largest growth occurred in residential and commercial consumption, which rose by 3.7 Bcf/d (17%) compared to the first half of 2017. Residential and commercial consumption is primarily related to heating needs, and the beginning of 2018 experienced record, prolonged cold temperatures across much of the Lower 48 states.
- The volume of natural gas used for electricity generation (power burn) during the first half of the year increased by 2.2 Bcf/d (9%) from 2017 to 2018. the increased power burn may have resulted from the increased buildout of natural gas-fired power plants, continued coal-to-gas switching, and the use of electric heating during the cold weather.
- The first half of 2018 saw an increase in exports over year-ago levels. Liquefied natural gas (LNG) exports and net pipeline exports to Mexico collectively increased by an average of 1.4 Bcf/d (23%) from the first half of 2017 through the first half of 2018.
The increase in natural gas supply was driven by dry production, which rose 7.4 Bcf/d (10%) from the same period last year. Production increases were facilitated by the additional pipeline capacity brought into service since June 2017, including the Leach XPress, the Rover Pipeline, and Phase 1 of Atlantic Sunrise. Net pipeline imports from Canada increased slightly, likely related to the colder weather.Overall, consumption increased 0.7 Bcf/d more than supply. This market tightening was reflected in the large storage withdrawals this year and the current low levels of natural gas in storage relative to the five-year average.
Natural gas-fired electricity generation this summer expected to be near record high – EIA’s July 2018 Short-Term Energy Outlook (STEO) expects natural gas-fired power plants to supply 37% of U.S. electricity generation this summer (June, July, and August), near the record-high natural gas-fired generation share in summer 2016. EIA forecasts the share of generation from coal-fired power plants will drop slightly to 30% in summer 2018, continuing a multi-year trend of lower coal-fired electricity generation. The share of electricity generation supplied by natural gas-fired power plants has increased over the past decade, while the share supplied by coal has fallen, primarily as a result of sustained low natural gas prices, increases in natural gas-fired capacity, and retirements of coal-fired generating capacity. Over the three-year period from 2015 to 2017, the cost of natural gas delivered to electric generators averaged $3.16 per million Btu (MMBtu), compared with $7.69/MMBtu between 2006 and 2008. The combination of relatively low natural gas prices, environmental regulations, and supportive renewable energy policies has led the industry to build new natural gas-fired and renewable capacityand to retire coal-fired power plants. As reported on EIA’s Preliminary Monthly Electric Generator Inventory, power plant operators added 5.4 gigawatts (GW) of new natural gas-fired generating capacity during the first four months of 2018 with an additional 15 GW scheduled to come online through the end of the year. This addition would be the largest increase in natural gas capacity since 2004. The electric industry also added 2.6 GW of new utility-scale solar and wind generating capacity during the first four months of the year, with an additional 9.6 GW scheduled to come online by the end of 2018. More than 10 GW of coal-fired capacity was retired over the 12-month period ending April 2018. EIA forecasts the delivered cost of natural gas will average $3.16/MMBtu this summer, 2% lower than the average cost during the summer of 2017. In contrast, the cost of coal delivered to electric generators is forecast to rise slightly this summer. The continued low cost of natural gas, along with the recent additions of natural gas-fired capacity and retirements of coal power plants, drive EIA’s expectation that natural gas will contribute a growing share of electricity generation this summer, while coal’s share will fall.
Natural gas production records on the way, says US EIA, pointing to efficiency – The US Energy Information Administration raised its natural gas production estimates for the remainder of 2018 and continued to predict new production records for the year, as drilling efficiencies combine with higher output associated with oil production. Natural gas consumption was also expected to be higher for 2018 than 2017, driven by power sector use, according to the agency’s July short-term energy outlook released Tuesday.”The July outlook continues to forecast record production for US dry natural gas in 2018 and 2019,” said EIA Administrator Linda Capuano. “Assuming the forecast holds, we will see production top 81 Bcf/d in 2018, and another increase that will push production up” to roughly 84 Bcf/d next year.The agency Tuesday raised by 0.71 Bcf/d to 89.83 Bcf/d its natural gas marketed production estimate for the US in the fourth quarter. It also raised its Q3 production forecast by 0.55 Bcf/d to 88.77 Bcf/d.”The expected growth in natural gas production is largely in response to improved drilling efficiency and cost reductions, as well as higher crude oil prices that contribute to higher associated gas production from oil-directed rigs,” the report said. Capuano noted that growth in production enables EIA’s forecast of LNG and pipeline exports from the US to expand, while natural gas pipeline imports from Canada continue to decline.”New infrastructure and increased exports from the Appalachia basin to the US Midwest and Canada are behind much of the decrease,” Capuano said. The decrease was expected to continue as the Rover and Nexus pipelines add to deliveries of Appalachian basin gas to the Midwest and Eastern Canada. Turning to prices, EIA said that “higher natural gas production during the injection season will offset current and forecast low storage levels and will moderate significant upward price pressures in 2018.” It lowered its forecast for Q3 Henry Hub natural gas spot prices by 2 cents to $2.99/MMBtu. The 2018 forecast stayed flat at 2.99/MMBtu, but the 2019 forecast dropped 4 cents from the previous month’s estimate to $3.04/MMBtu. As to storage, the agency estimated that natural gas inventories are likely to increase at the five-year average rate of growth during the current injection season to reach 3.5 Tcf on October 31. That level would be 9% lower than the five-year average for the end of October.


