Written by Steven Hansen
There is a slowing trend for existing and new home sales. In reality, a few months of bad sales occur often in good times and bad. BUT there are housing dynamics with which we should be concerned – and these could be some of the underlying issues which are detrimentally impacting home sales.

Please share this article – Go to very top of page, right hand side, for social media buttons.
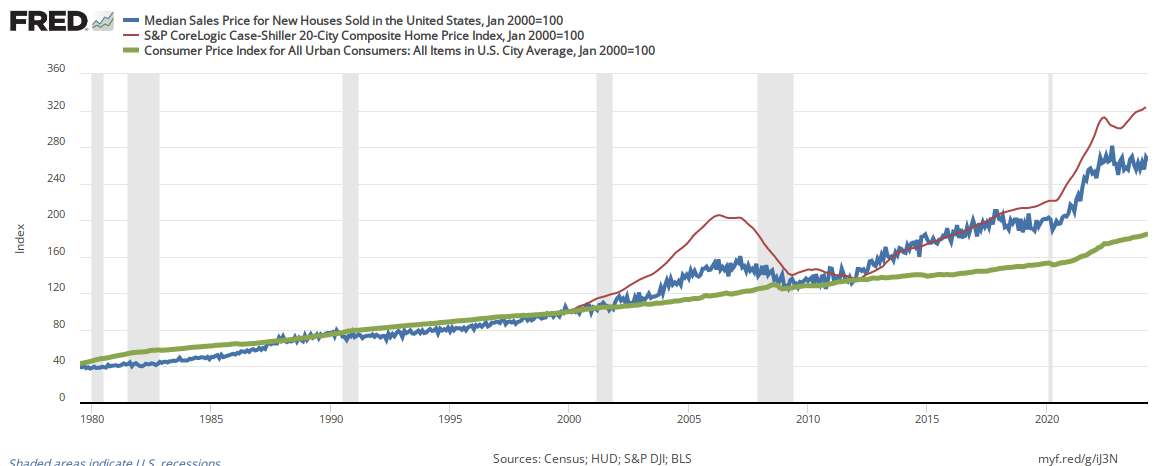
The cost of buying a home is far outpacing inflation. The graph below compares the median sales price for new houses (blue line), S&P/Case-Shiller 20 City Price Index for existing homes (red line), and the CPI-U (green line).
asdf
Consider that the median household’s income is just keeping pace with inflation – so where would additional moneys for a home purchase come from?

To add to the headwinds, interest rates one pays for mortgages are drifting up – albeit still low historically.

To visualize the impact of rising mortgage rates, here is a table from hsh.com which shows the increase in payments per $1000 of mortgage for each increase in interest rates.
| Interest Rate % | 15 Year Term | 30 Year Term | ||
| Monthly Payment | Total Amount | Monthly Payment | Total Amount | |
| 2.00% | 6.43 | 1158.31 | 3.69 | 1330.62 |
| 2.125% | 6.49 | 1168.70 | 3.75 | 1353.24 |
| 2.25% | 6.55 | 1179.14 | 3.82 | 1376.08 |
| 2.375% | 6.60 | 1189.65 | 3.88 | 1399.14 |
| 2.50% | 6.66 | 1200.21 | 3.95 | 1422.43 |
| 2.625% | 6.72 | 1210.84 | 4.01 | 1445.94 |
| 2.75% | 6.78 | 1221.52 | 4.08 | 1469.67 |
| 2.875% | 6.84 | 1232.25 | 4.14 | 1493.61 |
| 3.00% | 6.90 | 1243.04 | 4.21 | 1517.77 |
| 3.125% | 6.96 | 1253.89 | 4.28 | 1542.15 |
| 3.25% | 7.02 | 1264.80 | 4.35 | 1566.74 |
| 3.375% | 7.08 | 1275.76 | 4.42 | 1591.54 |
| 3.50% | 7.14 | 1286.78 | 4.49 | 1616.56 |
| 3.625% | 7.21 | 1297.86 | 4.56 | 1641.78 |
| 3.75% | 7.27 | 1308.99 | 4.63 | 1667.21 |
| 3.875% | 7.33 | 1320.19 | 4.70 | 1692.85 |
| 4.00% | 7.39 | 1331.43 | 4.77 | 1718.69 |
| 4.125% | 7.45 | 1342.74 | 4.84 | 1744.73 |
| 4.25% | 7.52 | 1354.10 | 4.91 | 1770.90 |
| 4.375% | 7.58 | 1365.51 | 4.99 | 1797.42 |
| 4.50% | 7.64 | 1376.98 | 5.06 | 1824.06 |
| 4.625% | 7.71 | 1388.51 | 5.14 | 1850.90 |
| 4.75% | 7.77 | 1400.09 | 5.21 | 1877.93 |
| 4.875% | 7.84 | 1411.73 | 5.29 | 1905.14 |
| 5.00% | 7.90 | 1423.42 | 5.36 | 1932.55 |
| 5.125% | 7.97 | 1435.17 | 5.44 | 1960.15 |
| 5.25% | 8.03 | 1446.97 | 5.52 | 1987.93 |
| 5.375% | 8.10 | 1458.83 | 5.59 | 1015.89 |
| 5.50% | 8.18 | 1470.75 | 5.68 | 2044.04 |
| 5.625% | 8.24 | 1482.72 | 5.76 | 2074.36 |
| 5.75% | 8.31 | 1494.73 | 5.84 | 2100.86 |
| 5.875% | 8.37 | 1506.81 | 5.92 | 2129.54 |
| 6.00% | 8.44 | 1518.94 | 6.00 | 2158.38 |
| 6.125% | 8.51 | 1531.13 | 6.08 | 2187.40 |
| 6.25% | 8.58 | 1543.36 | 6.16 | 2216.58 |
| 6.375% | 8.64 | 1555.65 | 6.24 | 2245.93 |
| 6.50% | 8.72 | 1567.99 | 6.33 | 2275.44 |
| 6.625% | 8.78 | 1580.39 | 6.40 | 2305.12 |
| 6.75% | 8.85 | 1592.83 | 6.49 | 2334.95 |
| 6.875% | 8.92 | 1605.34 | 6.57 | 2364.94 |
| 7.00% | 8.99 | 1617.89 | 6.65 | 2395.09 |
| 7.125% | 9.06 | 1630.49 | 6.74 | 2425.39 |
| 7.25% | 9.13 | 1643.15 | 6.82 | 2455.83 |
| 7.375% | 9.20 | 1655.86 | 6.91 | 2486.43 |
| 7.50% | 9.27 | 1668.62 | 6.99 | 2517.17 |
| 7.625% | 9.34 | 1681.43 | 7.08 | 2548.06 |
| 7.75% | 9.41 | 1694.29 | 7.16 | 2579.08 |
| 7.875% | 9.48 | 1707.20 | 7.25 | 2610.25 |
According to CoreLogic, the cost of new mortgage could go up 15 % this year:
A consensus forecast suggests mortgage rates will rise by about 0.85 percentage points, or 85 “basis points,” between November 2017 and November 2018. The CoreLogic HPI Forecast suggests the median sale price will rise 2.6 percent in real terms over the same period (or 4.6 percent in nominal terms). Based on these projections, the inflation-adjusted typical mortgage payment would rise from $804 in November 2017 to $910 by November 2018, a 13.3 percent year-over-year gain. In nominal terms the typical mortgage payment’s year-over-year gain would be 15.5 percent.
And another headwind is property taxes – as home values increase, property taxes increase.
But one thing is certain, only rental housing is roughly correlating with inflation.

New home purchases are counted in GDP – existing home purchases are not. Slowing new home sales could easily remove 0.5 % from GDP growth. Further, rising home ownership costs mean the additional monies spent on a home will not be spent on other purchases.
On the other hand, this is one more reason to rent and not buy – as renting may be the only affordable financial option for housing.
Other Economic News this Week:
The Econintersect Economic Index for March 2018 marginally improved but remains in territory associated with modest economic growth. Note that this index has been in a general down trend since July 2017. We remain concerned about the HISTORICALLY HIGH elevated spending to income ratios which paints a picture of a consumer spending all of its income – with little room for additional spending.


