Written by Steven Hansen
There is a problem in how we view INFLATION. My position is that for whatever reason, the cost of living is currently growing faster than published inflation rates.

Please share this article – Go to very top of page, right hand side, for social media buttons.
According to last Monday’s personal income and outlays report from the Bureau of Economic Analysis (BEA), year-over-year disposable income growth continues strong – but disposable expenditures continues to outpace income growth.
From our analysis of the report:
Real Disposable Personal Income is up 2.1 % year-over-year (published 1.9 % last month and revised to 1.8 %), and real consumption expenditures is up 2.8 % year-over-year (published 2.7 % last month and revised to 2.9 %)
The savings rate continues to be low historically, and marginally declined to 2.4 % this month [last month it was published the savings rate was 2.9 % – and is now revised to 2.5].
“Real” means that the numbers are inflation adjusted.
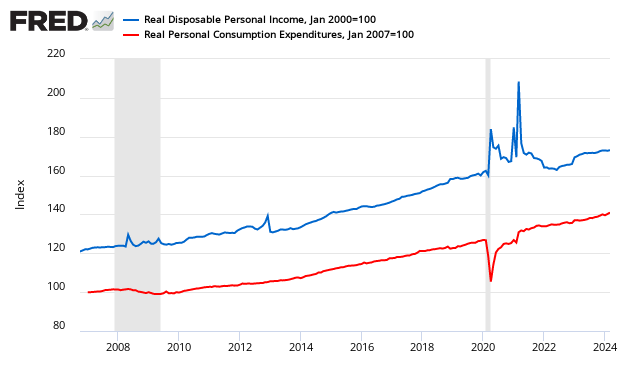
The first clue that something is wrong comes from the relationship between income (DPI) and expenditures (PCE) – showing clearly that income and expenditures historically grow at nearly the same rate over time – but now consumption is exceeding income..
Indexed to Jan 2000, Growth of Real Disposable Income (blue line) to Real Expenditures (red line)
The Bureau of Labor Statistics (BLS) analyzes inflation by tracking price changes in a market basket of consumer goods and services. But consider the following caveat from the BLS:
The CPI frequently is called a cost-of-living index, but it differs in important ways from a complete cost-of-living measure. BLS has for some time used a cost-of-living framework in making practical decisions about questions that arise in constructing the CPI. A cost-of-living index is a conceptual measurement goal, however, and not a straightforward alternative to the CPI. A cost-of-living index would measure changes over time in the amount that consumers need to spend to reach a certain utility level or standard of living. Both the CPI and a cost-of-living index would reflect changes in the prices of goods and services, such as food and clothing, that are directly purchased in the marketplace; but a complete cost-of-living index would go beyond this role to also take into account changes in other governmental or environmental factors that affect consumers’ well-being. It is very difficult to determine the proper treatment of public goods, such as safety and education, and other broad concerns, such as health, water quality, and crime, that would constitute a complete cost-of-living framework.
The BEA price deflators have their own caveats – from Wikipedia:
The first is the relative importance of housing, which is due in part to the difference in scope mentioned above. CPI contains a large component of owner-equivalent rent, which by definition is an imputed value and not a real direct expenditure. The second major difference in weight is healthcare. This again stems from the definition of the index and the surveys used. CPI measures only the out-of-pocket healthcare costs of households where PCE includes healthcare purchased on behalf of households by third parties, including employer-provided health insurance. In the United States, employer health insurance is a large component and accounts for much of the difference in weights.
Another notable difference is CPI prices and weightings are based on household surveys and PCE is based on business surveys. One reason for the difference in formulas is that not all the data needed for the Fisher-Ideal formula is available monthly even though it is considered superior. CPI is a practical alternative used to give a quicker read on prices in the previous month. PCE is typically revised three times in each of the months following the end of a quarter, and then the entire NIPA tables are re-based annually and every five years. Despite all these conceptual and methodological differences, the two indexes track fairly closely when averaged over several years.
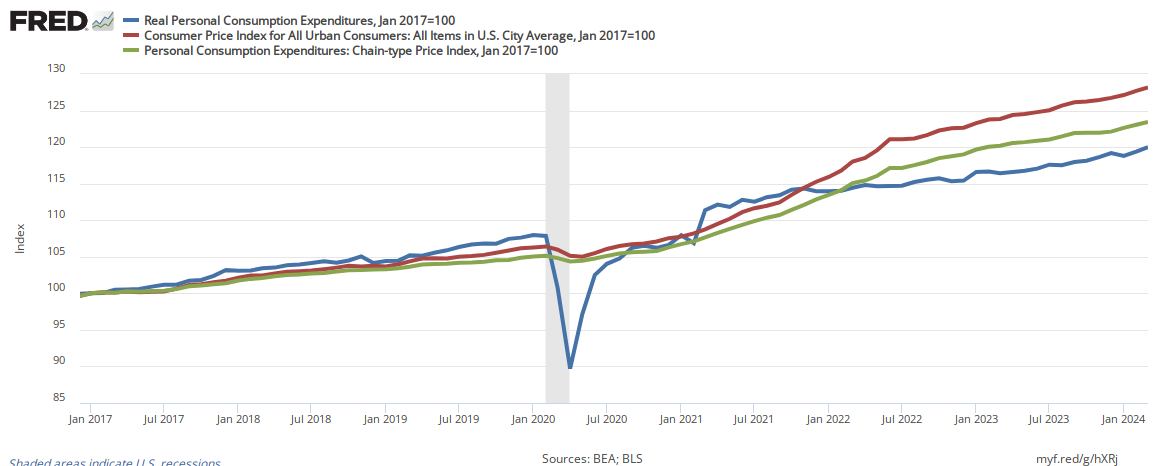
Now compare the CPI (red line) and the PCE price deflator (green line) to expenditure growth (blue line).

In 2017, expenditure growth was 2.9 % whilst the CPI says inflation was 1.6 % and the PCE price deflator was 1.3 %.
To add to the confusion, the BLS says the median real earnings have fallen in 4Q2017.

According to the BLS:
Data measure usual weekly earnings of wage and salary workers. Wage and salary workers are workers who receive wages, salaries, commissions, tips, payment in kind, or piece rates. The group includes employees in both the private and public sectors but, for the purposes of the earnings series, it excludes all self-employed persons, both those with incorporated businesses and those with unincorporated businesses.
This author believes the majority of the population is living from hand-to-mouth – and the majority of people would be spending their money on essentials. What is essential varies from person to person.
The bottom line is that the current data on INFLATION is far from what the average Joe is seeing.
Other Economic News this Week:
The Econintersect Economic Index for January 2018 Economic Index improved and remains in territory associated with stronger economic growth.
Bankruptcies this Week from bankruptcydata.com: none


