from the St Louis Fed
— this post authored by Yi Wen and Brian Reinbold
There are many ways to measure income and cost of living. In this post, we’ll look at a few of them to analyze income and living standards across China.

A common measure for gauging the living standard of a nation is real per capita gross domestic product (GDP). Real per capita GDP is the average amount of goods and services produced per person in a nation in a given year at constant prices.
The figure below shows real per capita GDP across the world in 2014 in terms of the dollar in 2011 at chained purchasing power parities.
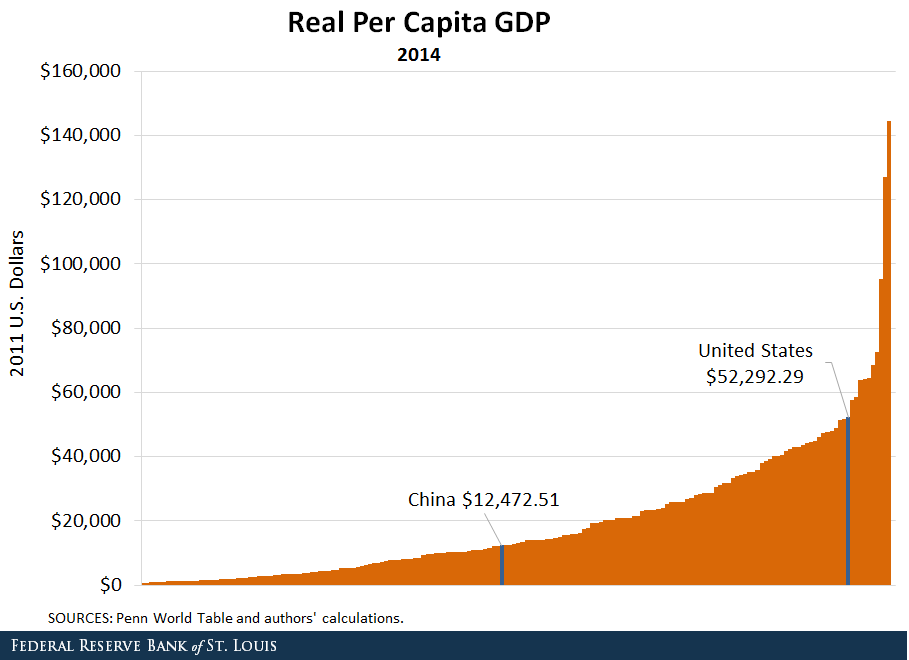
For the world as a whole, average real per capita GDP was $20,055.65, while the median figure was $12,981.40. The large difference between the average and the median income means that world income is concentrated in a few rich countries, thus suggesting a high level of global inequality.
This measure can be a useful way to compare living standards across the world. However, since the measure is based on the average income of each nation, it does not capture inequality in living standards within a nation. The figure shows that China’s average real per capita income is $12,472.51, which is in line with the world median income but far below the world average.
Income across Chinese Regions
To gauge the income distribution in China across regions, we next looked at real per capita household disposable income for 2015 by provinces. Disposable income is a person’s total income less taxes. We used a provincial-level consumer price index (CPI) to obtain real disposable income for different provinces across China.
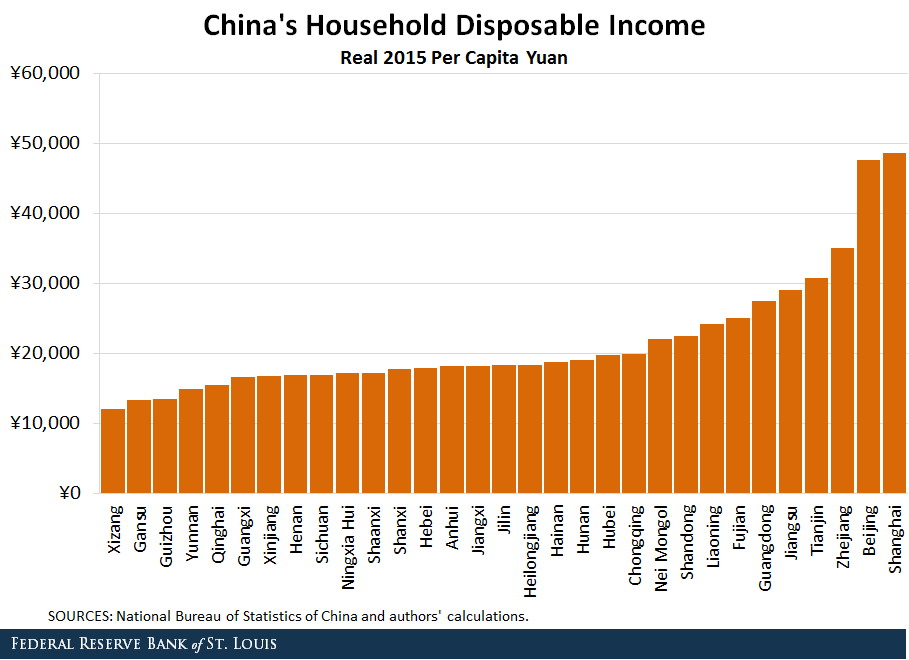
The average was 21,586.95 yuan, and the median was 18,371.34 yuan, suggesting that income inequality is not as severe in China as it is in the world. Nonetheless, the average income was still significantly higher than the median.
Indeed, the figure shows that income was significantly skewed toward a few provinces. This was especially true for Beijing and Shanghai, where real per capita household disposable income was around 48,000 yuan, or about four times the level of the lowest income regions. This breakdown begins to show regional wealth inequality within China, but still does not fully capture inequality within each province, which requires finer micro data.
Cost of Living
Obviously, income is only one aspect of living standards, while the cost of living is another. Given a fixed level of income, the higher the cost of living, the lower the living standard. Since a large share of income is typically spent on housing, living standards can be greatly affected (adversely) by housing prices.
We used a housing price index of over 100 Chinese cities to construct a provincial housing price index. We adjusted the average city price index within each province by each respective provincial CPI and used this number as a measure of the real cost of living. The following figure shows our provincial housing price index.
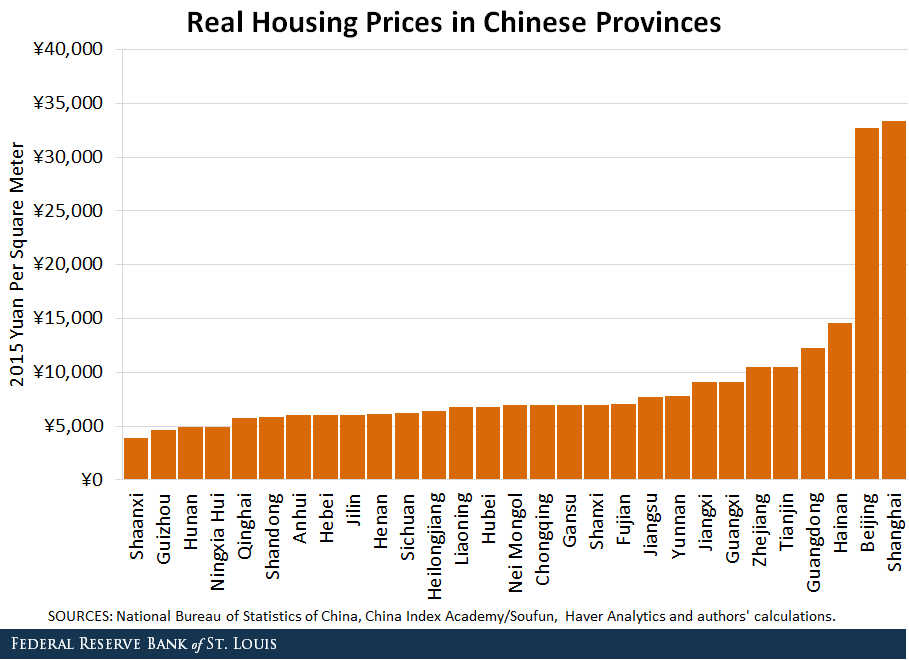
The median is just under 7,000 yuan per square meter. We see that housing prices in most provinces did not deviate greatly from the median, but housing prices in Beijing and Shanghai were nearly five times the median and over eight times the lowest housing price regions. Therefore, the cost of living can vary greatly across China.
Finally, we adjusted per capita household disposable income (the second figure) by our provincial housing price index (the third figure) to create an income index adjusted for cost of living (the figure below).
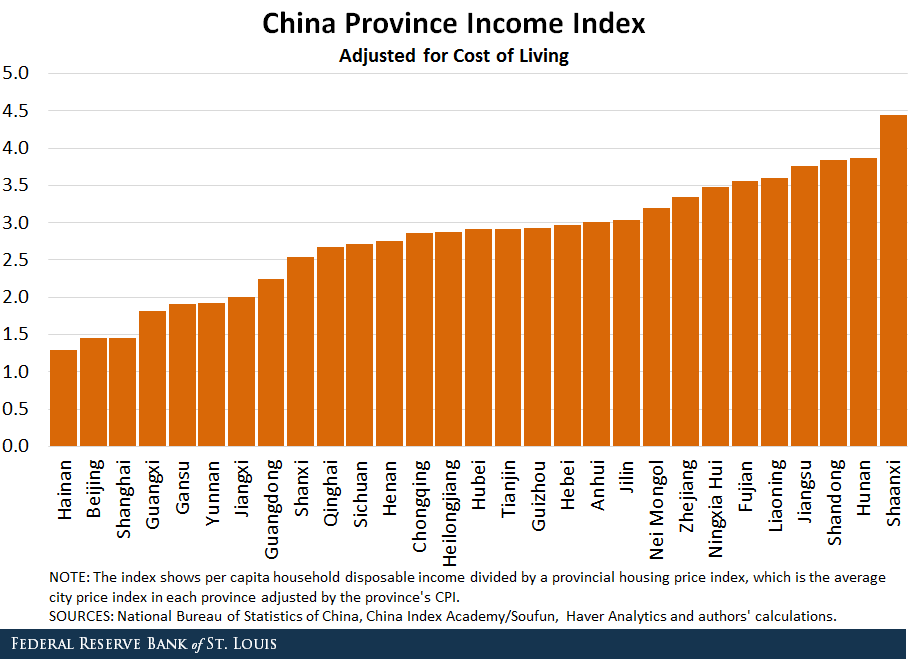
From this perspective, inequality looks less extreme. The average index was 2.8 and the median was 2.9.
Interestingly, Beijing and Shanghai were at the bottom of this index. The figure suggests that the high average income enjoyed by Beijing and Shanghai does not necessarily translate into high living standards because the cost of living was also extremely high in these two cities. In other words, the living standards in Beijing and Shanghai in terms of the purchasing power of yuan were not necessarily higher than the poor provinces, but were instead much lower. Hence, measured by average living standards in the provinces, inequality in China is not as severe as people often think. These results are similar to what St. Louis Fed President James Bullard found based on U.S. data.1
If anything, people living in the highest income regions could be the poorest in terms of living standards because of high costs of living in big cities. Although quite interesting, these data nonetheless do not reveal the inequalities across households within each province in China and across the nation.
Notes and References
1 Bullard, James. “Living Standards across U.S. Metropolitan Statistical Areas.” Presentation, Oct. 6, 2017.
Additional Resources
- On the Economy: How Tourism Affects China’s Current Account Surplus
- On the Economy: China’s Foreign Reserves Are Declining. Why, and What Effects Could This Have?
- On the Economy: How Is Income Inequality Measured?
Source
https://www.stlouisfed.org/on-the-economy/2018/january/income-living-standards-china
Disclaimer
Views expressed are not necessarily those of the Federal Reserve Bank of St. Louis or of the Federal Reserve System.


