Written by Steven Hansen
I keep being surprised by how much consumers are spending. But it should come as no surprise that the savings rate nears all time lows.

Please share this article – Go to very top of page, right hand side, for social media buttons.
The headline data this month showed some growth in consumer income and spending – with increase in expenditures far outpacing income growth. – and all at to the detriment of the savings rate. The savings rate worsened – and historically is extremely low.
Personal Savings as a Percentage of Disposable Personal Income

Consumer spending is far outpacing income – not good news.
Real Disposable Personal Income is up 1.2 % year-over-year (published 1.2 % last month and not revised), and real consumption expenditures is up 2.7 % year-over-year (published 2.5 % last month and not revised)
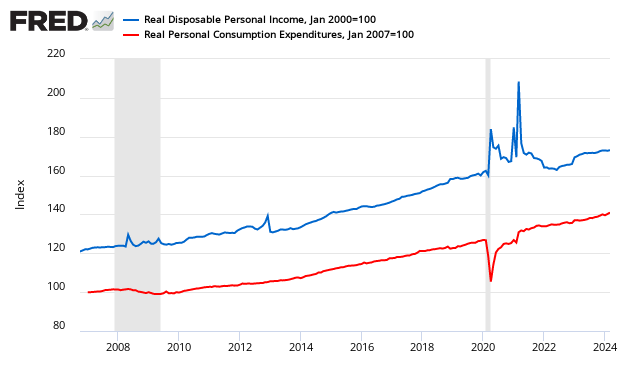
The graph below illustrates the relationship between income (DPI) and expenditures (PCE) – showing clearly income and expenditures grow at nearly the same rate over time – but currently consumption is greatly exceeding income..
Indexed to Jan 2000, Growth of Real Disposable Income (blue line) to Real Consumption Expenditures (red line)
And here is a non-indexed year-over-year growth of income Vs. expenditures.
Seasonally and Inflation Adjusted Year-over-Year Change of Personal Consumption Expenditures (blue line) to GDP (red line)

The real problem for the economy is that most are spending all of their income – and there is little room to spend more. Spending remains historically elevated and is near all time highs.
Seasonally Adjusted Spending’s Ratio to Income (a declining ratio means consumer is spending less of its Income)

PCE is the spending of consumers. In the USA, the consumer is the economy. Likewise, personal income is the money consumers earn to spend. Even though most analysts concentrate on personal expenditures because GDP is based on spending, increases in personal income allow consumers the option to spend more.
Econintersect and GDP use the inflation adjusted (chained) numbers. Disposable Personal Income (DPI) is the income after the taxes. In this view one can see the large discrepancy in growth last month.
Seasonally & Inflation Adjusted Percent Change From the Previous Month – Personal Disposable Income (red line) and Personal Consumption Expenditures (blue line)

Yet year-over-year growth for income and expenditures is below GDP year-over-year growth – which demonstrates the consumer is not currently driving GDP growth.
Seasonally & Inflation Adjusted Year-over-Year Change – Personal Disposable Income (red line) and Personal Consumption Expenditures (blue line)

Is the economy gearing up for a slow motion slowdown as consumers start spending less and less?
Other Economic News this Week:
The Econintersect Economic Index for November 2017 returned to the range of normal growth after last months brief dip. Still, the economic fundamentals are somewhat chaotic. Six-month employment growth forecast is now indicating slowing growth.
Bankruptcies this Week from bankruptcydata.com: Rio de Janeiro, Brazil-based Odebrecht Oleo e Gas (Chapter 15), Privately-held ExGen Texas Power (EGTP)


