
Written by Sig Silber
Unfortunately the forecast for Hurricane Harvey is not dealing with an ordinary storm. The usual storm arrives, has its impacts, and either departs or declines, entering the regular circulation. This storm is blocked and the current forecast is that it will remain a potent storm for perhaps a week and impact CONUS weather for as many as ten days or more. So this is a very early initial report.

Please share this article – Go to very top of page, right hand side, for social media buttons.
We will present the information in two parts.
Part A will be the current weather forecasts as they involve Harvey. (That information is being updated periodically at another of our weather articles and can be accessed by clicking here.)
Part B will be the physical and human impacts of this terrible storm.
First Part A.


Another way to look at the current situation.

No one knows for sure what the movement of Harvey will be but there is an official 60 hour forecast.

Latest NWS Discussion
Tropical Storm Harvey Discussion Number 27 NWS National Hurricane Center Miami FL 1000 PM CDT Sat Aug 26 2017
The central convection associated with Harvey has shown warming cloud tops during the past several hours, although radar data shows widespread rain continuing near and north of the center. Winds from the New Braunfels WSR-88D are near 65 kt at 1500-2500 ft near the center, but it is uncertain how well these winds are mixing down to the surface. The initial intensity is reduced to a somewhat uncertain 45 kt based mainly on the radar data.
Harvey has drifted east-northeastward since the last advisory. While the model guidance is not in great agreement, it appears that the cyclone will drift southward or southeastward during the next couple of days due to the distant influence of a trough digging into the eastern United States. After that time, a building ridge over the Gulf of Mexico should cause Harvey to drift generally northward. The new forecast track is similar to the previous track and lies near the consensus models. At this time, the forecast track keeps the center of Harvey inland, as there is not enough agreement between the models that the center of Harvey will actually emerge over water.
Harvey should continue to weaken to a tropical depression during the next day or so as the cyclone remains inland. As the center nears the coast, it is likely that the cyclone will maintain that status for several days as a large amount of the circulation will be over the water. By the end of the forecast period, the system should be far enough inland so that Harvey will again weaken. An alternative scenario is that Harvey could re-intensify if the center emerges over the Gulf.
Key Messages:
1. While Harvey’s winds are decreasing, life-threatening hazards will continue from heavy rainfall over much of southeastern Texas and from storm surge along portions of the Texas coast.
2. Catastrophic and life-threatening flooding is expected across the middle and upper Texas coast from additional rainfall of 15 to 25 inches, with isolated storm totals as high as 40 inches, through Thursday. Please heed the advice of local officials and do not drive into flooded roadways. Refer to products from your local National Weather Service office and the NOAA Weather Prediction Center for more information on the flooding hazard. A summary of rainfall totals compiled by the Weather Prediction Center can be found at: www.wpc.ncep.noaa.gov/discussions/nfdscc1.html [Editor’s Note: Click Here to Read]
3. A Storm Surge Warning remains in effect for portions of the Texas coast. Life-threatening storm surge flooding will be slow to recede due to the slow motion of Harvey and a prolonged period of onshore flow. For a depiction of areas at risk, see the Storm Surge Watch/Warning Graphic at hurricanes.gov.
FORECAST POSITIONS AND MAX WINDS [Editor’s Note: No longer showing movement back out into the GOM so that should mean that the precipitation estimates may be a bit lower than previous estimates especially towards the end. The forecasted Track is now to the north rather than along the coast. But there is not a high level of confidence in that track as described above]
INIT 27/0300Z 29.3N 97.3W 45 KT 50 MPH…INLAND
12H 27/1200Z 29.1N 97.4W 35 KT 40 MPH…INLAND
24H 28/0000Z 28.9N 97.3W 30 KT 35 MPH…INLAND
36H 28/1200Z 28.5N 97.0W 30 KT 35 MPH…INLAND
48H 29/0000Z 28.4N 96.8W 30 KT 35 MPH…INLAND
72H 30/0000Z 29.0N 96.5W 30 KT 35 MPH…INLAND
96H 31/0000Z 30.0N 96.5W 30 KT 35 MPH…INLAND
120H 01/0000Z 31.0N 96.5W 25 KT 30 MPH…INLAND
Probably more than most want to know but the Day 7 Mid-Atmosphere Forecast is always informative.

Now Part B.
Some of the graphics are very disturbing. But first we want to put this storm into perspective. This graphic was sent in by the NWS in Jackson Kentucky but was probably originally prepared by PBS.
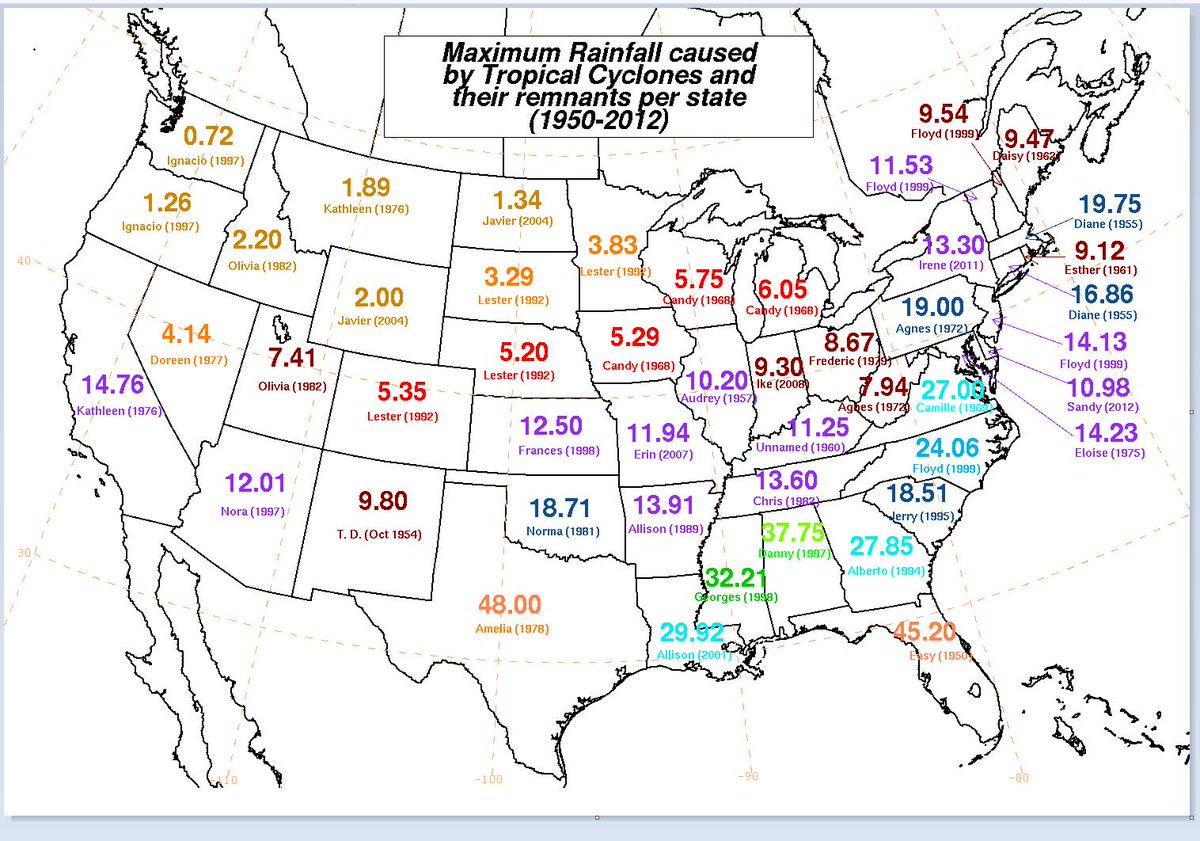
It shows that very wet events are not unknown to Texas so we hope they are prepared to deal with this one.
This is a photo shown on the Blog Category 6; Image Credit is Joe Raedle/Getty Images.
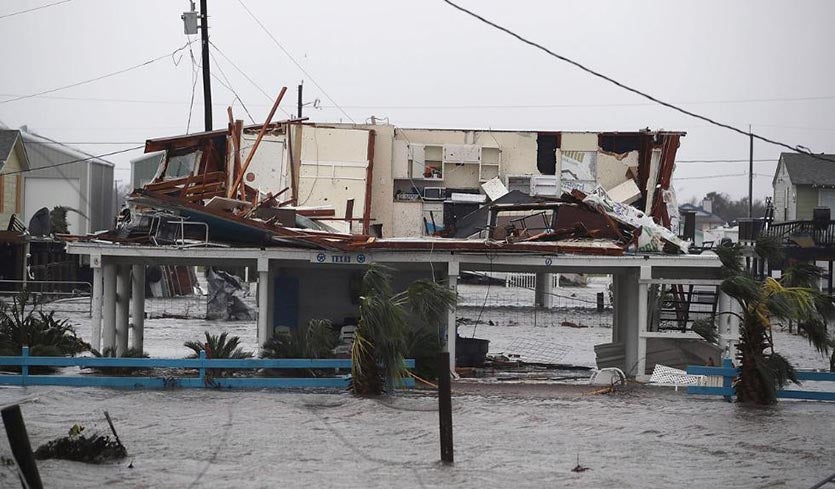
Rockport is about 40 miles Northeast of Corpus Christi and presumably exposed to the strongest winds which are often in the NE quadrant of the storm. Harvey’s winds declined rapidly so we should expect that wind damage now will be restricted to tornadoes which can be very deadly. The main story here will be the flooding.
Another Rockport photo
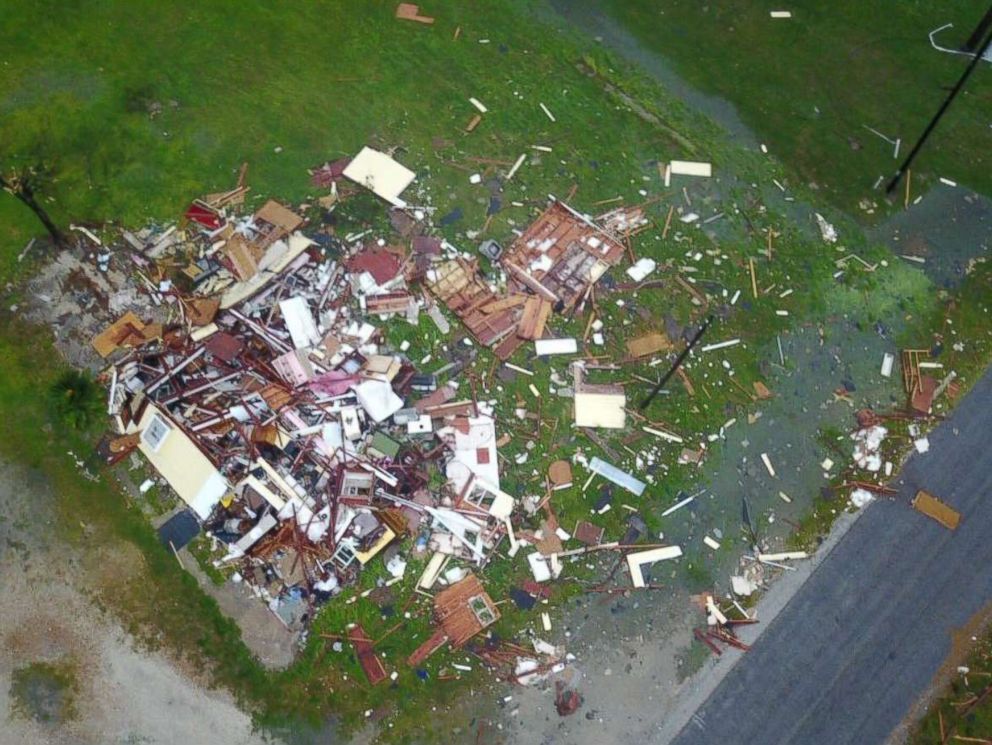
More photo coverage of Rockport can be found here. For some reason the photo credit that is on the photo in the article does not show up when I display the photo separately. It is Brian Emfinger/LSM
We should expect that damage reports may come in slowly since may areas have been evacuated and the media may not be allowed in until the areas are deemed to be save from down power lines etc.
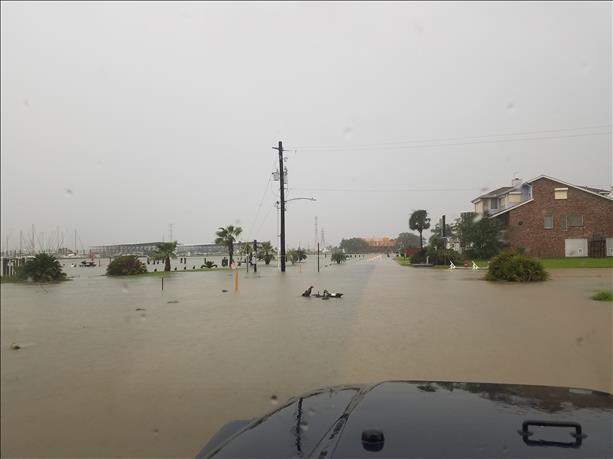
Tornadoes will cause a lot of damage. Right now they seem to be happening in the Cypress Area Northwest of Houston while in Houston flooding has been significant.
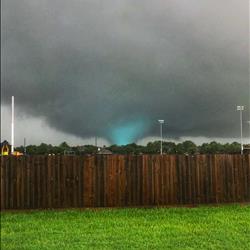
Source: Houston News KHOU
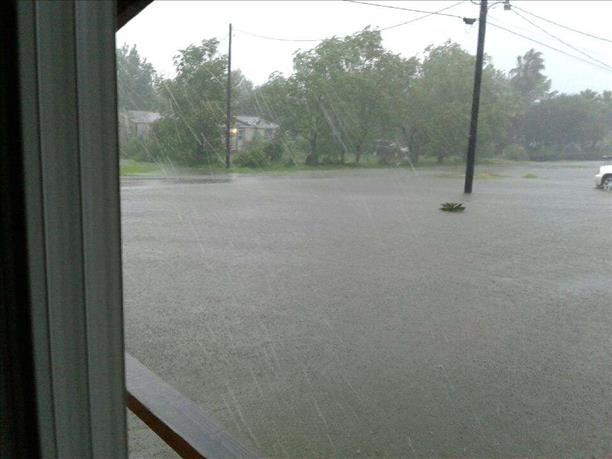
Same source for photos below: KHOU with the first photo credited to Kyra Respress.
and one more.
So far the reports of injured and deaths are amazingly low. That might change.
This is an excellent report from the Daily Mail in the UK – Lots of photos.
What Happens Next
It is important to understand that natural disasters often occur over a period of time, not instantaneously.
A good example is the rising of rivers which then overflow their banks and cause damage many hours and even days after the advent of a widespread storm. It takes time for this to happen and with Harvey we have a storm that is likely to provide the time for such subsequent events. Below, from NOAA, is a forecast for the San Bernard River. It is already at flood stage. Not sure how the river can rise to 35 feet once the level is so high that it can no longer be confined by the river banks but the graphic may be intended to show the severe level that is predicted. (If the normal level is x feet below the average river bank height, then all land within 35-x feet in elevation above normal water level will be flooded.)


>>>>> Scroll down to view and make comments
|
|
|
|


